BPCE_PILLAR III 2025
-

-
Pillar III risk report - 2025
The purpose of Pillar III is to establish market discipline through a series of reporting requirements. These requirements – both qualitative and quantitative – are intended to improve financial transparency in the assessment of exposure to risks, risk assessment procedures and capital adequacy.
Pillar III thus enriches the minimum capital requirements (Pillar I) and the prudential supervision process (Pillar II).
www.groupebpce.com -
Foreword
Regulation (EU) 2024/1623 (“CRR3”) introduced new disclosure requirements and modified existing ones applicable from January 1, 2025. The main adjustments to prudential reporting requirements relate to: the output floor, credit risk, market risk, CVA (Credit Valuation Adjustment) risk, operational risk and the transitional treatment of exposures to crypto-assets. - Section 1 presents the key figures, the type of risks and the regulatory context;
- Section 2 is dedicated to risk factors;
- Section 3 explains the overall organization of Groupe BPCE’s risk management framework;
- Section 4 is dedicated to capital management and capital adequacy;
- Section 5 summarizes the main elements relating to credit risk management;
- Section 6 presents counterparty risk;
- securitization transactions are detailed in Section 7;
- market risks are presented in Section 8;
- liquidity, interest rate and foreign exchange risk is detailed in Section 9;
- the following Sections 10 to 15 provide detailed information on the other main risks;
- environmental, social and governance risks are presented in Section 16;
- reputation risk is presented in section 17.
Each section describes the principles of organization and risk management, presents an overview of the essential information and sets out detailed quantitative information in a dedicated section.
-
Key indicators
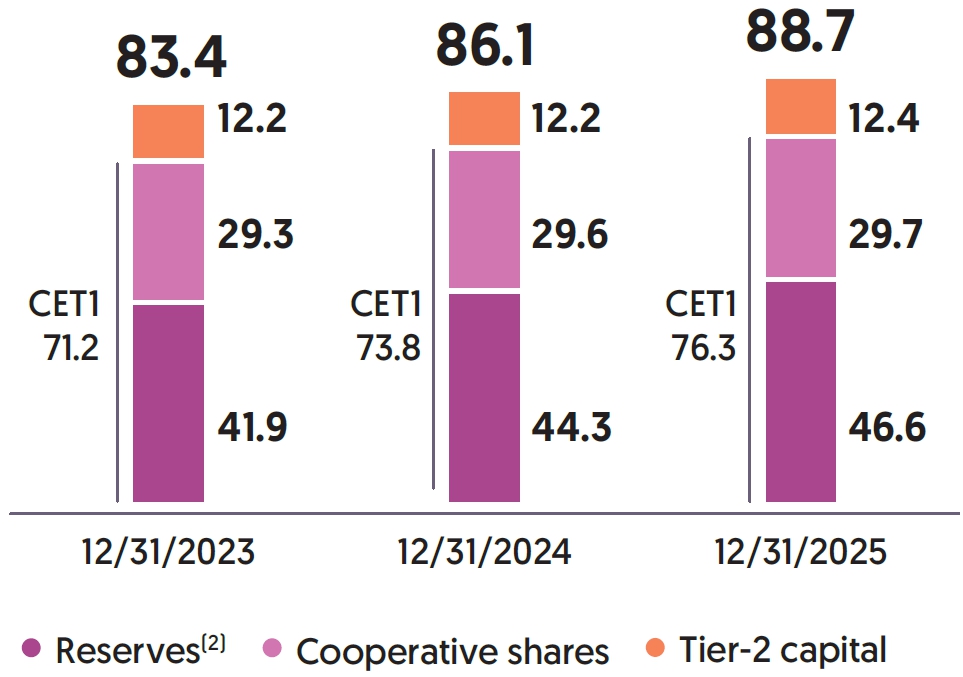
Capital adequacy ratios 1 (as a %) Total capital 1 (in billions of euros) 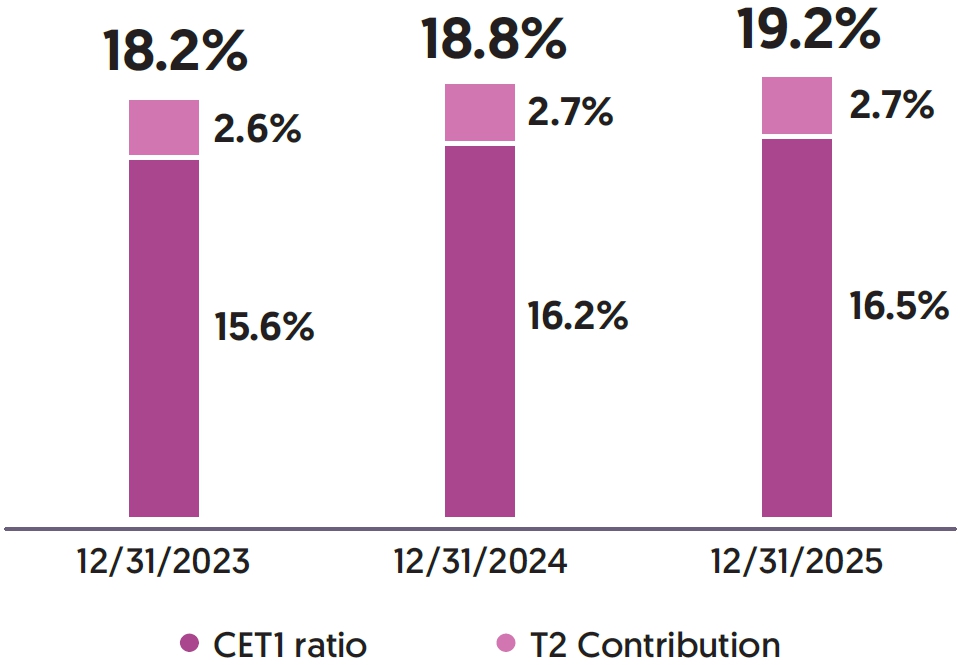
(2) Reserves net of prudential restatements. Risk-weighted assets by type of risk Risk-weighted assets by business line 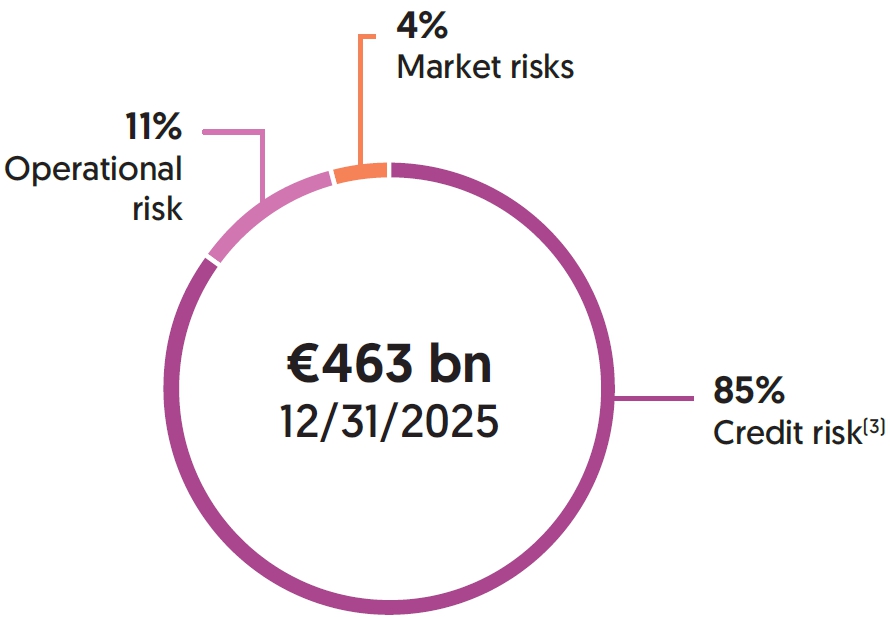
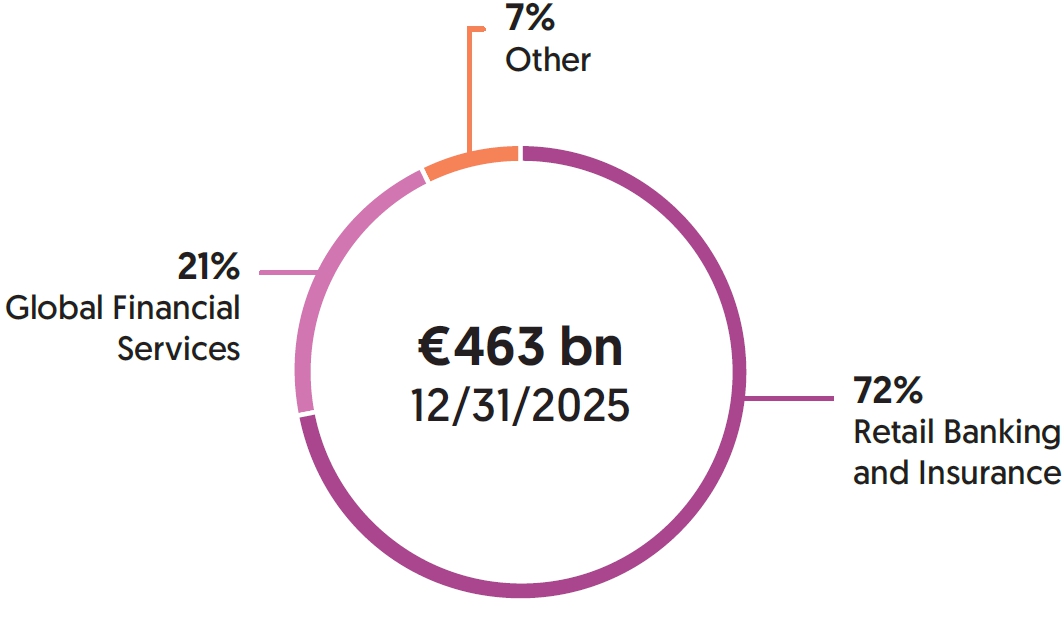
(3) Including settlement-delivery risk. TLAC ratio (as a % of RWAs) MREL ratio (as a % of RWAs) 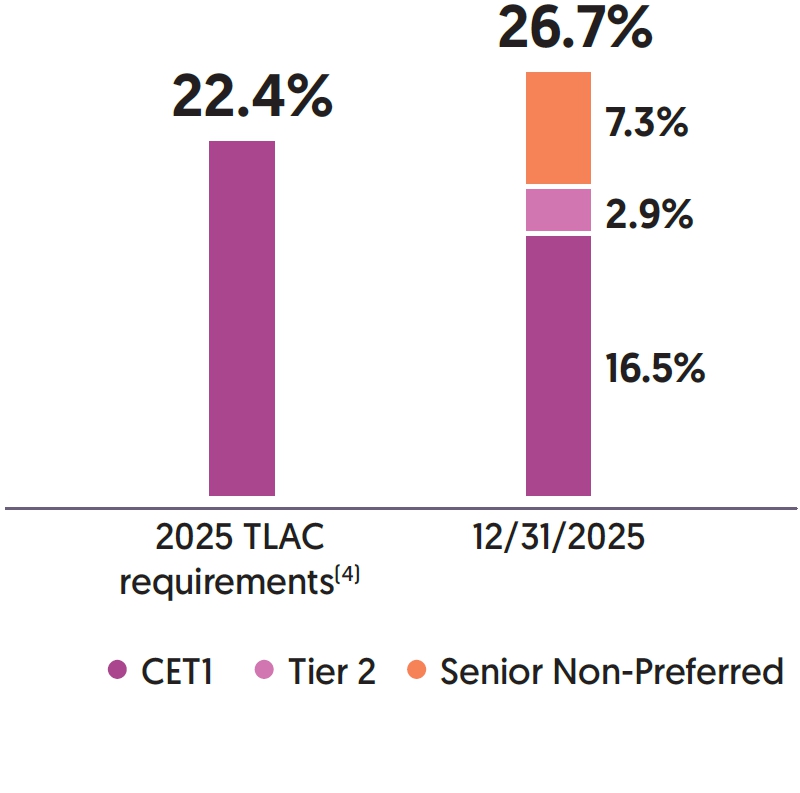
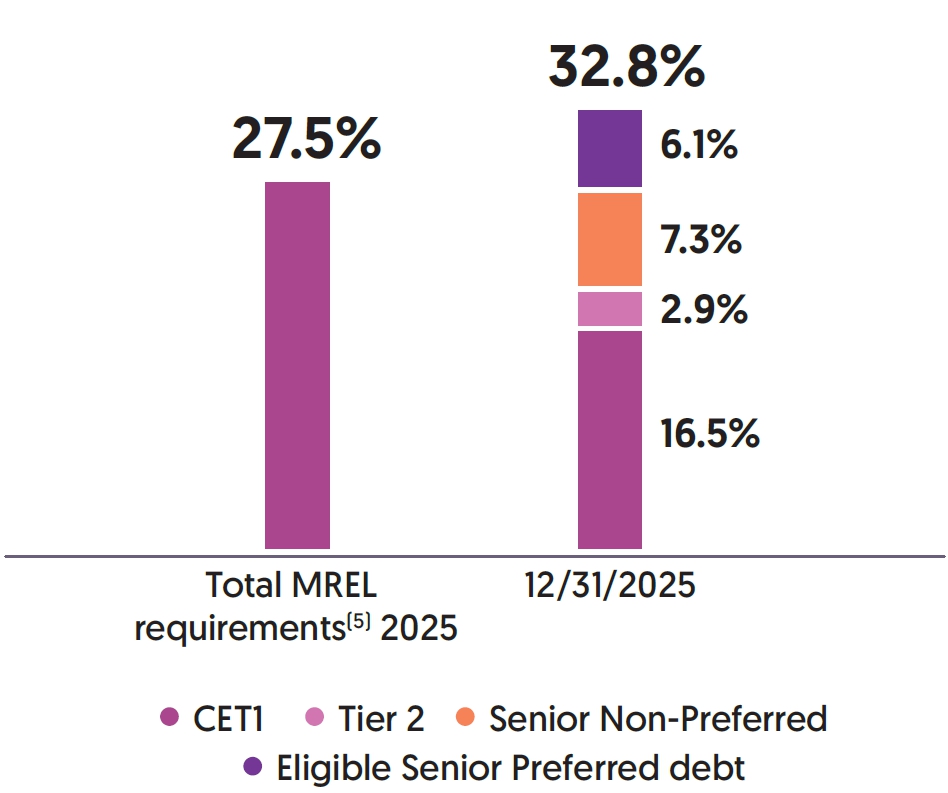
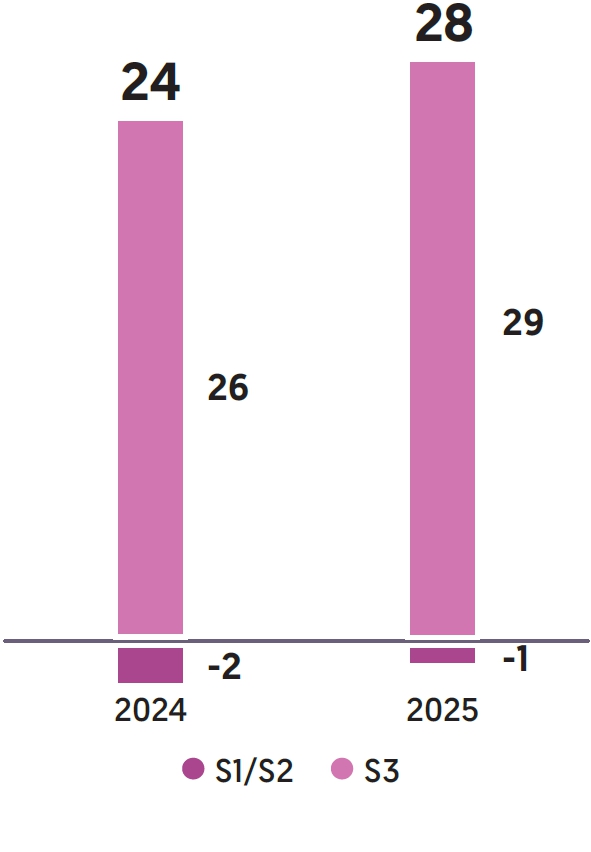
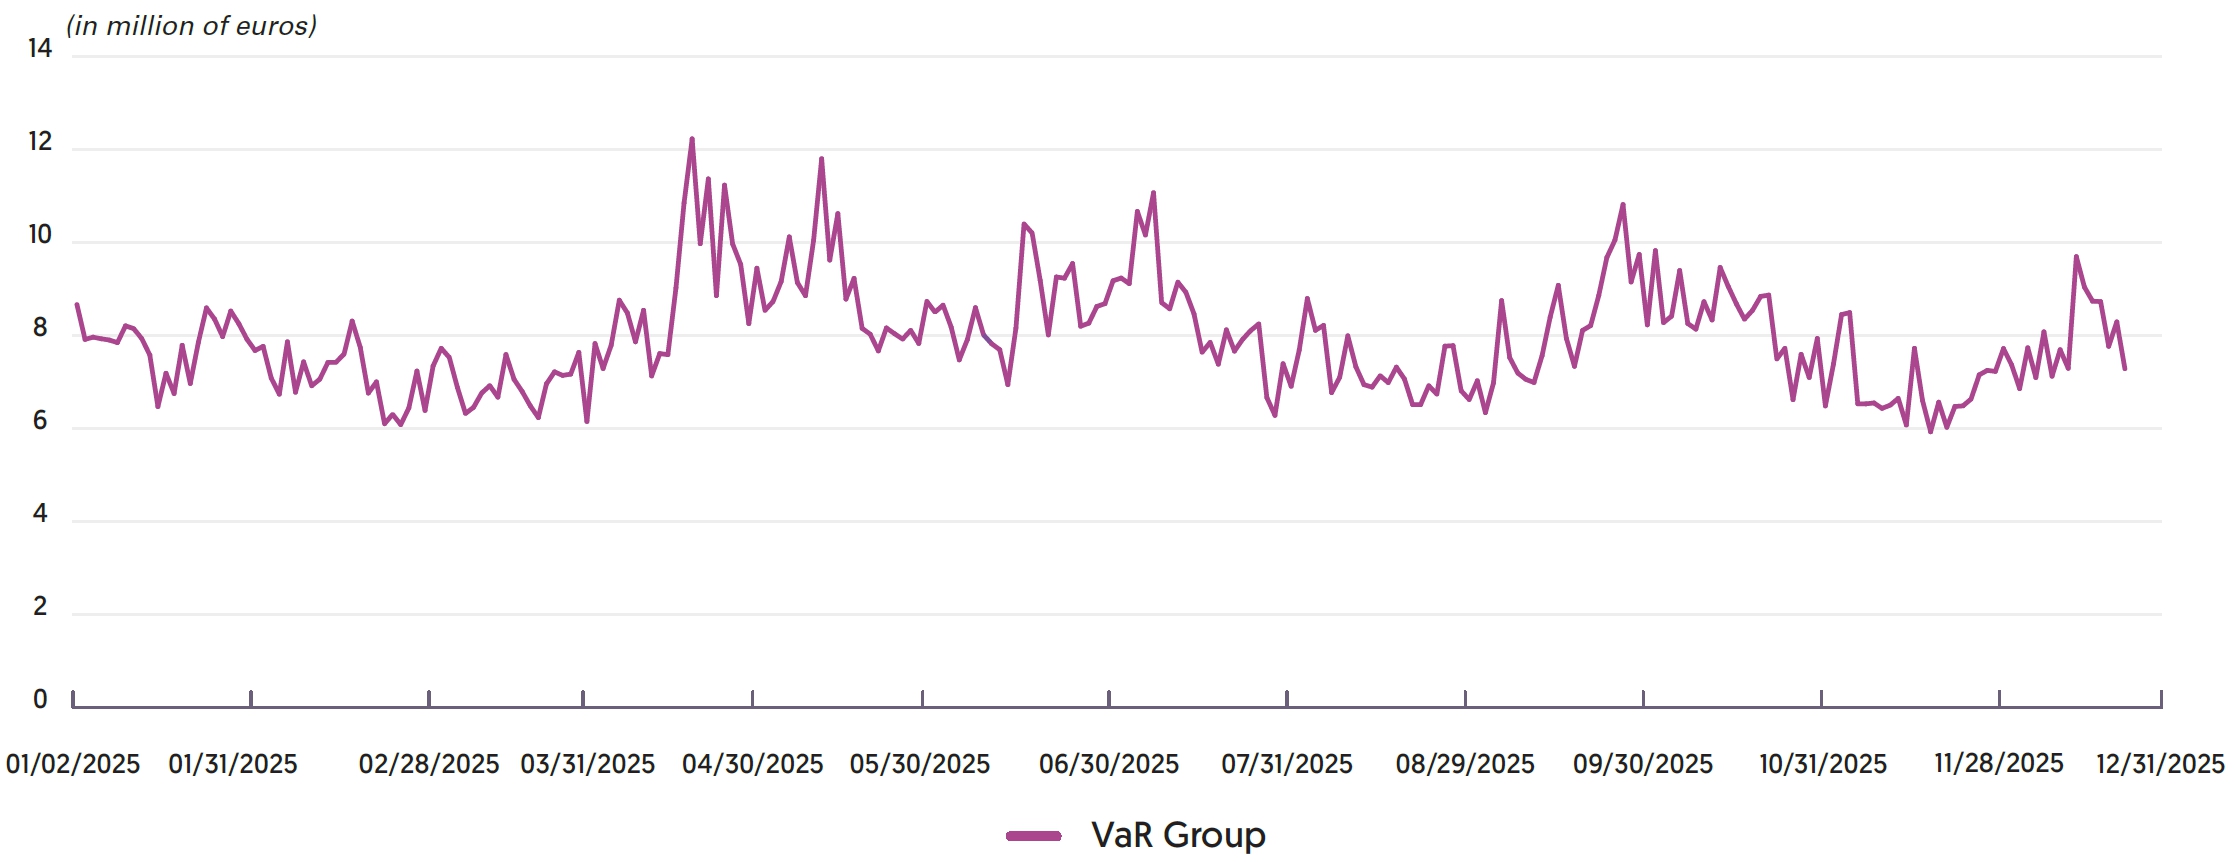
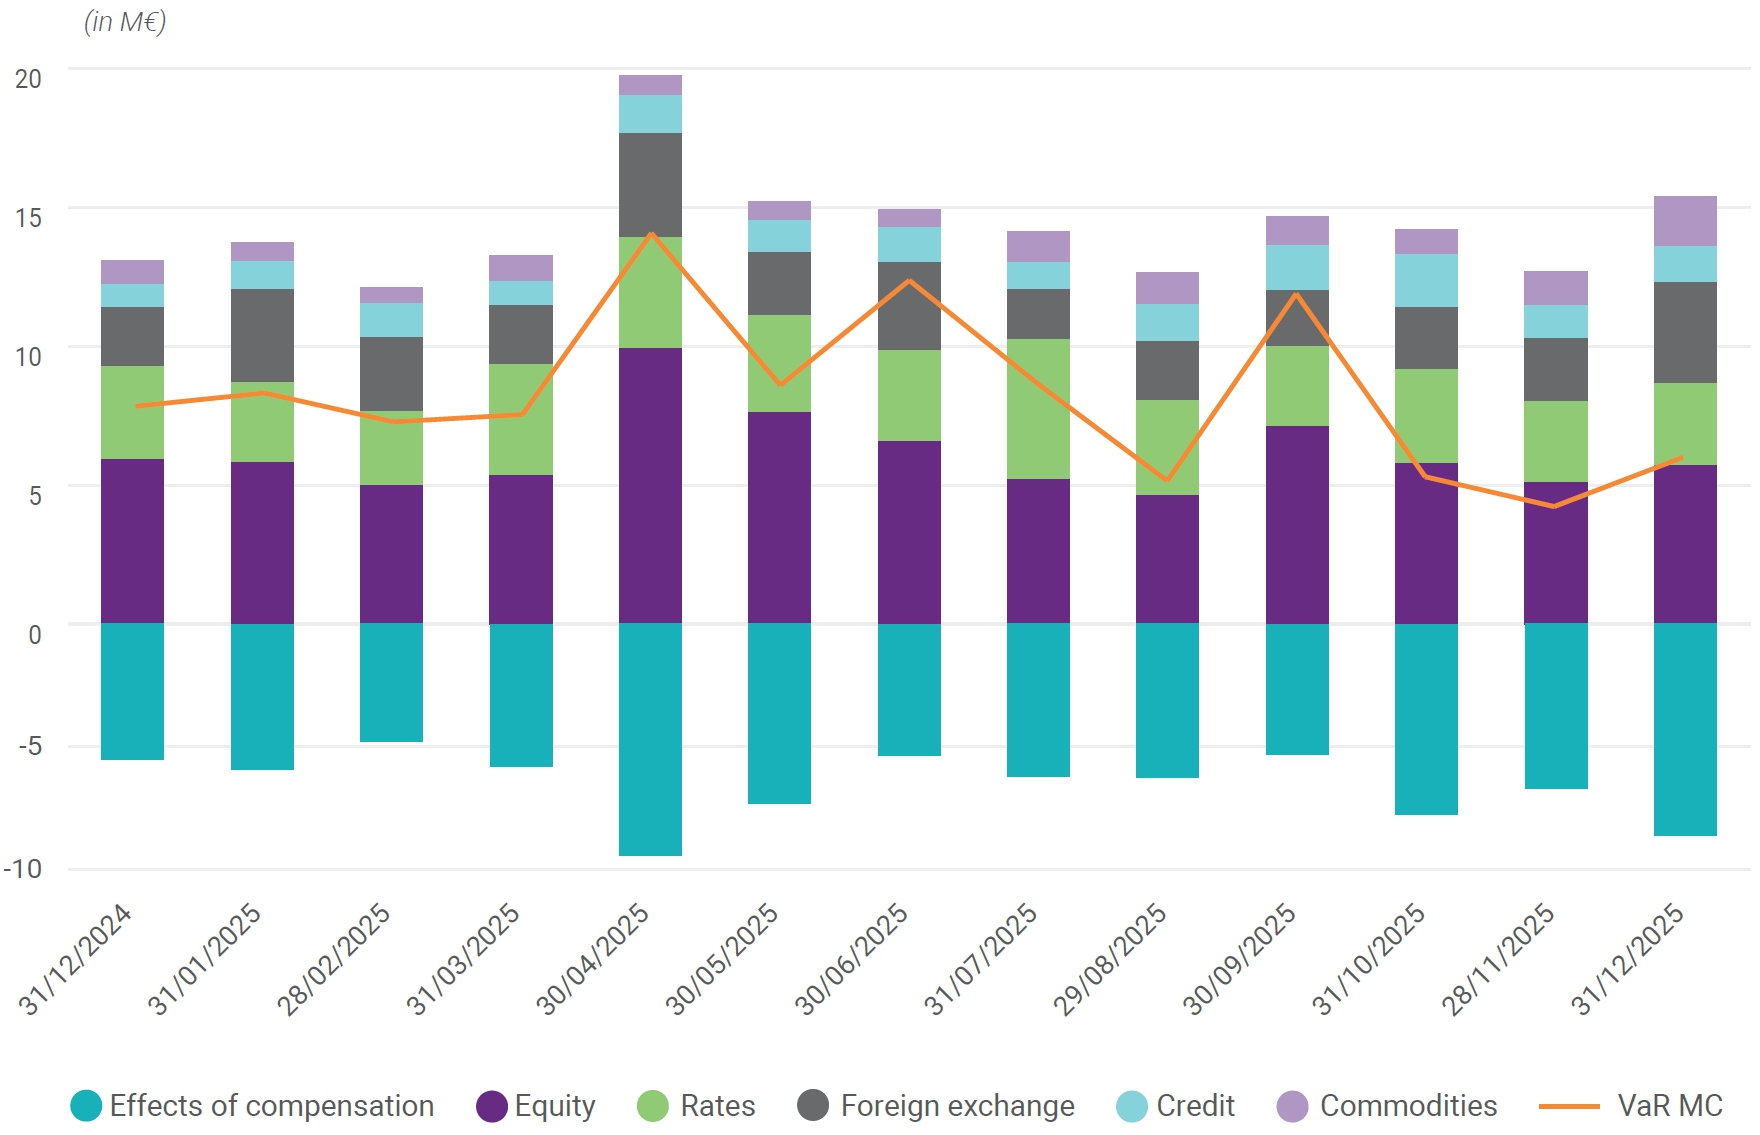
(4) Based on the Financial Stability Board TLAC term sheet dated November 9, 2015. (5) Following the receipt of the MREL 2025 annual letter. Additional indicators 12/31/2025 12/31/2024 Cost of risk (in basis points) 28 24 Ratio of non-performing/gross loan outstandings 2.7% 2.5% Impairment recognized/gross loan outstandings 39.4% 39.9% Groupe BPCE’s consolidated VaR (in millions of euros) 7.3 7.9 Liquidity reserves (in billions of euros) 305 302 EU KM1 – Key metrics template a b c d e in millions of euros 12/31/2025 09/30/2025 06/30/2025 03/31/2025 12/31/2024 Available own-funds (amounts) 1 Common Equity Tier 1 (CET1) capital 76,310 74,641 73,709 73,223 73,847 2 Tier 1 capital 76,310 74,641 73,709 73,223 73,847 3 Total capital 88,757 87,100 86,391 86,835 86,057 Risk-weighted exposure amounts 4 Total risk exposure amount 463,054 455,029 451,854 451,453 456,591 4a Total risk exposure pre- floor 463,054 455,029 451,854 451,453 - Capital ratios (as a percentage of risk-weighted exposure amount) 5 Common Equity Tier 1 ratio (%) 16.48% 16.40% 16.31% 16.22% 16.17% 5b Common Equity Tier 1 ratio considering un floored TREA (%) 16.48% 16.40% 16.31% 16.22% 0.00% 6 Tier 1 ratio (%) 16.48% 16.40% 16.31% 16.22% 16.17% 6b Tier 1 ratio considering un floored TREA (%) 16.48% 16.40% 16.31% 16.22% 0.00% 7 Total capital ratio (%) 19.17% 19.14% 19.12% 19.23% 18.85% 7b Total capital ratio considering un floored TREA (%) 19.17% 19.14% 19.12% 19.23% 0.00% Additional own funds requirements to address risks other than the risk of excessive leverage (as a percentage of risk-weighted exposure amount) EU 7d Additional own funds requirements to address risks other than the risk of excessive leverage (%) 2.25% 2.25% 2.25% 2.25% 2.10% EU 7e of which: to be made up of CET1 capital (percentage points) 1.27% 1.27% 1.27% 1.27% 1.18% EU 7f of which: to be made up of Tier 1 capital (percentage points) 1.69% 1.69% 1.69% 1.69% 1.58% EU 7g Total SREP own funds requirements (%) 10.25% 10.25% 10.25% 10.25% 10.10% Combined buffer and overall capital requirement (as a percentage of risk-weighted exposure amount) 8 Capital conservation buffer (%) 2.50% 2.50% 2.50% 2.50% 2.50% EU 8a Conservation buffer due to macro-prudential or systemic risk identified at the level of a Member State (%) 0.00% 0.00% 0.00% 0.00% 0.00% 9 Institution specific countercyclical capital buffer (%) 0.90% 0.90% 0.90% 0.90% 0.90% EU 9a Systemic risk buffer (%) 0.00% 0.00% 0.00% 0.00% 0.00% 10 Global Systemically Important Institution buffer (%) 1.00% 1.00% 1.00% 1.00% 1.00% EU 10a Other Systemically Important Institution buffer (%) 1.00% 1.00% 1.00% 1.00% 1.00% 11 Combined buffer requirement (%) 4.40% 4.40% 4.40% 4.40% 4.40% EU 11a Overall capital requirements (%) 14.65% 14.65% 14.65% 14.65% 14.50% 12 CET1 available after meeting the total SREP own funds requirements (%) 8.79% 8.72% 8.62% 8.53% 8.60% Leverage ratio 13 Total exposure measure 1,489,339 1,479,194 1,457,183 1,451,653 1,435,845 14 Leverage ratio (%) 5.12% 5.05% 5.06% 5.04% 5.14% Additional own funds requirements to address the risk of excessive leverage (as a percentage of total exposure measure) EU 14a Additional own funds requirements to address the risk of excessive leverage (%) 0.00% 0.00% 0.00% 0.00% 0.00% EU 14b of which: to be made up of CET1 capital (percentage points) 0.00% 0.00% 0.00% 0.00% 0.00% EU 14c Total SREP leverage ratio requirements (%) 3.00% 3.00% 3.00% 3.00% 3.00% Leverage ratio buffer and overall leverage ratio requirement (as a percentage of total exposure measure) EU 14d Leverage ratio buffer requirement (%) 0.50% 0.50% 0.50% 0.50% 0.50% EU 14e Overall leverage ratio requirement (%) 3.50% 3.50% 3.50% 3.50% 3.50% Liquidity Coverage Ratio 15 Total high-quality liquid assets (HQLA) (Weighted value - average) 203,374 200,876 201,384 205,495 206,456 EU 16a Cash out flows – Total weighted value 244,388 242,962 240,683 238,883 234,163 EU 16b Cash in flows – Total weighted value 103,924 105,165 104,076 100,949 95,804 16 Total net cash out flows (adjusted value) 140,464 137,797 136,607 137,934 138,359 17 Liquidity coverage ratio (%) 145.05% 145.93% 147.51% 149.08% 149.33% Net Stable Funding Ratio 18 Total available stable funding 941,516 919,225 915,056 908,570 885,232 19 Total required stable funding 859,599 860,009 853,798 844,528 825,703 20 NSFR ratio (%) 109.53% 106.89% 107.17% 107.58% 107.21% -
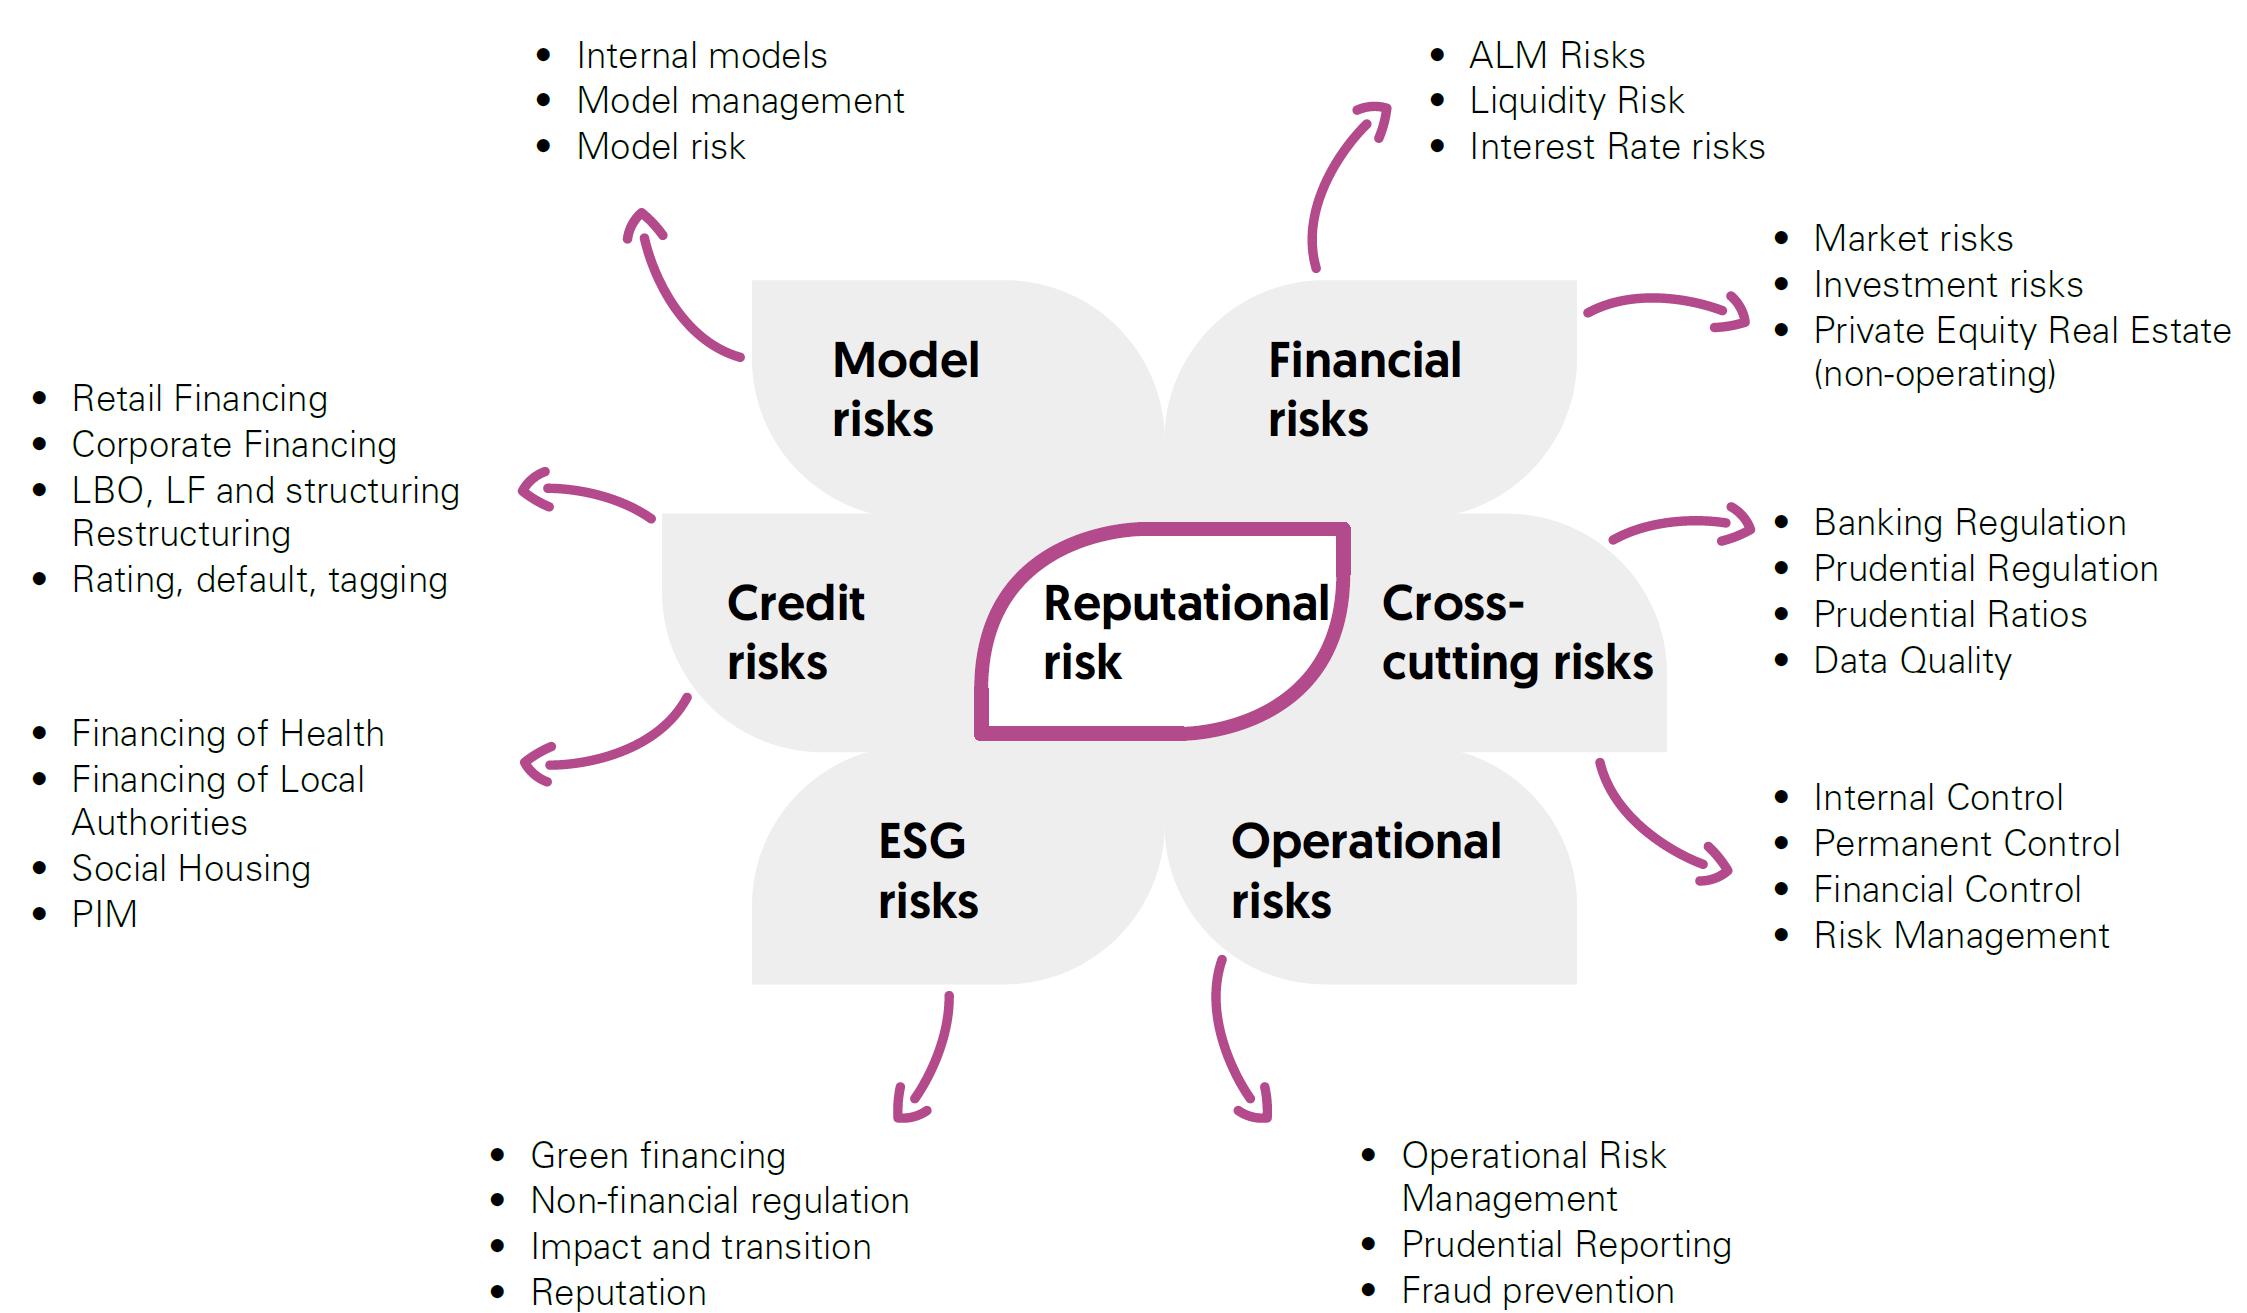
1.1 Types of risk
Risk macro-categories Definition Credit and counterparty risk • Credit risk The risk of loss from the inability of clients, issuers or other counterparties to honor their financial commitments. It includes counterparty risk related to market transactions (replacement risk) and securitization activities. It can be exacerbated by concentration risk. • Securitization risks Transactions for which the credit risk inherent in a set of exposures is housed in a dedicated structure (generally a mutual fund or “conduit”) and then divided into tranches for acquisition by investors. Financial risks • Market risks The risk of loss of value on financial instruments resulting from changes in market inputs, from the volatility of these inputs or from the correlations between these inputs. Inputs include exchange rates, interest rates and prices of securities (equities, bonds), commodities, derivatives or any other assets, such as real estate assets. • Liquidity risk The risk that the Group cannot meet its cash requirements or collateral requirements when they fall due and at a reasonable cost. • Structural interest rate risks The risk of loss in interest income or in the value of a fixed-rate structural position in the event of changes in interest rates. Structural interest rate risks are associated with commercial activities and proprietary transactions. • Credit spread risk The risk associated with a decline in the creditworthiness of a specific issuer or a specific category of issuers. • Foreign exchange risk The risk of loss in interest income or in the value of a fixed-rate structural position in the event of changes in exchange rates. Structural interest rate and exchange rate risks are associated with commercial activities and proprietary transactions. Non-financial risks • Non-compliance risk The risk of a legal, administrative or disciplinary penalty, material financial loss or reputational risk arising from a failure to comply with the provisions specific to banking and financial activities (whether these are stipulated by directly applicable national or European laws or regulations), with professional or ethical standards, or instructions from executive management, notably issued in accordance with the policies of the supervisory body. • Operational risk The risk of losses arising from the inadequacy or failure of internal processes, people and systems or from external events, including legal risk. Operational risk includes risks related to events with a low probability of occurrence but a high impact, the risks of internal and external fraud defined by the regulations, and risks related to the model. • Insurance underwriting risk In addition to asset-liability risk management (interest rate, valuation, counterparty and exchange rate risks), these risks include pricing risk in respect of mortality risk premiums and structural risks related to life and non-life insurance activities, including pandemics, accidents and disasters (earthquakes, hurricanes, industrial accidents, terrorist acts and military conflicts). • Model risk Model risk is defined as the risk of adverse consequences - financial loss and/or possible damage to the Group’s reputation - resulting from model-based decisions due to errors in the design, implementation or use of these models. • Legal risk Legal risk defined in French regulations as the risk of any dispute with a counterparty, resulting from any inaccuracy, lacunae or insufficiency that may be attributable to the company in respect of its operations. • Reputational risk Reputational risk is defined as the risk of damage to the trust of the company, its clients , counterparties, suppliers, employees, shareholders, supervisors or any other third party whose trust, in any capacity whatsoever, is a necessary condition for the normal continuation of the activity. Strategic business and ecosystem risks • Solvency risk The risk that the company will be unable to honor its long-term commitments and/or ensure the continuity of its ordinary operations in the future. • ESG risks Environmental, social and governance risks: direct and indirect risks (i.e. via assets/liabilities held) arising from extreme or chronic physical risk events related to climate and the environment (loss of biodiversity, pollution, etc.), risks related to the transition to a low-carbon economy with lower environmental impact (regulatory, technological or stakeholder behavior changes), risks related to social issues (rights, well-being, interests of people and stakeholders) or corporate governance issues (ethics and culture, supplier relations, business conduct). These risks are expressed through the main risk categories to which Groupe BPCE is exposed. -
1.2 Regulatory changes
The new banking package (CRR3 regulation and CRD6 directive) was published on June 19, 2024, in the Official Journal of the European Union.
This banking package implements the final component of the Basel III regulatory reform. Most provisions of the CRR3 regulation are applicable from January 1, 2025. However, the rules concerning market risks have been postponed by one year to January 1, 2027, in order to maintain a consistent global regulatory framework.
The governance of financial institutions is at the heart of the provisions of the CRD6 directive, the transposition of which is still ongoing despite the deadline of January 10, 2026.
CRR3 introduces significant technical modifications that directly influence risk management in banks. These adjustments primarily concern the methods for calculating credit risks, market risks, and credit valuation adjustments (CVA). Furthermore, CRR3 imposes more rigorous reporting and data collection standards to enhance the transparency and comparability of financial information.
Among the key issues, the introduction of the output floor (which establishes that capital requirements calculated using internal models cannot fall below 72.5% of the requirements set out by the standardized approach) is of major importance.
The European authorities are considering simplifying the prudential regulations. The Commission intends to address this issue through the report to be published in 2026, which will focus in particular on the functioning of the Banking Union, the contribution of the latest reforms for financial stability and the implementation of the output floor.
With regard to the resolution framework, the Commission, Parliament and Council managed to reach a trilateral political agreement on June 25, 2025 on the revision of the crisis management and deposit insurance framework (CMDI). In France, Article 2-I of the DDADUE 2025 law transposes various provisions of the 2024/1174 directive “Daisy Chains II”.
The regulatory agenda remains robust for banks, and Groupe BPCE is closely monitoring the issues, whether they pertain to the banking sector or the broader economic environment and its cooperative banking model.
The Digital Operational Resilience Act (DORA) came into effect on January 17, 2025. The requirements of this regulation relate to the management of risks associated with information technology and aim to mitigate cyberattacks and other risks linked to information systems. It includes provisions on the governance of financial entities, risk management, and the reporting of ICT (Information and Communication Technologies) related incidents, and introduces resilience testing every three years. On January 17, 2025, the European Supervisory Authorities published a report studying the feasibility of strengthening the centralization of major ICT-related incident reporting, and, in July 2025, they presented a guide for the monitoring of critical third-party providers. On July 16, 2025, the ECB published a guide on the outsourcing of cloud services, which complements the DORA regulation.
Directive (EU) 2023/2225 on consumer credit contracts was published in the Official Journal of the European Union on October 30, 2023. The transposition order was published on September 3, 2025, and the new regime will be fully applicable from November 20, 2026. The main developments concern the scope (a new definition of the credit contract concluded between a lender and a consumer, which effectively excludes the GAFAM), the establishment of a mandatory creditworthiness assessment, the enhancement of pre-contractual information, as well as the modalities for conducting activities for providers not falling under sectoral regulation.
The 2002/65 directive concerning the distance marketing of financial services to consumers, known as the Distance Marketing in Financial Services Directive (DMFSD), has finally been repealed and replaced by the 2023/2673 directive, set to apply from June 19, 2026. The changes concern, in particular, pre-contractual information and the facilitation of the right of withdrawal, through the introduction of a “withdrawal function” accessible via the service provider’s interface. The transposition texts for this directive were published on January 6, 2026.
The European Commission published a set of measures on May 24, 2023, known as the “Retail Investment Package,” aimed at enhancing the protection of retail clients in terms of investment in financial products. While the formal prohibition of inducements is now excluded, the Council’s position of June 12, 2024, introducing an “inducement test,” which could effectively become a de facto prohibition, calls for heightened vigilance regarding the ongoing discussions. The completion of simplification work on these texts is expected for the first quarter 2026.
The proposal to revise the Payment Services Directive (PSD3) presented by the European Commission on June 28, 2023, was amended by the European Parliament during its plenary session on April 23, 2024. This proposal also contributes to the development of open banking (access to banking and financial data). Impact assessments are ongoing. An agreement was reached in trilogue on November 26, 2025. The final text should be published in the first quarter of 2026, for an entry into application in late 2027.
It should also be noted that Articles 2 V and VI of the DDADUE 2025 law participate in the implementation of Regulation 2024/886 concerning instant payments, applicable since January 9, 2025.
On June 28, 2023, the European Commission published its proposal for a regulatory framework for financial data access (Framework for Financial Data Access - FIDA), previously referred to as “open finance.” This initiative is part of the European Commission’s digital finance strategy, which aims to establish a European financial data space. The trilogues began in 2025. The regulation known as the AI act, dated June 13, 2024, establishes the first legal framework for artificial intelligence in Europe. This regulation will come into effect on August 2, 2026, but some measures will be implemented starting February 2, 2025 (prohibiting high-risk AI). However, the publication of the draft “Digital Omnibus” regulation on November 21, 2025 by the European Commission, as well as its subsequent developments, will be closely followed by the banking sector due to the major changes expected concerning, among other matters, the AI Act.
Ordinance 2023-1142 of December 7, 2023, transposing Directive 2022/2464 regarding the publication of sustainability information by companies, known as CSRD, applies to reports published in 2025. It is set to be amended within the framework of Articles 7 to 12 of the DDADUE 2025 law adopted on February 17, 2025. Two proposals for directives known as Omnibus I were published on February 26, 2025, aimed specifically at postponing and modifying the CSRD, the CS3D and the Taxonomy Regulation. A second Omnibus Directive, adopted on December 16, 2025, modified the thresholds for being subject to the CSRD.
The legislative package presented by the European Commission in July 2021 completely overhauls the European framework regarding AML-CTF, particularly by strengthening the harmonization of the rules applicable to customer due diligence and vigilance, redefining the compliance functions, and establishing a new authority, the AMLA, which is based in Frankfurt. The two draft regulations AMLAR and AMLR, as well as the draft directive AMLD, were published in the Official Journal of the European Union on June 19, 2024 and most of their provisions will enter into force on July 10, 2027.
-
2.1 Risk factors
The banking and financial environment in which Groupe BPCE operates is exposed to numerous risks and requires the implementation of an increasingly demanding and strict policy to control and manage these risks. Some of the risks to which Groupe BPCE is exposed are set out below. However, this is not a comprehensive list of all of the risks incurred by Groupe BPCE in the course of conducting its business or given the environment in which it operates. The risks presented below are those identified to date as significant and specific to Groupe BPCE, and liable to have a material adverse impact on its business, financial position and/or results. For each of the risk sub-classes listed below, the risk factor considered to date by Groupe BPCE as the most significant is listed first. The risks presented below are those identified to date as liable to have an adverse impact on the businesses of BPCE SA. The risk factors described below are presented as of the date of this document and the situation described may change, even significantly, at any time. Groupe BPCE is exposed to credit and counterparty risks that could have a material adverse effect on the Group’s business, financial position and income.
Groupe BPCE remains significantly exposed to credit and counterparty risk through its financing or market activities. Despite vigilance aimed at limiting concentrations, particularly unit concentrations, defaults may occur within the same sector or the same geographic area due to the interdependencies between counterparties. In the event of default by one or more counterparties, or if the collateral does not fully cover the exposure, the Group could incur losses affecting its cost of risk, results and financial position.
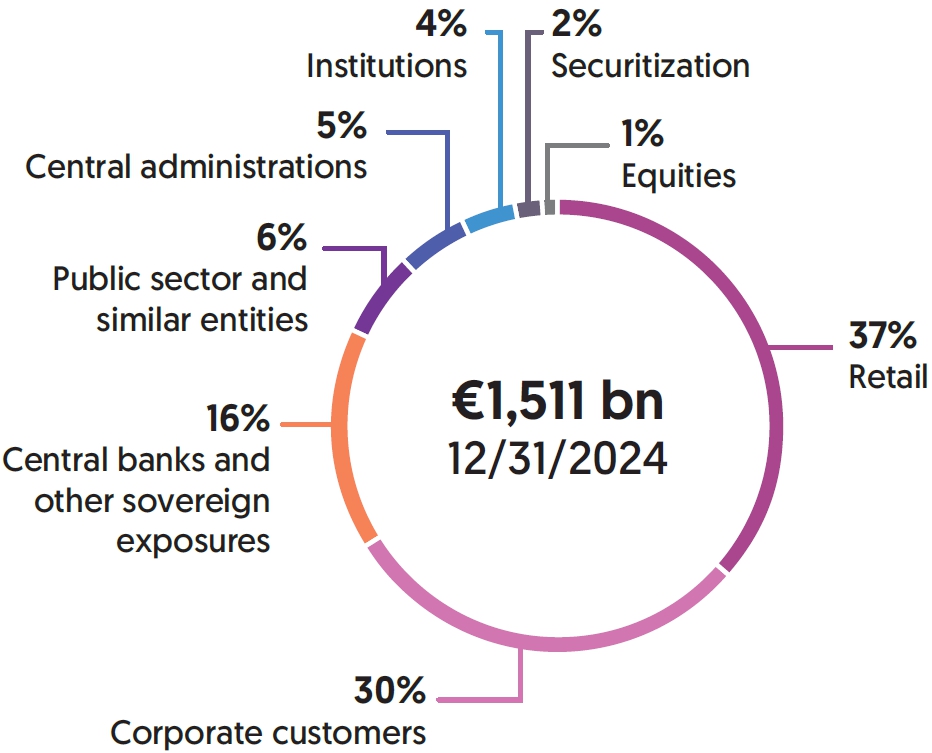
At December 31, 2025, gross exposure to credit risk amounted to €1,552 billion, with the following breakdown: 37% from retail customers, 31% from corporates, 15% from central banks and sovereign exposures, 6% in the public sector and similar. The credit risk-weighted assets amounted to €391 billion (including counterparty risk). For the non-financial corporations portfolio, the main sectors are Real Estate (37% of gross exposures), Wholesale and Retail Trade (11%), Finance/Insurance (10%) and Professional, scientific and technical activities (7%).
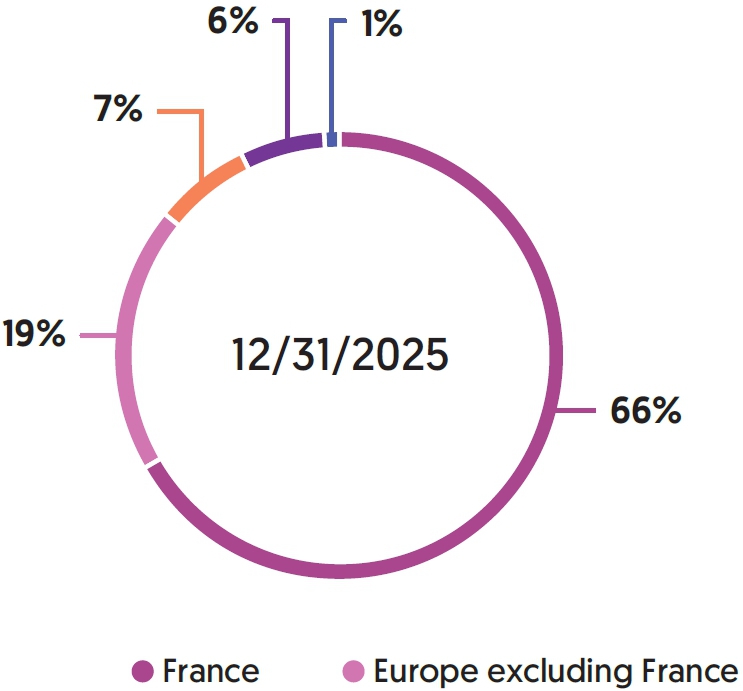
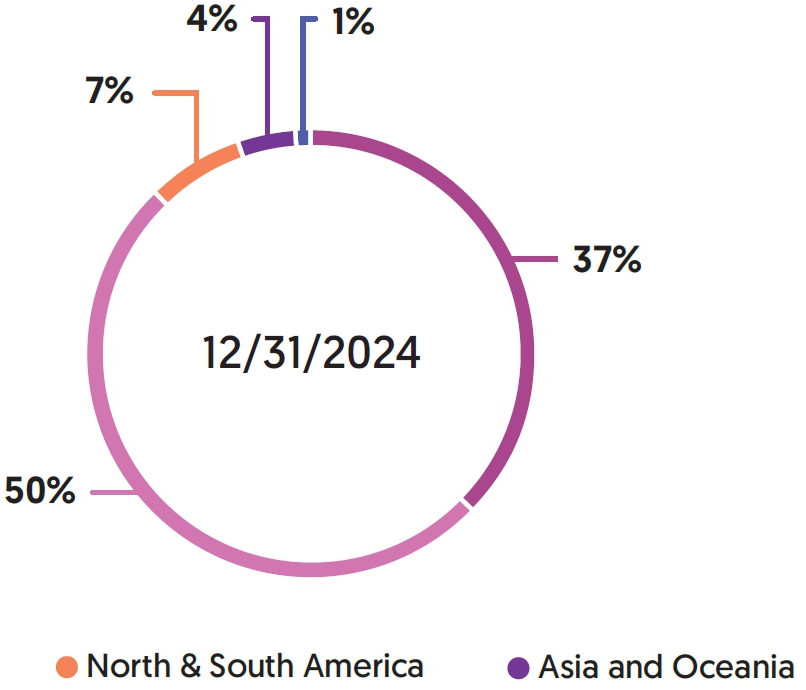
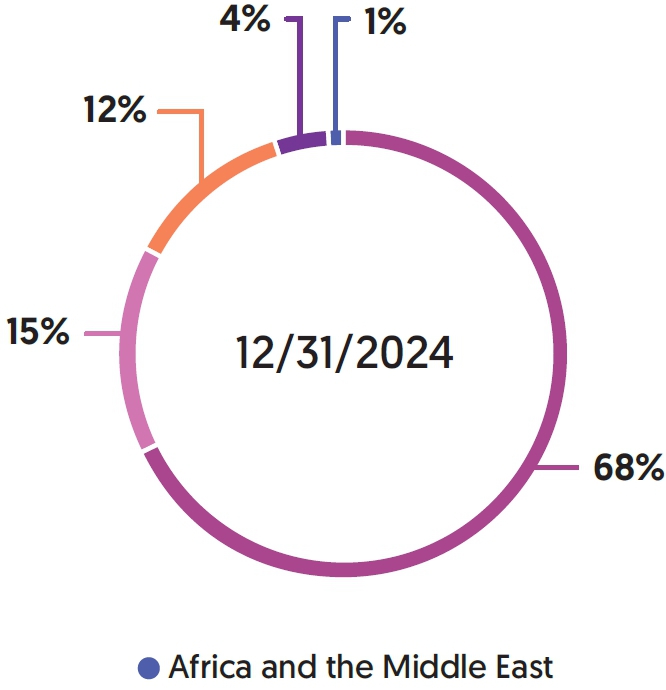
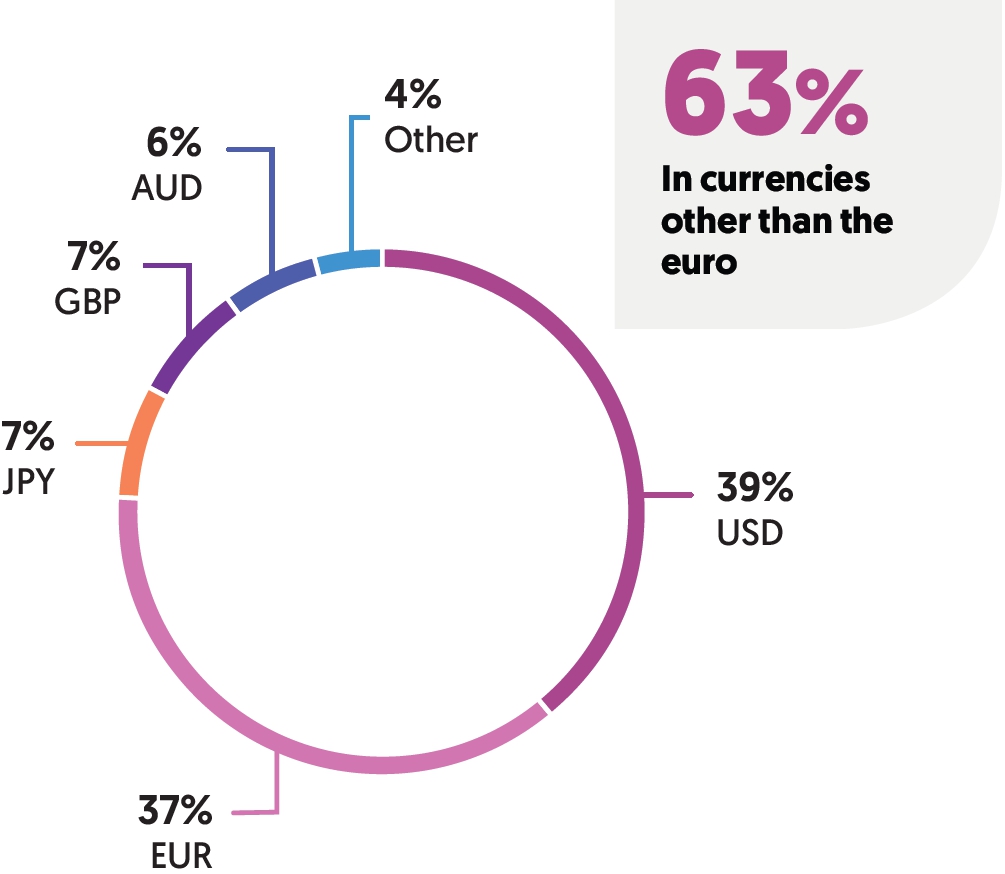
Groupe BPCE's activity is mainly concentrated in France, with a gross exposure of €1,186 billion, or 80% of the total. Exposures excluding France are mainly split between the United States (6%) and other countries (14%).
For further information, please see Sections 5 “Credit risk” and 6 “Counterparty risk” in this document.
A substantial increase in impairments or provisions for expected credit losses recognized in Groupe BPCE’s accounts could have a material adverse effect on its results and financial position.
The Group regularly recognizes impairment expenses to reflect actual or potential losses related to its loans and advances, its fixed-income securities (amortized cost or fair value through equity) and its commitments given. These impairments are booked in the income statement under “cost of risk”. The overall level of expenses depends on past losses on loans, volumes and types of loans, loans in payment arrears, economic conditions, other collection factors and applicable standards. Despite the Group's efforts to maintain an adequate level of provisions, a deterioration of non-performing assets or unfavorable market conditions, in particular in certain countries, may lead to an increase in expenses for losses on loans. This substantial increase in expenses, due to a significant revision of the estimated risk of loss inherent in the loan portfolio, or a loss on loans in excess of historical provisions could have a material adverse impact on Groupe BPCE's results and financial position.
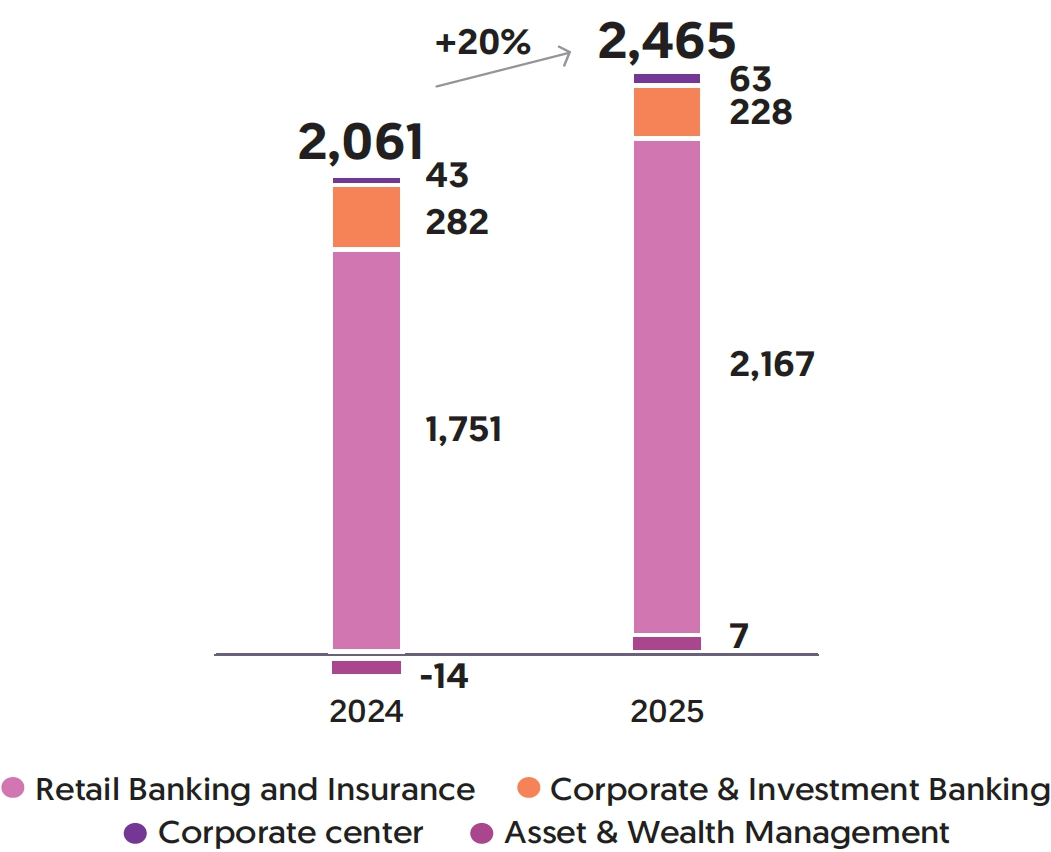
For information, the cost of risk amounted to -€2,465 million in 2025 compared to -€2,061 million in 2024, with credit risks accounting for 84% of the Group's risk-weighted assets. On the basis of gross exposures, 37% relate to retail customers and 31% to corporate customers (of which 65% of exposures are located in France).
Thus, the risk associated with a substantial increase in impairment expenses on the loans and advances portfolio remains significant in terms of both impact and probability, and is monitored carefully. In addition, prudential requirements supplement these provisioning mechanisms via the prudential backstop process, which provides for a deduction in equity of non-performing loans beyond a certain threshold in line with the quality of the guarantees and according to a regulatory timetable defined by regulatory texts.
A decline in the financial strength and performance of other financial institutions and market players may have an unfavorable impact on Groupe BPCE.
The interconnection of markets, particularly in trading, clearing, counterparty and financing, can amplify the effects of a liquidity crunch or sector default. A default by a significant sector player (systemic risk), or rumors that accentuate the risk, may lead to liquidity tensions and, in turn, additional losses or defaults for Groupe BPCE.
Groupe BPCE is directly or indirectly exposed to various financial counterparties – investment service providers, banks, clearing houses and central counterparties, mutual funds and hedge funds, as well as other institutional clients – for which any failure could adversely affect its financial position. In addition, the emergence of players with little or no regulation and of new products (in particular crowdfunding or trading platforms) constitutes an additional risk, aggravated if the assets held as collateral cannot be sold or do not cover the exposure in respect of defaulted loans or derivatives, or in the event of fraud, misappropriation of funds or another wrongdoing by financial sector players in general to which Groupe BPCE is exposed or another failure of a major market player, such as a central counterparty.
In addition, the distribution risk in the event of a difficult market or an unfavorable economic environment may also generate losses in a severe scenario.
The exposures to the “financial institutions” asset class represented 4% of Groupe BPCE’s total gross exposures, i.e. €62 billion at December 31, 2025, with 66% of the exposures in France.
Significant changes in interest rates may have a material adverse impact on Groupe BPCE’s net banking income and profitability.
The net interest margin constitutes a major portion of revenues and its evolution strongly influences results for the period. Resource costs and asset yields, particularly for new production, are sensitive to external factors and may cause temporary or lasting fluctuations, even if a rise in interest rates may be globally favorable in the medium/long term.
The recent environment has been marked by a sharp rise in interest rates until 2023, followed by the start of a loosening of monetary policy in 2024 in the Eurozone.
To offset this, the Group has passed on the high resource costs on new fixed-rate loans and has strengthened interest rate hedging notably via swaps (macro-hedging) in order to protect the balance sheet value and the future net interest margin.
Thus, although the high interest rate environment may be favorable in the long term, the changes observed can have significant and lasting repercussions. Groupe BPCE’s interest rate risk indicators reflect this exposure.
The sensitivity of the net present value of Groupe BPCE’s balance sheet to a +/-200 bps variation in interest rates remained lower than the 15% Tier-1 limit. At December 31, 2025, Groupe BPCE’s sensitivity to Tier-1 interest rate increases stood at -11.29% compared to -9.62% at December 31, 2024. This indicator, calculated according to a static approach (contractual or conventional flow of all balance sheet items) and in a stress scenario (immediate and significant interest rate shock), makes it possible to highlight the distortion of the balance sheet over a long horizon.
To better control the Group’s exposure to interest rate risk, this approach must be supplemented by a dynamic approach (including new production forecasts). Following regulatory changes and modifications of its management framework, since 2023 Groupe BPCE has deployed an internal revenue sensitivity indicator on the commercial banking networks and the Supervisory Outlier Test (SOT) Net Interest Margin (NIM) regulatory indicator at Group level, in addition to its internal indicators. The introduction of the SOT NIM supplements the information communicated as part of the interest rate risk management framework by a margin view over a one-year horizon, and must be published in the financial statements, even if it will not directly generate a Pillar I expense. At December 31, 2025, the most penalizing scenario for the Group in terms of the SOT NIM was the downside scenario. The indicator stands at -1.27% and remains below the 5% limit compared to Tier 1.
The dynamic approach in terms of sensitivity of future revenues is reinforced by a multi-scenario vision allowing a broader approach by taking into account the uncertainties related to business forecasts (new activity and changes in customer behavior), possible changes in commercial margin, etc. This is achieved through the sensitivity of the Group’s revenues by measuring the change in the Group’s forecast net interest margin at one year according to four scenarios (rise in rates, decline in rates, steepening of the yield curve, flattening of the yield curve) compared to the core scenario. This revenue sensitivity indicator covers all commercial banking activities and aims to estimate the sensitivity of the institutions’ results to interest rate fluctuations.
Groupe BPCE is dependent on its access to funding and other sources of liquidity, which may be limited for reasons outside its control, thus potentially having a material adverse impact on its results.
Access to short-term and long-term funding is critical for the conduct of Groupe BPCE’s business. Non-collateralized sources of funding for Groupe BPCE include deposits, issues of long-term debt and short/medium-term negotiable debt securities, banks loans and credit lines. Groupe BPCE also uses secured funding, notably through repurchase agreements and the issuance of covered bonds or securitization via dedicated vehicles or conduits. Geopolitical instabilities in the world with variable rate tranches can have an impact on arrears and default rates as well as on final legal maturities. If Groupe BPCE were unable to access the secured and/or unsecured debt market at conditions deemed acceptable, or incurred an unexpected outflow of cash or collateral, including a significant decline in customer deposits, its liquidity may be negatively affected. Furthermore, if Groupe BPCE were unable to maintain a satisfactory level of customer deposits (e.g. in the event its competitors offer higher rates of return on deposits), it may be forced to obtain funding at higher rates, which would reduce its net interest margin and results.
Liquidity could also be impacted by events beyond its control or unforeseeable, such as geopolitical or health crises, a resurgence of financial crises, operational difficulties of third parties, negative perceptions of financial services, rating changes or negative opinions about the state of the Group or the sector. Similarly, access to long-term funding and funding costs depend on credit spreads on the bond and credit derivatives markets, and remain liable to adversely affect its business, its financial position, its results and its ability to meet its obligations to its counterparties. Changes in monetary policy, particularly those of the ECB, may also affect Groupe BPCE's financial position.
To deal with these risks, the Group has significant liquidity reserves made up of cash deposits with central banks and available securities and receivables eligible for central bank refinancing mechanisms.
At December 31, 2025, the liquidity reserve stood at 197% of the short-term funding outstandings and the short-term maturities of the medium- and long-term loans, compared to 177% in 2024. The average 12-month liquidity coverage ratio (LCR) was 145% as of December 31, 2025 (versus 149% in 2024).
Given the importance of these risks for Groupe BPCE in terms of impact and probability, these risks are monitored proactively and closely, with Groupe BPCE also pursuing a very active policy of diversifying its investor base.
Downgraded credit ratings could have an adverse impact on BPCE’s funding cost, profitability and the continuity of some businesses.
At December 31, 2025, the long-term ratings were A+ (Fitch and S&P), A1 (Moody's) and A+ (R&I). A downward revision of these ratings could limit market access, increase borrowing costs, affect the liquidity and competitiveness of the Group, and impact profitability and trigger obligations under certain bilateral contracts for certain trading activities, derivatives and collateralized financing. The cost of unsecured long-term funding is directly related to the credit spread, which in turn is determined by rating and market conditions with sometimes unpredictable and very volatile fluctuations, and a widening spread can increase costs and weigh on profitability if the perception of creditworthiness deteriorates.
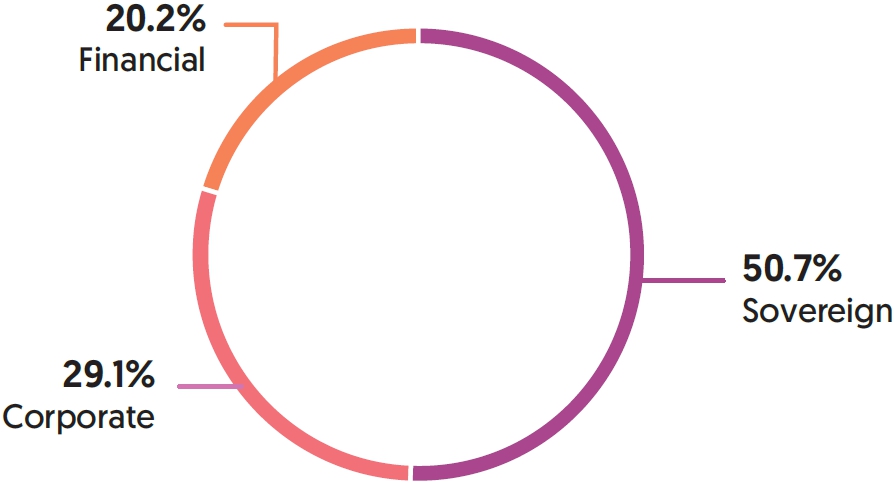
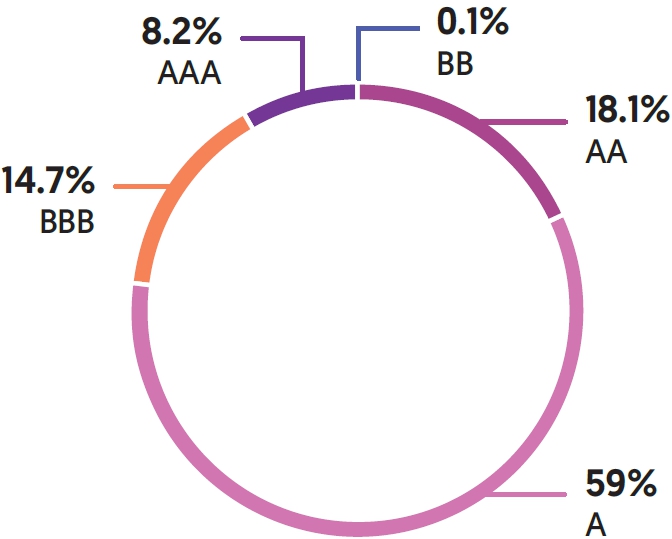
Groupe BPCE is exposed to credit spread risk at the level of its assets in a scenario of widening credit spreads, on its portfolio of securities at fair value or at amortized cost. The Group holds a significant bond portfolio eligible for the liquidity reserve, mainly composed of sovereign and corporate bonds, which makes its valuation sensitive to changes in the credit spreads of its securities.
Market fluctuations and volatility could expose Groupe BPCE, and in particular its major corporate & investment banking business lines (Natixis CIB and Natixis IM), to favorable or unfavorable fluctuations in its trading and investment activities, which could adversely affect Groupe BPCE’s results of operations and financial position.
Positions in the bond, currency, commodity, equity, unlisted or unconventional asset markets may be impacted by price fluctuations and liquidity. Adverse market configurations or periods of stress may generate losses on trading and hedging instruments (swaps, futures, options, structured products) and make it difficult to sell assets, which could affect the Group's results and financial position. Similarly, prolonged market declines and/or violent crises may reduce the liquidity of certain asset classes and make it difficult to sell certain assets, therefore generating significant losses.
At end 2025, the market risk-weighted assets totaled €18 billion, i.e. around 4% of Groupe BPCE’s total risk-weighted assets.
For additional details, see Note 10.1.2 to the consolidated financial statements of Groupe BPCE in the Universal Registration Document, which analyzes financial assets and liabilities classified in Level 3 of the fair value hierarchy.
Groupe BPCE’s revenues from brokerage and other activities associated with fee and commission income may decrease in the event of market downturns.
A market downturn may result in lower flows of transactions and financial services, which would lead to a decrease in net banking income from these activities. In addition, the decrease in the value of portfolios or the increase in withdrawals from portfolios managed on behalf of third parties could reduce the management fees and commissions paid by clients and impact revenues from fund distribution and asset management. Even without a fall in the markets, below-market performance could lead to an increase in withdrawals or lower inflows, weighing on the revenues of the activity.
For 2025, total net fees and commissions amounted to €11,258 million, or 44% of Groupe BPCE's net banking income.
For more details on fees and commissions, see Note 4.2 “Fee and commission income and expenses” in Groupe BPCE’s consolidated financial statements in the Universal Registration Document.
Changes in the fair value of Groupe BPCE’s portfolios of securities and derivative products, and its own debt, are liable to have an adverse impact on the net carrying amount of these assets and liabilities, and as a result on Groupe BPCE’s net income and equity.
At each financial reporting date, assets and liabilities measured at fair value are adjusted in the balance sheet, with movements passing either through the income statement or directly through equity. When these adjustments affect profit or loss without being offset by other corresponding changes, they have an impact on net banking income and ultimately on net income and prudential ratios. Fair value adjustments may also adversely affect the net carrying amount of assets and liabilities and thus equity. Recording over a period does not imply a guarantee that a new adjustment will not be necessary at a later date.
At December 31, 2025, financial assets at fair value through profit or loss stood at €240 billion (€227 billion held for trading), and liabilities at €234 billion (€177 billion held for trading).
For more information, see Notes 4.3, 4.4, 5.2, 5.3 and 5.4 to Groupe BPCE’s Universal Registration Document.
In the event of non-compliance with applicable laws and regulations, Groupe BPCE could be exposed to significant fines and other administrative and criminal penalties that could have a material adverse effect on its financial position, activities and reputation.
The banking and insurance framework is subject to reinforced supervision, with a growing volume of international and national regulations (MIFID II, PRIIPS, Insurance Distribution Directive, Market Abuse Regulation, GDPR, benchmarks, etc.) that are profoundly changing operational processes.
The European system for combating money laundering and the financing of terrorism is being stepped up. The Anti-Money Laundering Package, adopted in 2024 and mainly applicable from 2027, will be supplemented by subsequent texts. The European AMLA is being strengthened and will ensure from 2027 the direct supervision of a group of entities and the coordination of financial intelligence units at EU level.
Non-compliance with regulations may take the form of risks of inappropriate business practices to promote products, insufficient management of conflicts of interest, disclosure of confidential information, unsatisfied due diligence on entering into relationships, insufficient detection of money laundering or terrorism-related operations, and failure to comply with or circumventing of international sanctions (embargoes, asset freezes) and extraterritorial measures.
The Compliance function coordinates the prevention and control of these risks, but the Group remains exposed to fines and civil or criminal proceedings that could significantly affect its financial position, activities and reputation. Evolving compliance risks can lead to costs and operational disruptions if external systems, processes or services do not meet regulatory requirements. Proactive monitoring remains essential to limit the potential impact on the business and results.
The legal risks to which Groupe BPCE is exposed could have a material adverse effect on its financial position and results.
Judicial, arbitral and administrative proceedings initiated or likely to be initiated against Groupe BPCE in the course of its current activities could give rise to financial penalties (fines, damages, penalties) and impact its profitability, financial strength, operational continuity and reputation. While some proceedings may not have a material impact in the short term, others, such as class actions, may require additional provisions and affect future prospects.
For detailed information on the most significant proceedings, please refer to Section 10 “Legal risks” of this document.
Any interruption or failure of the information systems belonging to Groupe BPCE or third parties, particularly external service providers, may generate losses (including commercial losses) and may have a material adverse impact on Groupe BPCE’s results.
As is the case for its competitors, Groupe BPCE is highly dependent on information and communication systems, as a large number of increasingly complex transactions are processed in the course of its activities. Any failure, interruption or malfunction in these systems may cause errors or interruptions in the systems used to manage customer accounts, general ledgers, deposits, transactions and/or to process loans. A temporary failure in Groupe BPCE’s information systems despite back-up systems and contingency plans could generate substantial information recovery and verification costs, or even a decline in its proprietary activities if, for example, such a failure were to occur during the implementation of a hedging transaction. The inability of Groupe BPCE’s systems to adapt to an increasing volume of transactions may also limit its ability to develop its activities and generate losses, particularly losses in sales, and may therefore have a material adverse impact on Groupe BPCE’s results. Cyber risks and the impacts of digital transformation accentuate these vulnerabilities, with an increasing exposure of intangible assets and work tools, and a multiplication of connected channels and devices (cloud, big data, etc.).
Malicious acts aimed at accessing or misappropriating data and systems via digital means, including artificial intelligence, could harm Groupe BPCE, its employees, partners and clients. Numerous processes are gradually going digital. Changing uses by employees and clients also lead to an increased use of the Internet and interconnected technological tools (tablets, smartphones, internet, etc.), increasing the number of channels serving as potential vectors for attacks and disruptions, and the number of devices and applications vulnerable to attacks and disruptions. Consequently, the software and hardware used by Groupe BPCE’s employees and external agents are constantly and increasingly subject to cyberthreats. As a result of any such attacks, Groupe BPCE may face malfunctions or interruptions in its own systems or in third-party systems that may not be adequately resolved. Any interruption or failure of the information systems belonging to Groupe BPCE or third parties may generate losses (including commercial losses) due to the disruption of its operations and the possibility that its customers may turn to other financial institutions during and/or after any such interruptions or failures.
The risk associated with any interruption or failure of the information systems belonging to Groupe BPCE or third parties is significant for Groupe BPCE in terms of impact and probability, and is therefore carefully and proactively monitored.
Groupe BPCE is also exposed to operational risk related to malfunctions or operational failures by one of its clearing agents, foreign exchange markets, custodians or other financial intermediaries or external service providers that it uses to carry out or facilitate its securities transactions.
Lastly, it is necessary to note the risk of outsourcing, particularly in external IT services or more generally in connection with critical and important external services within the meaning of French regulations.
As a major player in the financial system, Groupe BPCE relies on the notion of a trusted third party for the general public, its clients. Damage to reputation, particularly related to negative media coverage or claims about products, financing, partners or governance, may damage this trust and influence the Group's business relations and attractiveness. Concerns may arise around BPCE’s environmental strategy and social policies or its governance.
External events, such as acts of cybercrime or cyberterrorism, internal or external fraud or misappropriation of funds, may also damage the Group's image and its ability to establish or maintain relationships with counterparties, clients or service providers. Major damage to reputation could limit access to certain financial markets, impact the attractiveness of talent and, ultimately, affect the Group's financial position and business outlook.
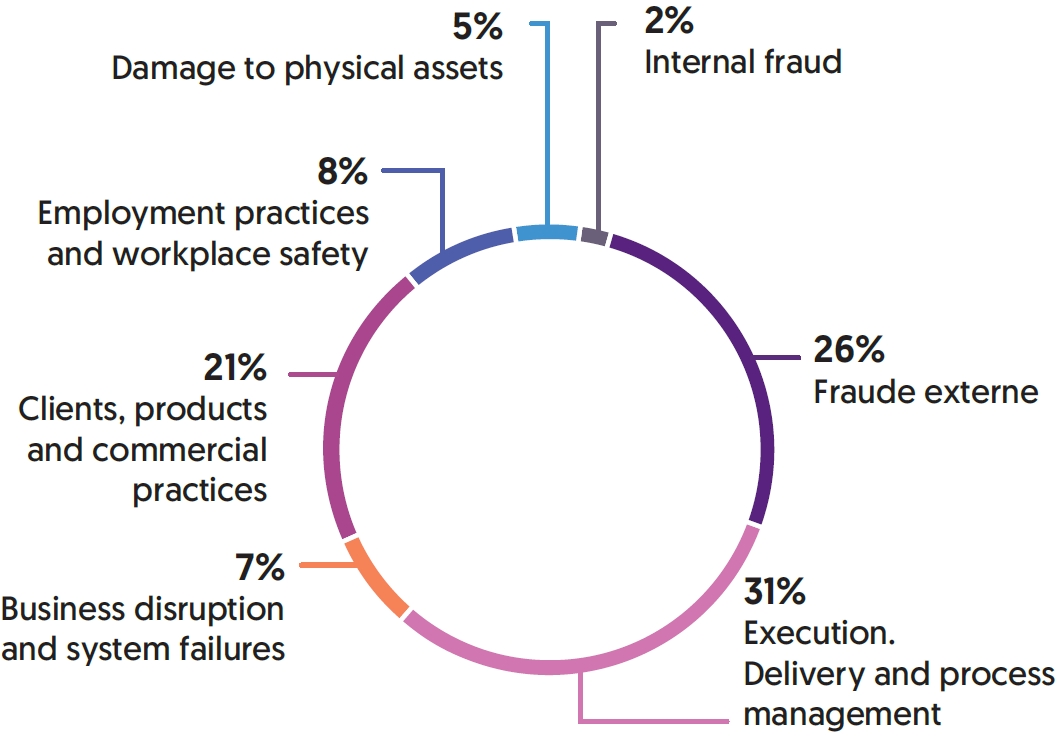
Unforeseen events, such as natural disasters, physical climatic risks, pandemics, attacks or other emergency situations, could cause an abrupt interruption in Groupe BPCE's activities and affect its critical business lines (liquidity, payment instruments, securities, loans to individual and corporate clients, fiduciary). These interruptions could generate material losses, particularly if they are not fully covered by insurance, and have a direct impact on net income. They could also disrupt the Group's infrastructure or that of third-party partners, generate additional costs (relocation of personnel, insurance premiums) and increase the overall level of risk if such events preclude insurance coverage.
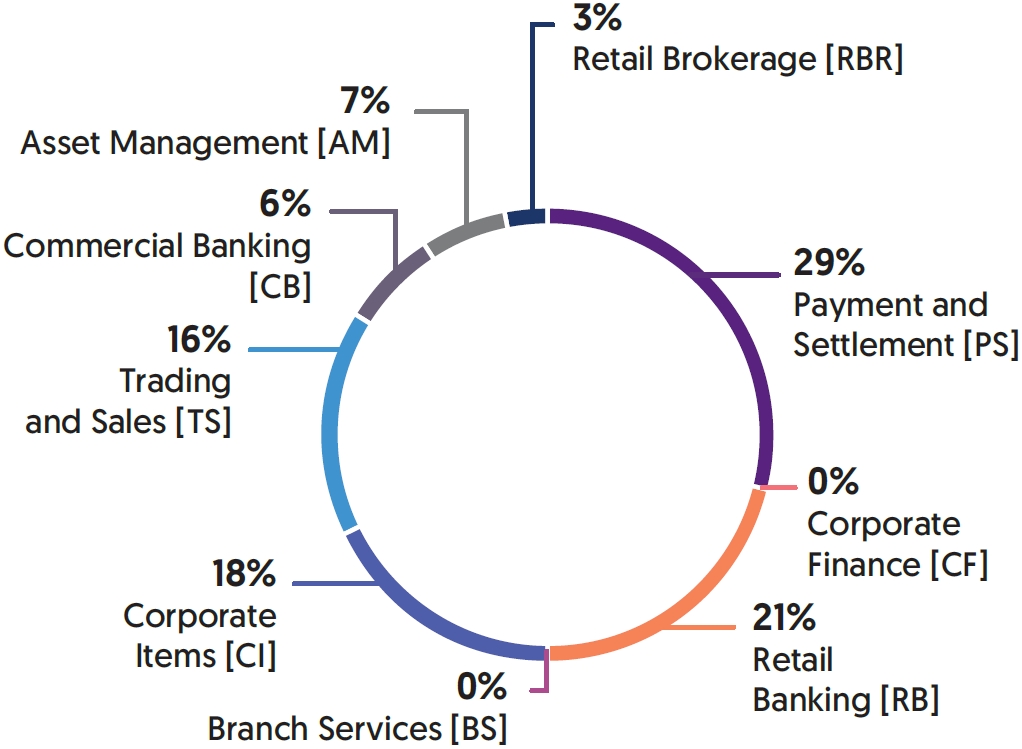
At December 31, 2025, losses related to operational risk were mainly concentrated on the "Payment and settlement" line (29%) and, within the "Execution, delivery and process management" category (31%).
The failure or inadequacy of Groupe BPCE’s risk management and hedging policies, procedures and strategies may expose it to unidentified or unexpected risks which may trigger unforeseen losses.
Groupe BPCE’s risk management and hedging policies, procedures and strategies may not succeed in effectively limiting its exposure to all types of market environments or all kinds of risks, and may even prove ineffective for some risks that the Group was unable to identify or anticipate. Furthermore, the risk management techniques and strategies employed by Groupe BPCE may not effectively limit its exposure to risk and do not guarantee that overall risk will actually be lowered. These techniques and strategies may prove ineffective against certain types of risk, in particular risks that Groupe BPCE had not already identified or anticipated, given that the tools used by Groupe BPCE to develop risk management procedures are based on assessments, analyses and assumptions that may prove inaccurate or incomplete.
Groupe BPCE’s risk measurement system is based in particular on the use of models. This models portfolio, covering market risks (Corporate & Investment Banking), credit risks and financial areas (ALM, markets), as well as operational risks (including compliance and climate), could fail. As a result, the Group could be exposed to unidentified or unanticipated risks that could result in significant losses.
Some of the indicators and qualitative tools used by Groupe BPCE to manage risk are based on the observation of past market performance. To measure risk exposures, the risk management department analyzes these observations, particularly statistically. These tools and indicators may not be able to predict future risk exposures leading to model risk. For example, these risk exposures may be due to factors that Groupe BPCE may not have anticipated or correctly assessed in its statistical models or due to unexpected or unprecedented shifts in the market. This would limit Groupe BPCE’s risk management capability. As a result, losses incurred by Groupe BPCE may be higher than those anticipated on the basis of past measurements. Moreover, the Group’s quantitative models cannot factor in all risks. While no significant problem has been identified to date in this respect, the risk management systems are subject to the risk of operational failure, which could expose Groupe BPCE to unexpected losses.
Actual results may vary compared to assumptions used to prepare Groupe BPCE’s financial statements, which may expose it to unexpected losses.
In accordance with current IFRS standards and interpretations, Groupe BPCE must use certain estimates when preparing its financial statements, in particular accounting estimates relating to the determination of impairment for credit risk and provisions for employee benefits or provisions for litigation, estimates relating to the determination of the fair value of certain financial assets and liabilities, etc. If the values used for the estimates by Groupe BPCE prove to be materially inaccurate, in particular in the event of major and/or unexpected market trends, or if the methods used to calculate these values are modified due to future changes in IFRS standards or interpretations, Groupe BPCE may be exposed to unexpected losses.
Information on the use of estimates and judgments is provided in Note 2.3 “Use of estimates and judgments” to the consolidated financial statements of Groupe BPCE in the Universal Registration Document.
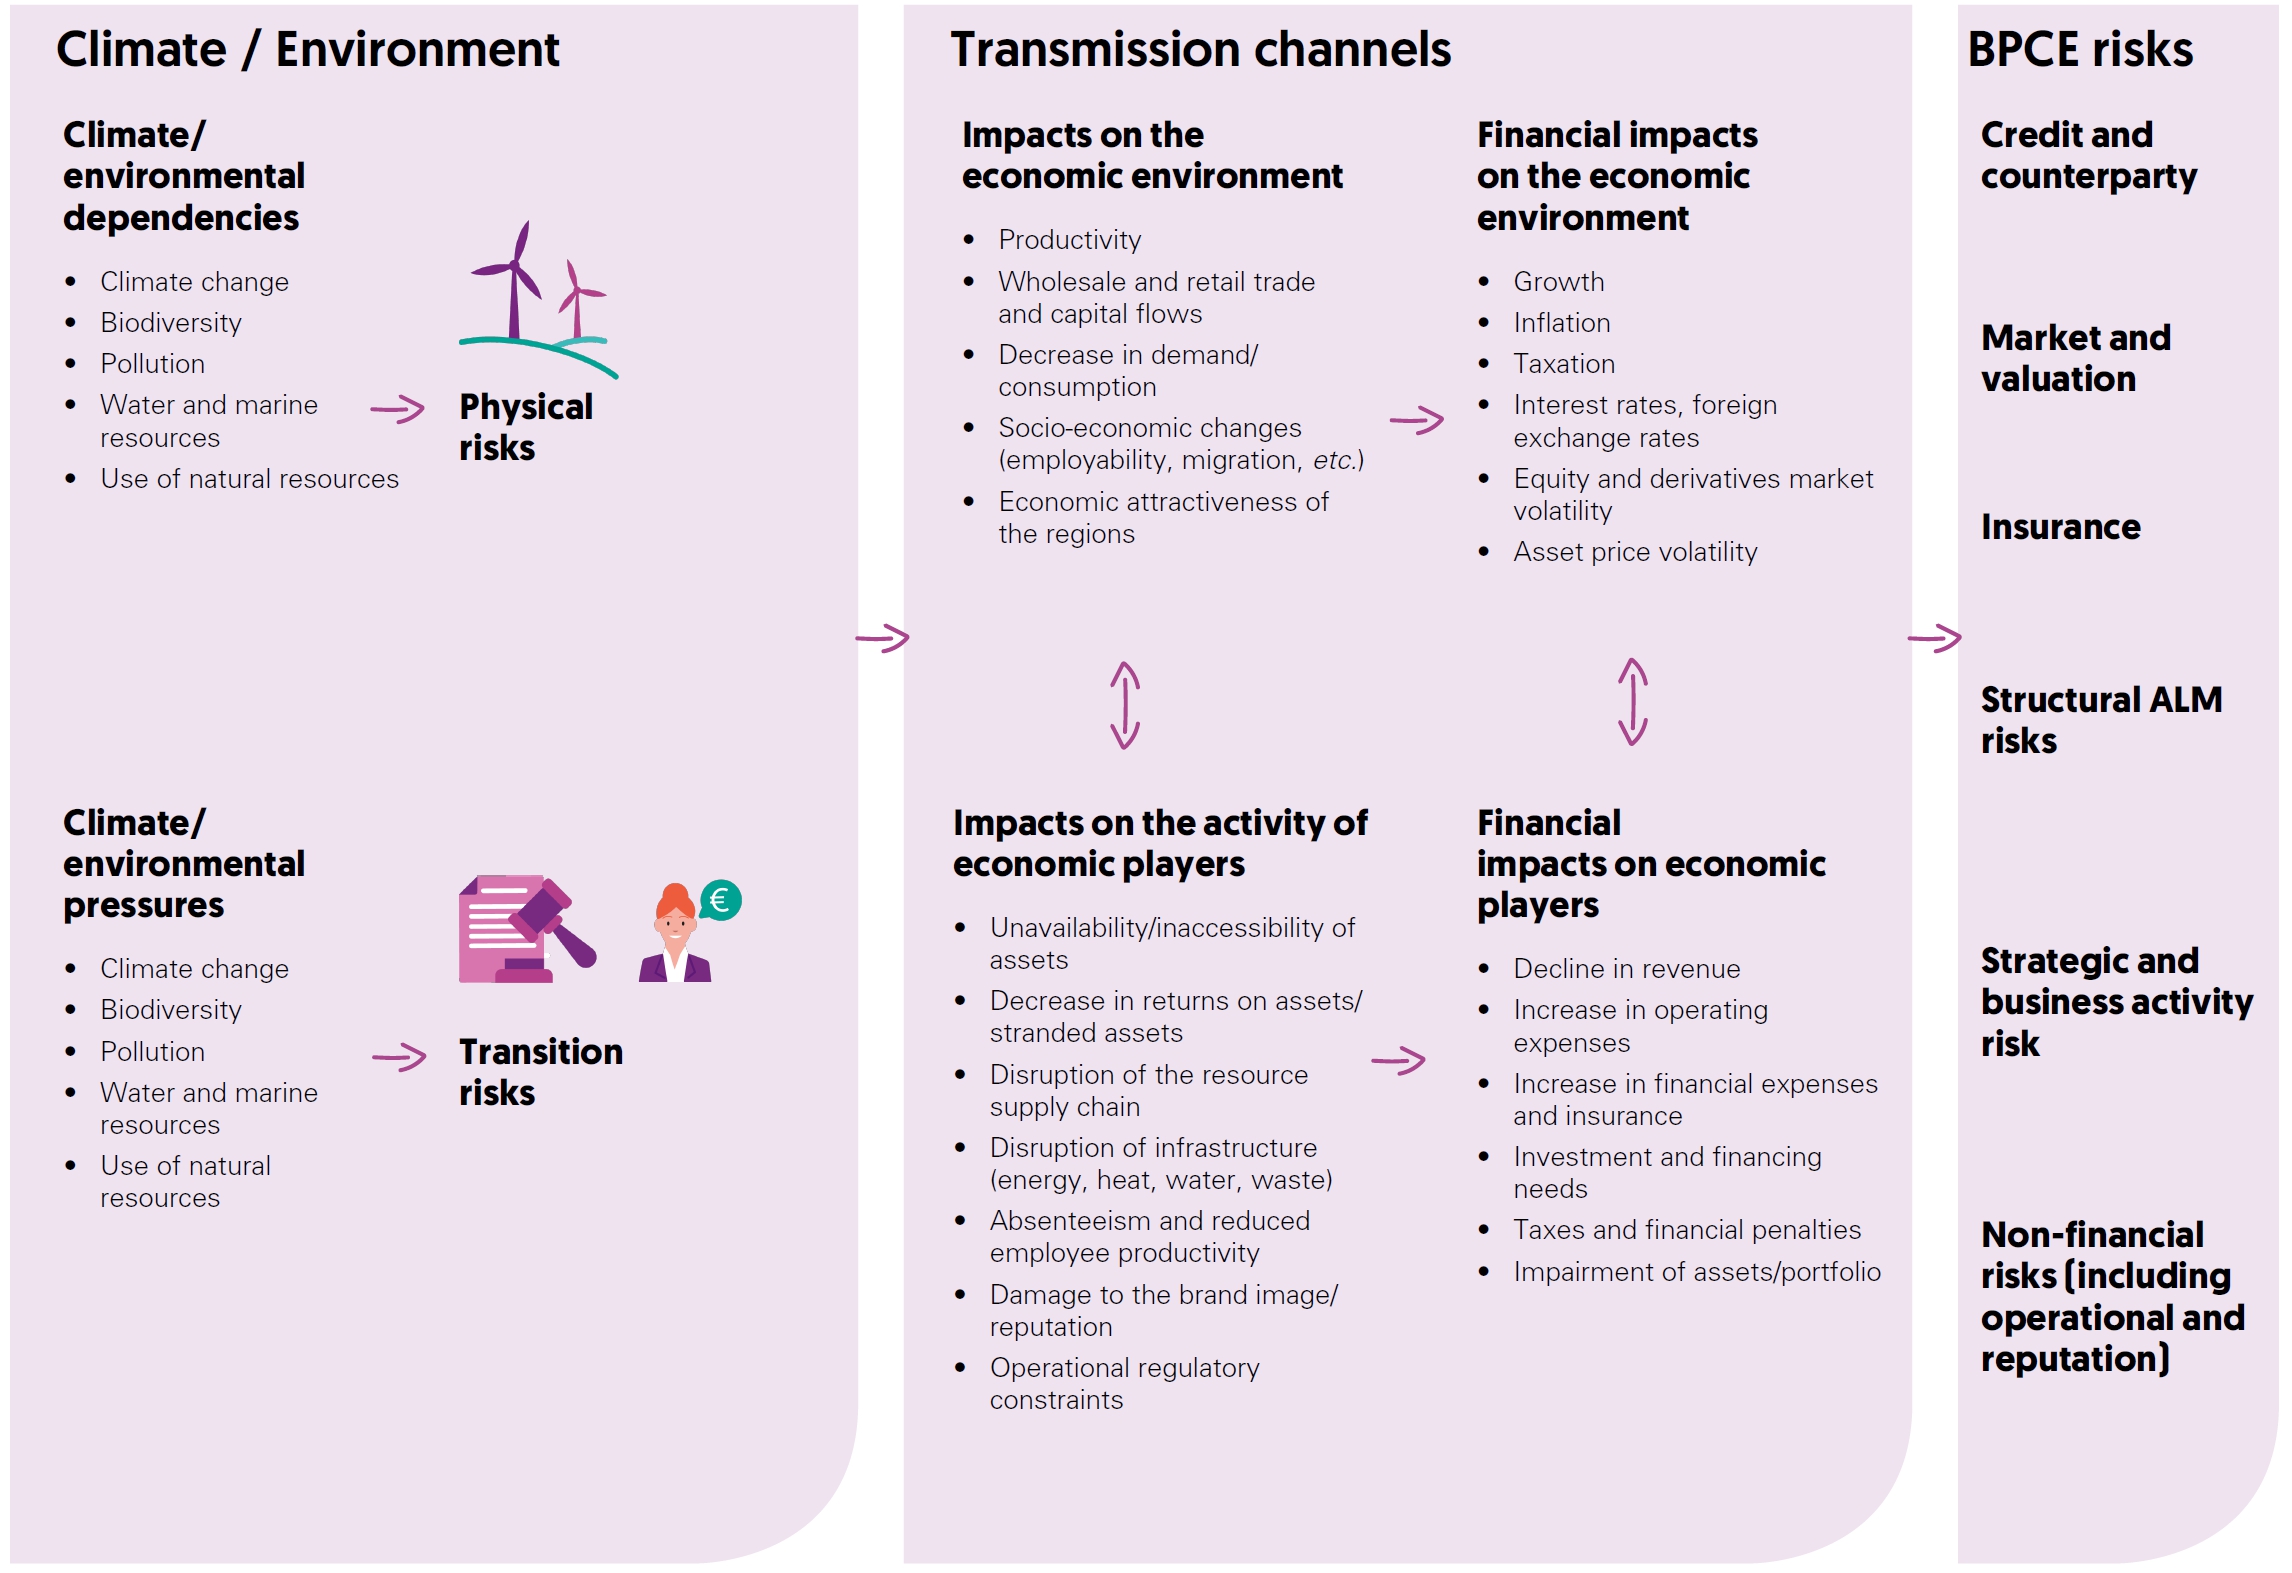
Environmental, Social and Governance risks (ESG), together with their repercussions for economic players, could adversely affect Groupe BPCE’s activities, results and financial position.
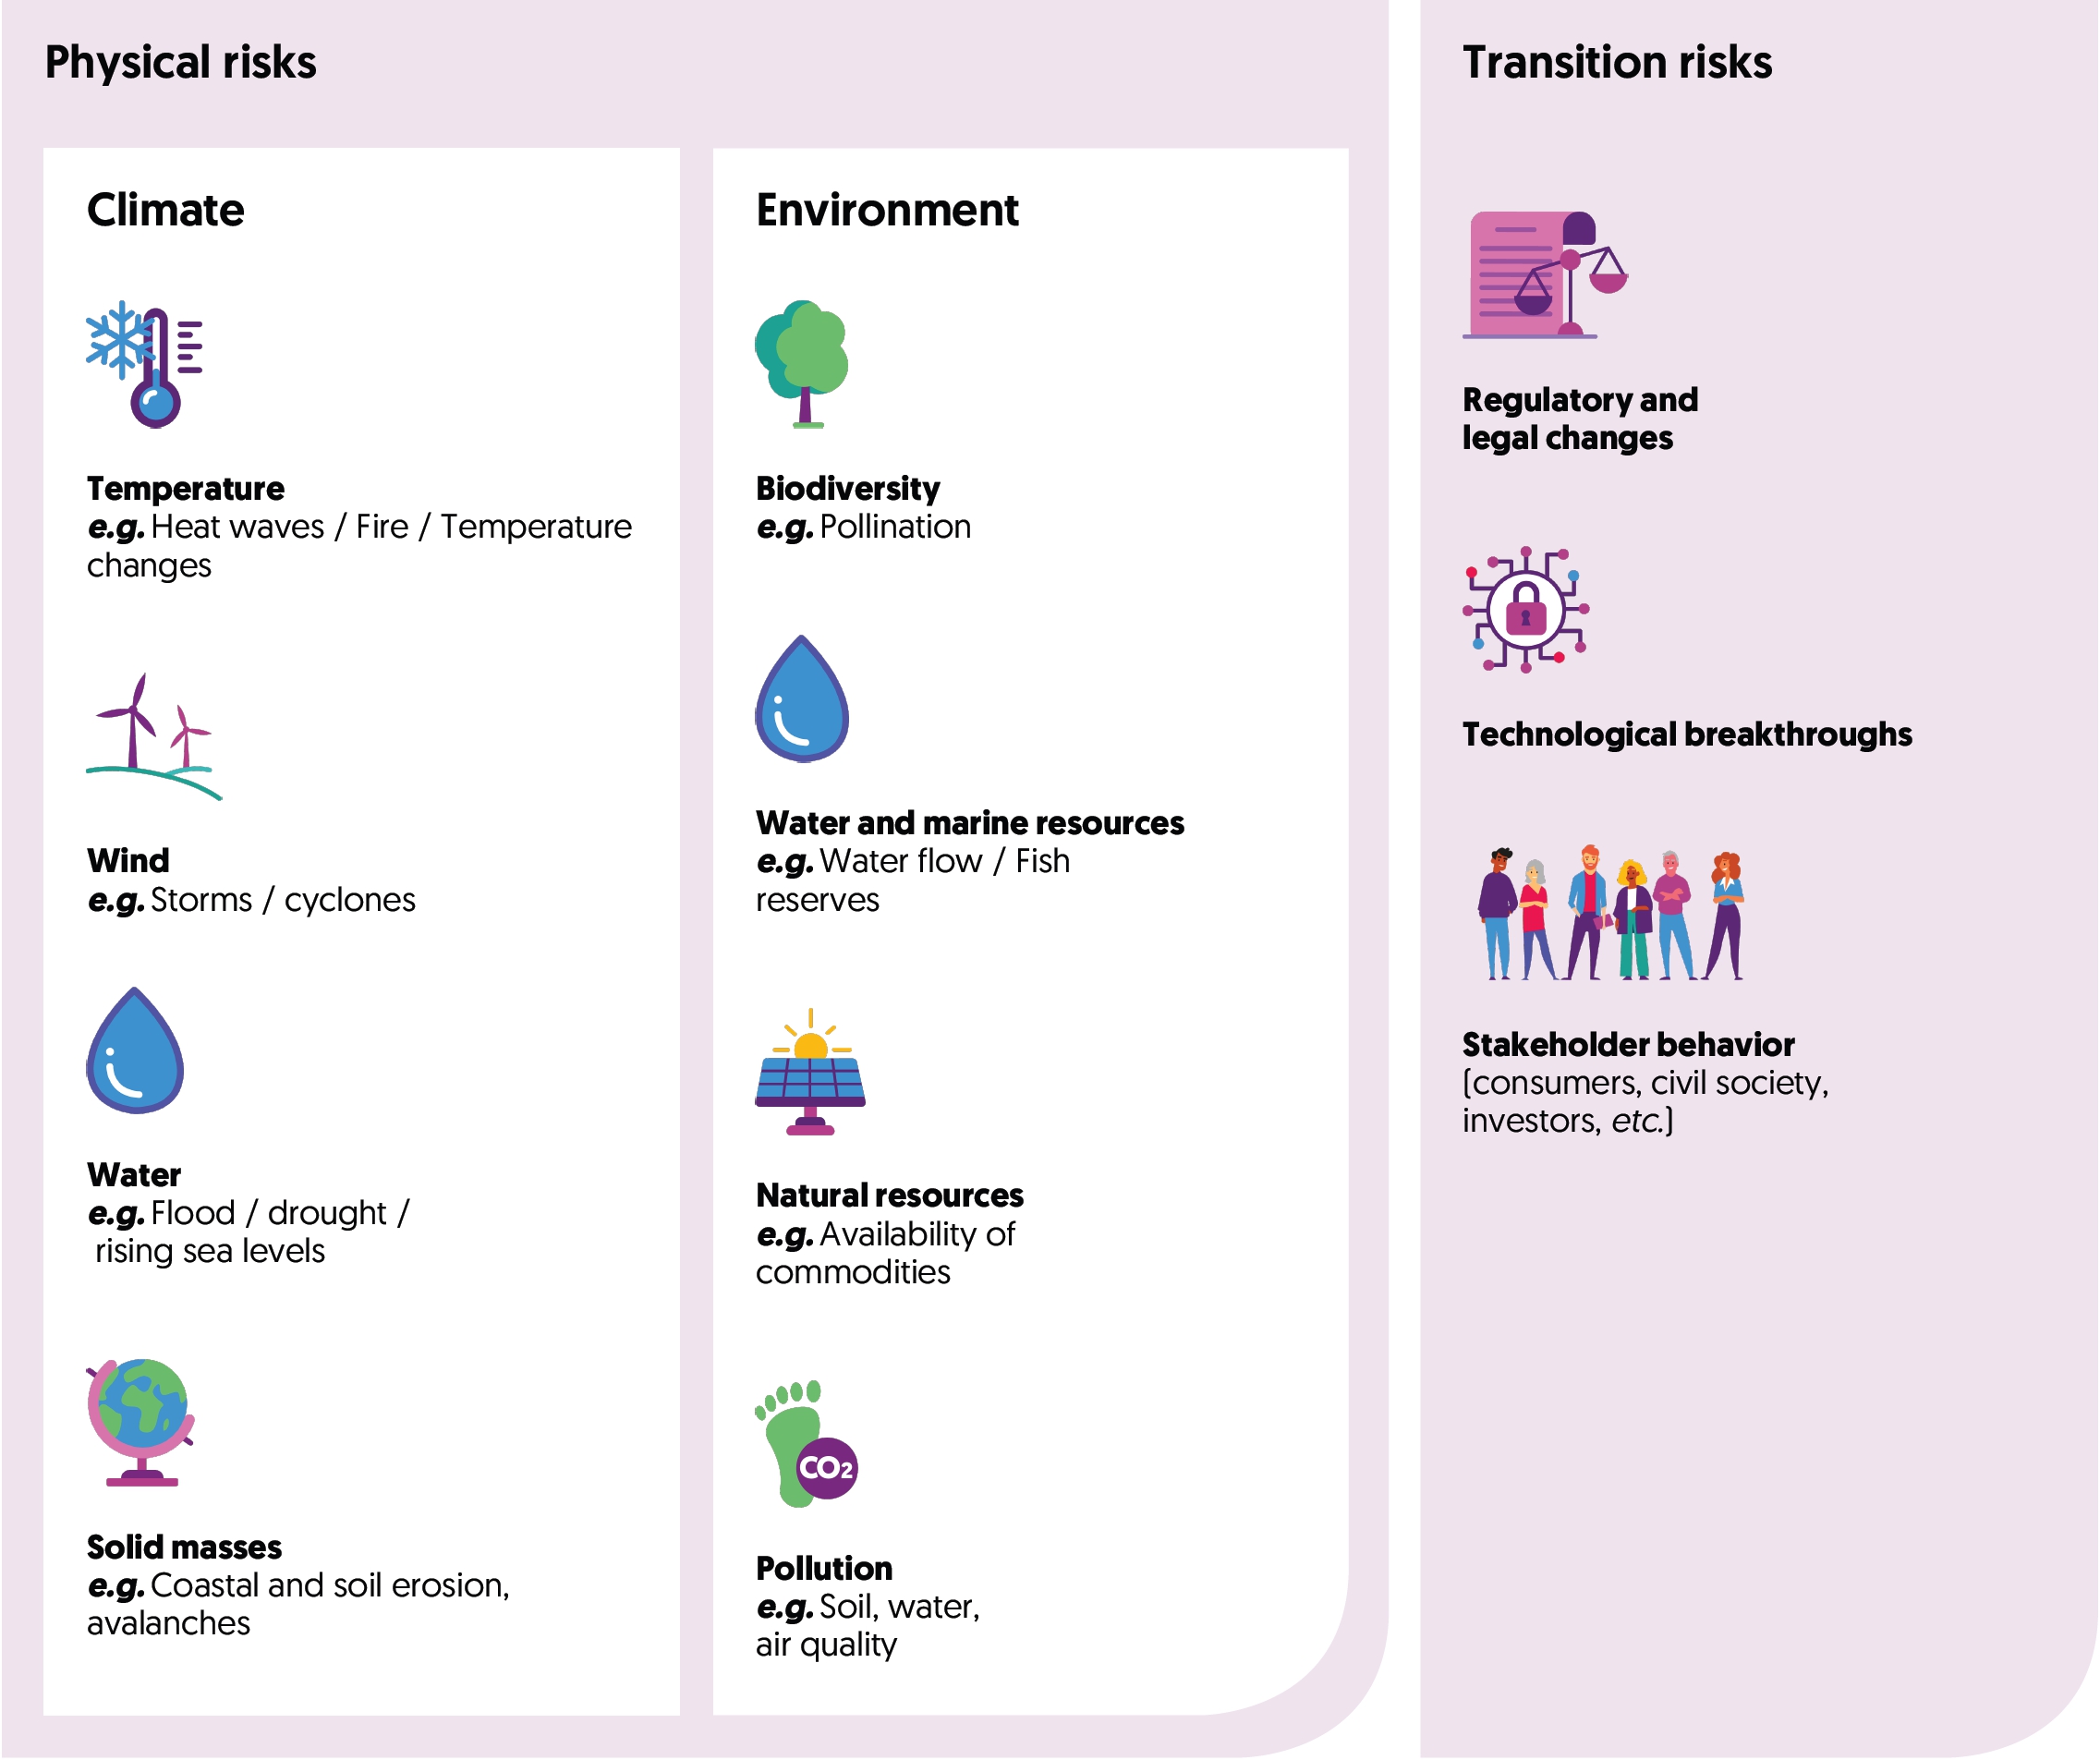
Environmental, Social and Governance (ESG) risks are a set of risk factors arising from the impacts of climate change, environmental issues (biodiversity, pollution, natural resources, water), social issues (respect for human rights, well-being and the interests of people and stakeholders) and governance issues (ethics and corporate culture, business practices, supplier relations). These risks are likely to materialize in the short, medium or long term. They are factors that aggravate other categories of risk to which Groupe BPCE is exposed (credit and counterparty risk, market risk, operational risk, structural balance sheet risk, risk related to insurance activities, strategic risk, legal risk, compliance risk and reputation risk). Groupe BPCE is mainly exposed to ESG risks indirectly through its clients and counterparties and its investments, either on its own behalf or on behalf of third parties. It is also directly exposed to these risks through its own business activities.
Environmental risks include physical risks and transition risks. Physical risks result from damage directly caused to people and property by events related to climate and environmental changes. These risks can be related to acute events, linked to extreme conditions circumscribed in time and space (such as heat waves, landslides, floods, late frosts, fires, storms, situations of water stress or air, water or soil pollution) or to chronic events of a more gradual and diffuse nature (such as changes in rainfall patterns, rise in sea levels and average temperatures, loss of biodiversity, the depletion of natural resources). Physical risks are likely to affect a wide variety of geographic areas and economic sectors and impact the business, assets and financial profile of the counterparties to which Groupe BPCE is exposed, particularly through its financing, investment or insurance activities. Groupe BPCE is also likely to be directly affected by climatic or environmental events that affect its operating sites, employees or suppliers. Transition risks result from adjustments made by economic players and stakeholders during the transition to a low-carbon economy that is more respectful of environmental balances. These adjustments are reflected in regulatory, technological or socio-demographic changes that may affect the business models, operating models and financial profiles of economic players as well as the value of the assets to which Groupe BPCE is exposed, particularly through its financing and investment activities. Groupe BPCE is also directly exposed to transition risks through regulatory changes and changes in stakeholder expectations, particularly with regard to its product and service offering as well as its voluntary commitments.
Social risks arise from issues related to the rights, well-being and interests of people and stakeholders (company and value chain employees, communities concerned, consumers and end-users). Through their potential impact on activities (work organization, supply chains, products, etc.) and the associated reputation issues, these risks are likely to affect the financial profile of the counterparties to which Groupe BPCE is exposed, particularly through its financing and investment activities. They may also lead to increased reputation risk for Groupe BPCE, either directly or through its counterparties.
Governance risks include issues related to ethics and corporate culture (governance structure, business integrity and transparency, etc.), supplier relationship management, influence activities and business conduct practices. Through their potential impact on activities (corporate governance standards, control systems, commercial practices, etc.) and the associated reputation issues, these risks are likely to affect the financial profile of the counterparties to which Groupe BPCE is exposed, in particular through its financing and investment activities. They may also lead to increased reputation risk for Groupe BPCE, either directly or through its counterparties.
Overall, Environmental, Social and Governance risks could adversely affect Groupe BPCE’s business, results and financial position.
Groupe BPCE may be vulnerable to political, macro-economic and financial environments or to specific circumstances in its countries of operation.
Groupe BPCE may be exposed to risks related to the political, macro-economic and financial environments of the countries in which it operates. Some entities are exposed to country risk, which is defined as the risk that economic, financial, political or social conditions in a country affect their financial interests.
In 2025, BPCE concentrated its activities mainly in France (76% of net banking income) and North America (13%), with other regions each accounting for less than 2% of NBI. The breakdown by country and by activity is detailed in Note 12.6 to the consolidated financial statements of Groupe BPCE in the 2025 Universal Registration Document.
A significant change in the political or macro-economic environment in these areas could generate additional expenses or reduce the Group's profits. The economic outlook remains uncertain and marked by geopolitical, economic and trade risks, likely to affect global growth, asset prices and financial stability, with increased market volatility.
The year 2026 began with significant geopolitical tensions and macroeconomic developments, highlighting the complexity of the international context and the potential challenges for the Group's business and results.
Since February 28, 2026, the US-Israeli military operation in Iran has already had significant impacts on the prices of a barrel of Brent crude and gas. The macroeconomic risk is real: a $10 increase in the price of oil causes an increase in inflation of 0.3 points and a decline in GDP of 0.1 points in France in the first year. The form and outcome that the conflict could take leaves a wide universe of possibilities. The latter notably depends on the ability of the oil and gas infrastructures of the countries bordering the Persian Gulf to produce and export oil and gas via the Strait of Hormuz.
Moreover, a major uncertainty remains regarding changes in the international political and economic environment, in particular the trade policy of the United States and global public and private debt, which could weigh on Groupe BPCE's business and financial conditions. The downturn or fragmentation of global trade, geopolitical tensions and the budgetary outlook in Europe (particularly in France and the Eurozone) may influence demand, financing costs and the interest rate risk premium, while supporting or dampening investment and growth. In addition, changes in public deficits, the potential increase in long-term rates and the continued quantitative tightening of central banks could weigh on bond markets and Groupe BPCE's competitiveness. In France, political uncertainty surrounding the presidential election and multi-year budgetary constraints could limit spending and dampen economic momentum, with possible effects on savings, consumption and employment.
For more detailed information, see sections 5.2 "Economic and financial environment" and 5.8 "2026 economic outlook" in the 2025 Universal Registration Document.
Groupe BPCE's strategic project, VISION 2030 is based on three pillars: (i) forging our growth for the long term, (ii) giving our clients confidence in their future, and (iii) expressing our cooperative nature in all territories. The first pillar aims to make Groupe BPCE a leading banking group promoting diversified growth, open to partnerships, and capable of achieving high levels of performance. The second pillar aims to make the Group into a facilitator for access to housing for all, and for all types of needs, to be the go-to player for territorial competitiveness, to protect customers at every moment and stage in their lives, and to simplify client relationship models (from 100% physical to 100% digital), notably with the help of AI. The third pillar aims to give full expression to the cooperative values promoted by the Group, which draws its strength from its multifaceted activities and the range of its expertise, from its positive global impact, and from its cooperative shareholders and employees, proud and committed in their day-to-day lives. The new growth model is being implemented in three major geographical circles – France, Europe and the rest of the World – and is based on organic growth, acquisitions, and partnerships.
The success of the 2026 financial trajectory is based on a large number of initiatives currently being implemented within Groupe BPCE's various business lines. Although most of the goals defined in the strategic project are expected to be achieved, others may not be, due to changes in the economic or competitive environment or possible changes in accounting and/or tax regulations. If Groupe BPCE does not achieve these goals, the 2026 financial trajectory could be affected.
Groupe BPCE may encounter difficulties in adapting, implementing and incorporating its policy governing acquisitions or joint ventures
Groupe BPCE may consider acquisition or joint venture opportunities, but it is not always possible to fully assess these targets. Unanticipated liabilities may emerge and the results of the acquired company or joint venture may prove disappointing, or the anticipated synergies may not be fully achieved, with higher-than-expected costs. The integration of a new entity may also prove difficult, and the failure of an external growth operation or its integration may weigh on the Group's profitability and lead to the departure of key employees. To retain talent, the Group may have to offer financial benefits, which may increase certain costs and impact profitability. In the context of joint ventures, the Group is exposed to additional risks related to systems, controls and persons not directly under its control, which may give rise to liability, generate losses or affect its reputation. Conflicts or disagreements with the partners could jeopardize the expected benefits of the joint venture.
Intense competition in France, Groupe BPCE’s main market, or internationally, may cause its net income and profitability to decline
Groupe BPCE’s main business lines operate in a very competitive environment both in France and other parts of the world where it does substantial business.
This competition is heightened by consolidation, either through mergers and acquisitions or cooperation and arrangements. This consolidation has created a certain number of companies which, like Groupe BPCE, can offer a wide range of products and services ranging from insurance, loans and management of deposits to brokerage, investment banking and asset management. Groupe BPCE is in competition with other entities based on a certain number of factors, including the correct execution of products and services offered, innovation, reputation and price. If Groupe BPCE is unable to maintain its competitiveness in France or in its other major markets by offering a range of attractive and profitable products and services, it may lose market share in certain key business lines or incur losses in some or all of its activities.
A slowdown in the global economy or in key markets may intensify competitive pressure through lower prices and lower volumes. The entry of new, more competitive entrants subject to different or more flexible regulatory frameworks, or other prudential ratio requirements, could increase the pressure. In addition, technological advances and the development of e-commerce have facilitated access to financial solutions by non-traditional players, offering online banking and financial services, including securities services. These new entrants could put downward pressure on prices or gain market share if Groupe BPCE does not quickly adapt its strategy and offering.
Groupe BPCE’s ability to attract and retain skilled employees is paramount to the success of its business and failing to do so may affect its performance
Groupe BPCE is highly dependent on its employees, considered to be its main resource. Competition to attract and retain skilled talent is fierce in the financial services industry, and the Group's performance depends on its ability to recruit and retain employees. Technological and economic transformations and the growing demands of clients demand sustained efforts to support and train staff. Failing this, the Group may miss out on certain business opportunities and see its performance deteriorate.
For more information, please refer to Chapter 2.1, Section 3.1 of the Universal Registration Document.
A deterioration in market conditions, in particular excessive fluctuations in interest rates (both upwards and downwards) and/or a deterioration in spreads or equity markets, or an increase in reinsurance costs could have a significant adverse impact on the financial position and solvency of Life and Non-Life insurance companies
The main risk to which Groupe BPCE’s insurance subsidiaries are exposed is financial risk. This exposure results mainly from capital guarantees on euro funds and unrealized capital gains or losses on investments held. Interest rate risk is both structural and major, due to the predominance of bonds over liabilities. A rise in interest rates may weaken the competitiveness of euro-denominated offerings and generate flows of redemptions and arbitrages in unfavorable economic conditions, while a decrease could render the return on general funds insufficient to cover capital guarantees.
In addition, the widening of spreads and the weakness of the equity markets may weigh on the results of insurance activities via the valuation at fair value and provisions for impairment. The increase in claims and extreme events (particularly weather events) could also lead to an increase in reinsurance requirements, reducing the overall profitability of insurance activities.
At December 31, 2025, net banking income from Groupe BPCE's insurance activities increased by 12% to €959 million, compared to €858 million in 2024.
A mismatch between the level and cost of claims anticipated by insurers, on the one hand, and premiums and provisions on the other, could have a significant adverse impact on the results and financial position of the non-life, personal protection and surety portion of its insurance activities
Underwriting risk arises from the possible discrepancy between the claims actually incurred and the compensation paid, and the assumptions used to set the rates and determine the technical provisions. Insurers use their experience and industry data to estimate claims and actuarial parameters in order to price products and constitute provisions. However, deviations from these estimates, or unforeseen events such as pandemics or natural disasters, may result in higher-than-expected payments. Changes in climate risks are closely monitored.
If compensation amounts exceed initial assumptions or if underlying assumptions change, companies' liabilities could be higher than expected, adversely impacting the results and financial position of subsidiaries. Conversely, the actions taken in recent years — financial hedging, reinsurance, business diversification and investment management — have strengthened the resilience of the solvency of Groupe BPCE's insurance subsidiaries.
Groupe BPCE is subject to many regulations in France and in several other countries around the world where it operates; regulatory measures and changes could have a material adverse impact on Groupe BPCE’s business and results
The uncertainty surrounding future regulatory changes makes it difficult to anticipate their impacts, which could be unfavorable. Faced with new requirements, the Group may have to reduce the range of activities it offers to comply and increase its costs of compliance, which could result in lower revenues and consolidated profits, or even selling or reducing asset portfolios.
The CRR III/CRD VI package, published on June 19, 2024, strengthens prudential frameworks in the EU and is largely applicable from January 1, 2025, except for the rules related to market risks, which will come into force on January 1, 2027. This reform could increase capital and liquidity requirements and impact the Group's financing costs.
In November 2025, the Financial Stability Board, in consultation with the Basel Committee on Banking Supervision and national authorities, published the 2025 list of global systemically important banks (G-SIB). Groupe BPCE is classified as a G-SIB and is also on the list of global systemically important institutions (G-SIIs) for the 2025 fiscal year. This classification reinforces the perception of the systemic importance of the Group and may influence prudential obligations, costs and supervision requirements.
BPCE may have to help entities belonging to the financial solidarity mechanism in the event they experience financial difficulties, including entities in which BPCE holds no economic interest.
As the central institution of Groupe BPCE, BPCE is responsible for ensuring the liquidity and solvency of each regional bank (Banques Populaires and Caisses d’Epargne) and the other members of the group of affiliates. The group of affiliates includes BPCE subsidiaries, such as Natixis, Crédit Foncier de France, Oney and Banque Palatine. In the case of Groupe BPCE, all the financial institutions affiliated with the central institution of Groupe BPCE benefit from a guarantee and solidarity system whose purpose, in accordance with Articles L. 511-31, L. 512-107-5 and L. 512-107-6 of the French Monetary and Financial Code, is to guarantee the liquidity and solvency of all affiliated financial institutions and to organize financial solidarity within the Group.
This financial solidarity is based on legislative provisions establishing a legal principle of solidarity, imposing a performance obligation on the central institution to restore the liquidity or solvency of affiliates in difficulty and/or all affiliates of the Group. By virtue of the unlimited nature of the principle of solidarity, BPCE is entitled at any time to ask any one or several or all of the affiliates to contribute to the financial efforts that may be necessary to restore the situation, and may, if necessary, mobilize all the cash and equity capital of the affiliates in the event of difficulty for one or more of them.
At December 31, 2025, the Banque Populaire and Caisse d’Epargne funds each contained €450 million. The mutual guarantee fund holds €211 million in deposits per network.
The three guarantee funds created to cover Groupe BPCE’s liquidity and insolvency risks are described in Note 1.2 “Guarantee mechanism” to the consolidated financial statements of Groupe BPCE included in the Universal Registration Document. The regional banks are obligated to make additional contributions to the guarantee fund on their future profits.
While the guarantee fund represents a substantial source of resources to fund the solidarity mechanism, there is no guarantee these revenues will be sufficient. If the guarantee funds prove insufficient, BPCE, due to its missions as a central institution, will have to do everything necessary to restore the situation and will have the obligation to make up the deficit by implementing the internal solidarity mechanism that it has put in place, by mobilizing its own resources, and may also make unlimited use of the resources of several or all of its affiliates.
As a result of this obligation, if a member of the Group were to encounter major financial difficulties, the event underlying these financial difficulties could have a negative impact on the financial position of BPCE and that of the other affiliates thus called upon to provide support under the legal principle of financial solidarity.
Investors in BPCE’s securities could suffer losses if BPCE and all of its affiliates were to be subject to liquidation or resolution procedures.
The EU regulation on the Single Resolution Mechanism No. 806/ 214 and the EU Directive for the recovery and resolution of banks No. 2014/59, as amended by EU Directive No. 2019/879 (the “BRRD”), as transposed into French law in Book VI of the French Monetary and Financial Code, give the resolution authorities the power to impair BPCE securities or, in the case of debt securities, to convert them to capital.
Resolution authorities may write down or convert capital instruments, such as BPCE’s Tier-2 subordinated debt securities, if the issuing institution or the group to which it belongs is failing or likely to fail (and there is no reasonable prospect that another measure would avoid such failure within a reasonable time period), becomes non-viable, or requires extraordinary public support (subject to certain exceptions). They must write down or convert additional capital instruments before opening a resolution proceeding, or if doing so is necessary to maintain the viability of an institution. Any write-down of capital instruments must be effected in order of seniority, so that Common Equity Tier-1 instruments are to be written down first, then additional Tier-1 instruments are to be written down, followed by Tier-2 instruments. Additional capital instruments must be converted in order of priority, such that additional Tier-1 instruments are converted first, followed by Tier-2 instruments. If the write-down or conversion of capital instruments is not sufficient to restore the financial health of the institution, the bail-in power held by the resolution authorities may be applied to write down or convert eligible liabilities, such as BPCE’s senior non-preferred and senior preferred securities.
At December 31, 2025, total Tier-1 capital amounted to €76.3 billion and Tier-2 prudential capital to €12.4 billion. Senior non-preferred debt instruments of more than one year and which are therefore eligible for TLAC and MREL amounted to €34 billion at the same date.
As a result of the complete legal solidarity, and in the extreme case of a liquidation or resolution proceeding, one or more affiliates may not find itself subject to court-ordered liquidation, or be affected by resolution measures within the meaning of the “BRRD”, without all affiliates and BPCE also being affected. In accordance with Articles L. 613-29 and L. 613-55-5 of the French Monetary and Financial Code, the judicial liquidation proceedings and resolution measures are therefore brought in a coordinated manner with regard to the central institution and all of its affiliates.
Article L. 613-29 also provides that, in the event of court-ordered liquidation proceedings being brought against all affiliates, the external creditors (of the same rank or enjoying identical rights) of all affiliates would be treated equally according to the ranking of the creditors and regardless of whether they are attached to a particular affiliated entity. As a result, investors in AT1 instruments and other securities of the same rank would be more affected than holders of Tier-2 and other securities of the same rank, which in turn would be more affected than investors in external senior non-preferred debt, which in turn would be more affected than investors in external senior preferred debt. Similarly, in the event of resolution, and in accordance with Article L. 613-55-5 of the French Monetary and Financial Code, identical depreciation and/or conversion rates would be applied to debts and receivables of the same rank, regardless of their attachment to a particular affiliated entity in the order of the hierarchy recalled above.
Due to the systemic nature of Groupe BPCE and the assessment currently made by the resolution authorities, resolution measures would be more likely to be taken than the opening of judicial liquidation proceedings. A resolution procedure may be initiated against BPCE and all affiliated entities if (i) the default of BPCE and all affiliated entities is proven or foreseeable, (ii) there is no reasonable expectation that another measure could prevent this failure within a reasonable timeframe, and (iii) a resolution measure is required to achieve the objectives of the resolution: (a) guarantee the continuity of critical functions, (b) avoid material adverse impacts to financial stability, (c) protect State resources by minimizing the use of exceptional public financial support and (d) protect client funds and assets, particularly those of depositors. Failure of an institution means that it does not respect requirements for continuing authorization, it is unable to pay its debts or other liabilities when they fall due, it requires extraordinary public financial support (subject to limited exceptions), or the value of its liabilities exceeds the value of its assets.
In addition to the bail-in power, resolution authorities are provided with broad powers to implement other resolution measures with respect to failing financial institutions or, under certain circumstances, their groups, which may include (without limitation): the total or partial sale of the institution’s business to a third party or a bridge institution, the separation of assets, the replacement or substitution of the institution as obligor in respect of debt instruments, modifications to the terms of debt instruments (including altering the maturity and/or the amount of interest payable and/or imposing a temporary suspension on payments), discontinuing the listing and admission to trading of financial instruments, the dismissal of managers or the appointment of a temporary administrator (administrateur spécial) and the issuance of new equity or own funds.
The exercise of the powers described above by resolution authorities could result in the partial or total write-down or conversion to equity of the capital instruments and the debt instruments issued by BPCE, or may substantially affect the amount of resources available to BPCE to make payments on such instruments, potentially causing BPCE investors to incur losses.
Tax legislation and its application in France and in countries where Groupe BPCE operates are likely to have an adverse impact on Groupe BPCE’s results.
Tax legislation and its application in countries where Groupe BPCE operates, notably Natixis, could adversely affect the Group's results. As a multinational banking Group, BPCE is subject to numerous tax rules and structures its activity to derive value and synergies while ensuring the compliance of the products sold and their tax treatment. Certain tax positions and interpretations adopted by the Group's entities are based on the opinions of tax advisors and, where applicable, on the interpretations of the competent authorities. It is not impossible that tax authorities may challenge these interpretations, which could lead to adjustments and an adverse impact on results.
• The French Finance Law for 2026 was adopted on February 2, 2026. The main measure for companies concerns the extension of the exceptional contribution on the profits of very large companies. The exceptional contribution introduced by the French Finance Act for 2025 concerns companies with a revenues of €1 billion or more, and has been extended for an additional year. The rate of this exceptional contribution is maintained, namely:
• 20.6% when the revenues of this fiscal year or the previous fiscal year is greater than or equal to €1 billion (increased to €1.5 billion for the second fiscal year, i.e. 2026) and less than €3 billion;
-
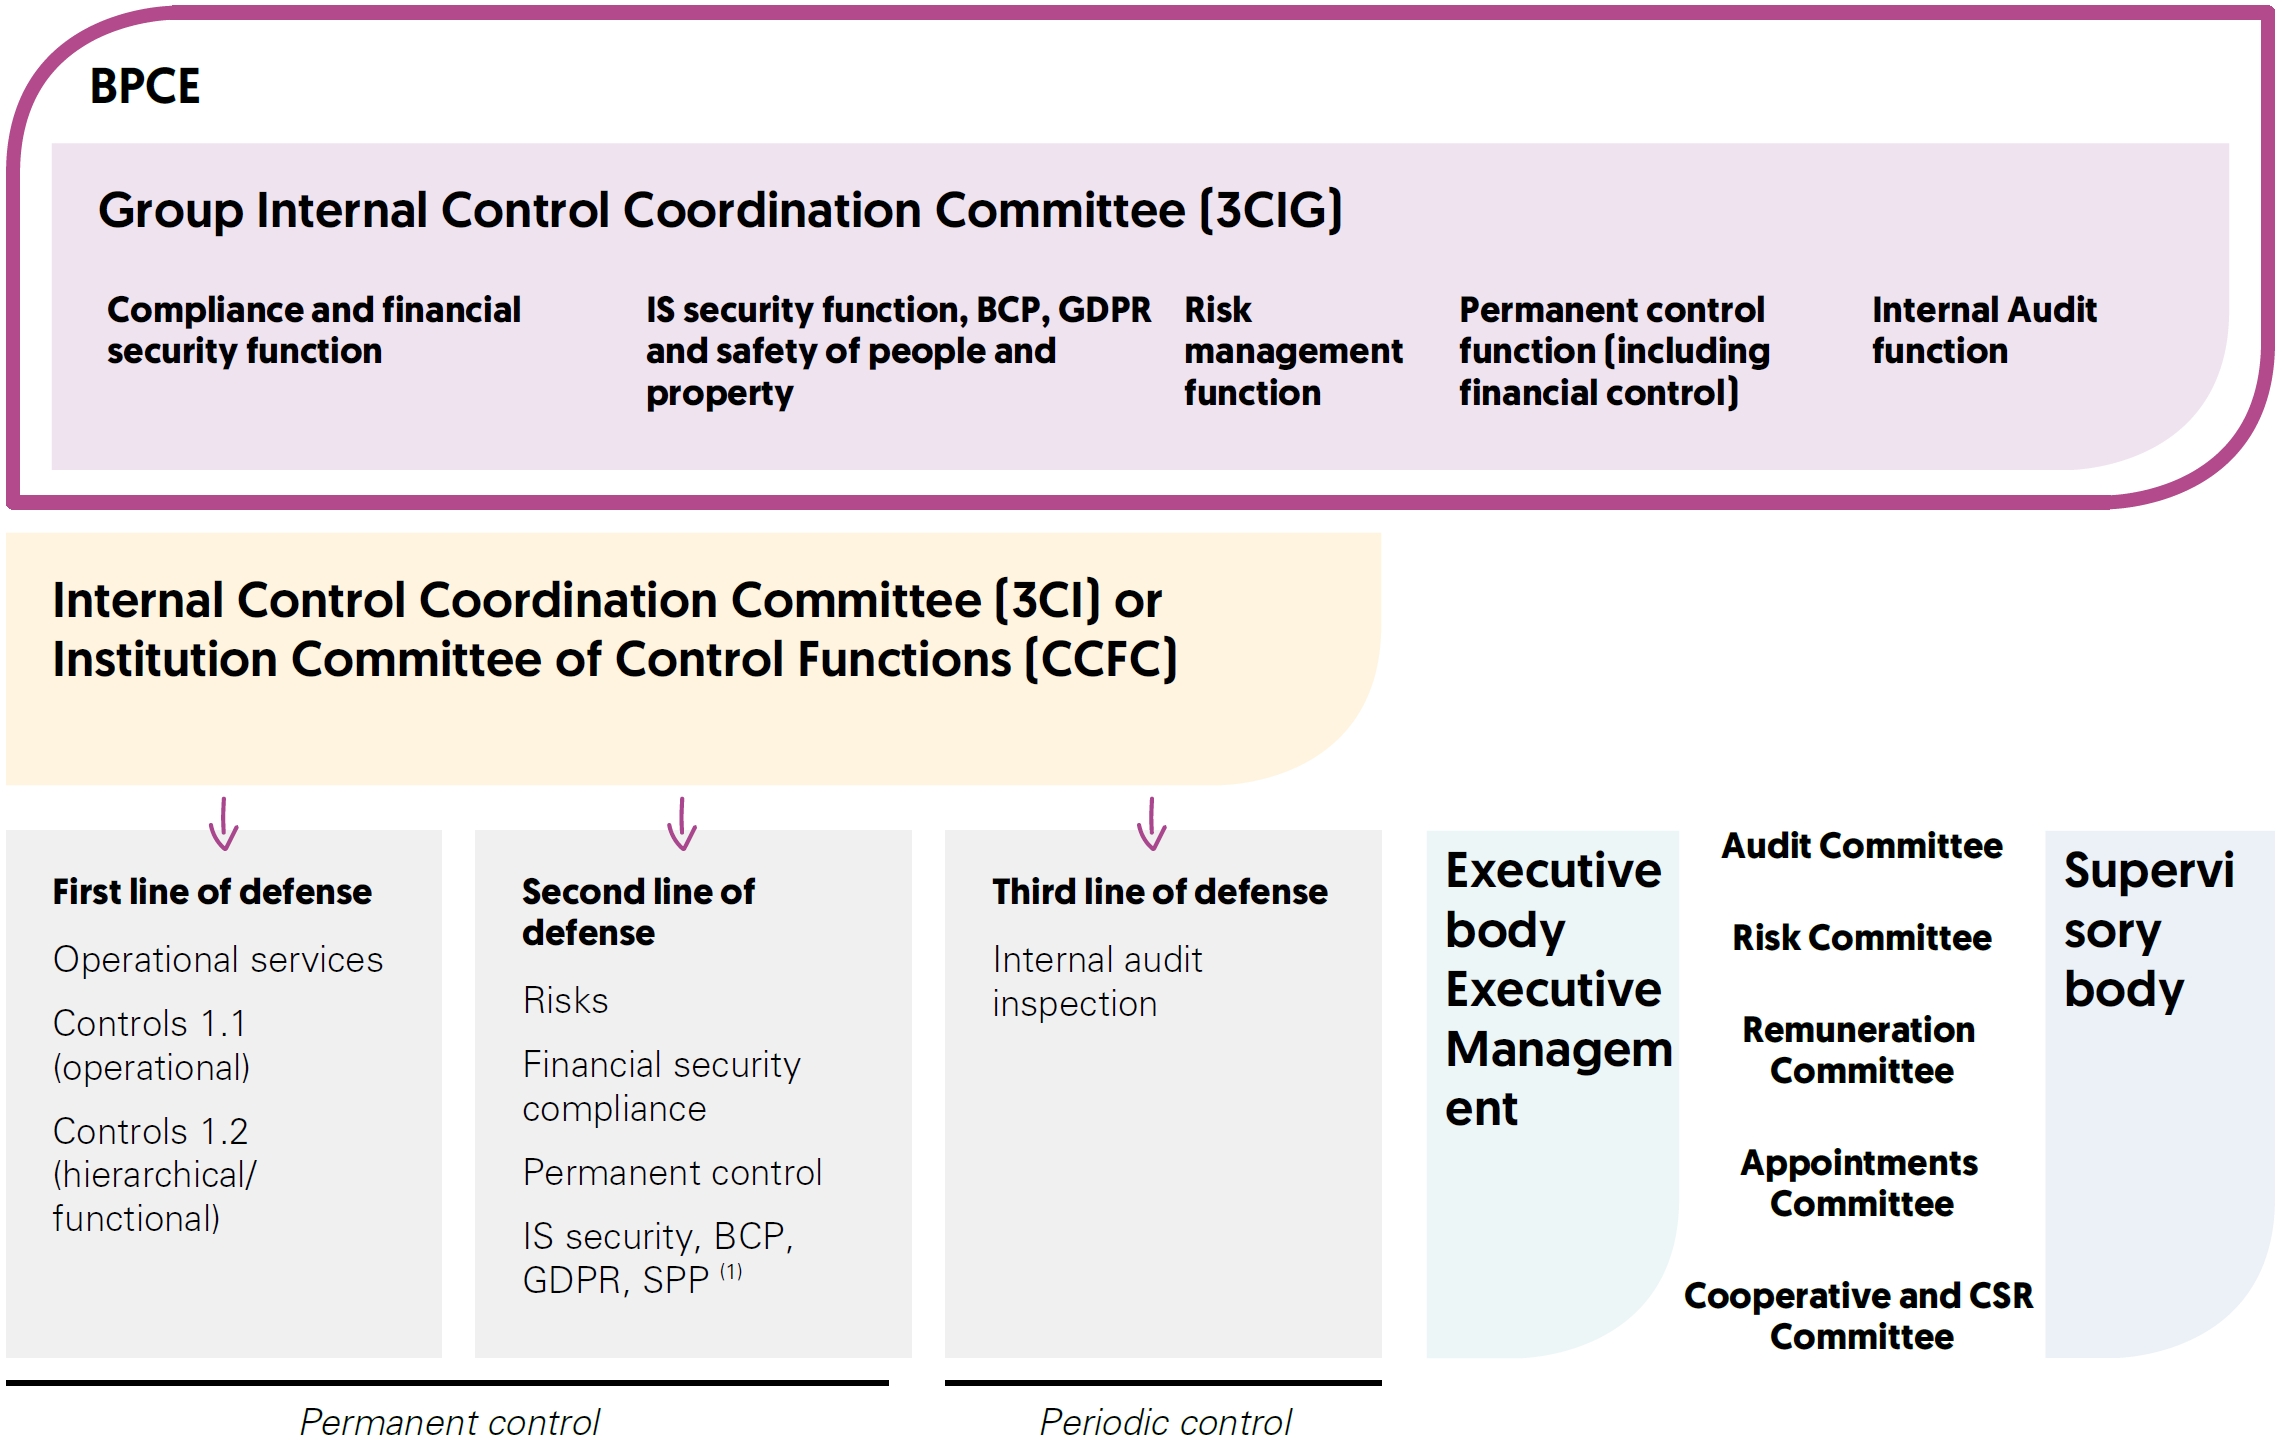
3.1 Adequacy of risk management frameworks
The Group Risk and Compliance Committee, chaired by the Chairman of the Management Board, met six times in 2025 to review, in particular, the adequacy of the risk management frameworks, and validated the annual review of the risk policies. These systems cover all risks, as described in the order of November 3, 2014 on internal control as amended by the order of February 25, 2021.
-
3.2 Risk appetite
All risks are covered by central and local risk management frameworks, in line with the Group’s risk appetite and strategy.
Groupe BPCE’s Supervisory Board approved the Group’s risk appetite framework: quantitative indicators, resilience threshold for each indicator and associated governance. During its annual review, held on November 5 and December 11, 2025, the Supervisory Board examined and approved the Group’s risk appetite.
As a decentralized and united cooperative Group, Groupe BPCE structures its activity around share capital, held predominantly by the regional institutions, and centralized market funding, optimizing the resources allocated to the entities.
- through its cooperative nature, is firmly committed to generating recurring and resilient income for its cooperative shareholders and investors by offering the best service to its customers;
- must preserve the solvency, liquidity and reputation of each Group entity – a duty assumed by the central institution through the oversight of consolidated risks, a risk policy and shared tools;
- consists of regional banks, which own the Group and its subsidiaries. In addition to normal management operations, in the event of a crisis, solidarity mechanisms between Group entities ensure the circulation of capital and prevent the entities or the central institution from defaulting;
- focuses on the structural risks of its full-service banking model, with a predominant retail banking component in France, while incorporating other business lines necessary to provide quality service to all of its customers;
- diversifies its exposures by developing certain activities in line with its strategic plan:
- – development of the Corporate & Investment Banking, bancassurance and asset management activities,
- – international expansion (predominantly Corporate & Investment Banking and asset management, with a more targeted approach for retail banking customers).
Groupe BPCE’s risk appetite is defined as the level of risk it is willing to accept with the goal of increasing its profitability while maintaining solvency. This risk appetite must be aligned with the institution’s operating environment, strategy and business model, while making customer interests the top priority. In determining its risk appetite, Groupe BPCE aims to steer clear of any major pockets of concentration and to optimize capital allocation.
In terms of risk profile, Groupe BPCE incurs risks intrinsically associated with its retail banking and Corporate & Investment Banking activities. Changes to its business model are increasing the Group’s exposure to some types of risks, particularly risks related to asset management and international businesses.
The Group does not conduct business unless it has the associated risks sufficiently under control, nor does it exercise proprietary trading activities. Activities with high risk-reward profiles are strictly controlled.
In all activities, entities and regions of operation, the Group undertakes to meet the highest standards of ethics, conduct, best execution and transaction security.
The risk appetite framework is based on a master document providing a qualitative and quantitative description of the risks that Groupe BPCE is willing to assume, and describing the governance and operating guidelines in effect.
The implementation of the risk appetite framework is centered on four key components: (i) the definition of groupwide standards, (ii) the existence of a set of limits in line with those defined by regulations, (iii) the distribution of expertise and responsibilities between the entities and the central institution and (iv) the operation of the governance process within the Group and the different entities, enabling the efficient and resilient application of the risk appetite framework.
The Group’s risk appetite framework is regularly updated (at least annually) and is centered on a series of successive limits associated with separate respective authorization levels, i.e.:
- an observation or tolerance threshold, which, if breached, calls for BPCE Management Board members to decide either to require the breach to be corrected or to allow the transaction to go ahead on an exceptional basis;
- a RAF limit (Risk Appetite Framework) or resilience threshold, the breach of which would pose a potential risk to the continuity and/or stability of the business. Any such breach must be reported to the Supervisory Board of BPCE and addressed by a specific action plan validated by the Board;
- an extreme limit in conjunction with the Group’s resolution and recovery plan which, if breached, could jeopardize the Group’s very survival. This extreme limit concerns certain indicators adopted in respect of the Group’s risk appetite.
A quarterly dashboard is prepared by the Group’s Risk division, for the purpose of regularly and extensively monitoring all risk indicators and reporting to the supervisory body or/and any committee thereof.
The Group Risk division issues an annual compliance notice to the institutions in their annual review proposal, ensuring a high level of consistency between the risk appetites implemented locally and that of the Group.
- in terms of solvency, the Group is able to absorb, if need be, the occurrence of a risk at entity or Group level;
- in terms of liquidity, the Group has a significant reserve consisting of cash and securities enabling it to meet regulatory requirements, pass stress tests and access central bank unconventional financing mechanisms. It also has a sufficient amount of high-quality liquid assets eligible for market funding mechanisms and those offered by the European Central Bank.
The Group ensures the robustness of this system by implementing global or dedicated stress tests such as those for climate risk management, which are carried out regularly. They are intended to verify the Group’s resilience, particularly in the event of a serious crisis.
Credit and counterparty risk
Credit risk, generated by the Group’s predominant business (i.e. lending to individual and corporate customers), is governed by risk policies applied to all Group entities, concentration limits defined by counterparty, country and sector, and finally extensive oversight of loan books.
€391 billion
Risk-weighted assets (-1.7% vs. 2024)
These exposures are predominantly based on the internal model approach (50% of risk-weighted assets)
€1,552 billion
Gross exposures (+2.7% vs. 2024)
The loan book has a balanced risk profile
€2.5 billion
Cost of risk
(+20% vs. 2024)28 bps
Average annual cost of risk
(vs. 24 bps in 2024)2.7%
NPL/gross loan outstandings
39.4%
Coverage of NPL by provisions

Structural ALM risks
Structural interest rate risk, associated in particular with fixed rate home loans and regulated liabilities, is governed by groupwide standards and individual entity limits; liquidity risk is steered centrally by allocating budget-defined liquidity to round out customer deposits raised by the entities.
In 2025, liquidity was maintained at a high level, providing the Group with significant coverage of stress scenarios.
Coverage of short-term
funding by liquidity reserve:197%
145%
12-month average LCR
Market risks
Market risk indicators are monitored and analyzed at various position aggregation levels, giving an overview of total exposure and risk consumption by risk factor.
€18 billion
Risk-weighted
assets (+15.2% vs. 2024)
73%
of outstandings determined using the standardized approach
€7.3
million
VaR
VaR and stress indicators
held steady at low levels throughout 2025.

Non-financial risks
Non-financial risks are non-compliance, fraud, information system security, reputational and misconduct risks, as well as other operational risks.
€51 billion
Operational risk-weighted assets (+20.4% vs. 2024)
The main causes of operating losses are in the “External fraud” category in Basel at 37%.

Groupe BPCE places great importance on anticipating and managing emerging risks in today’s constantly changing environment. To this end, a prospective analysis identifying the risks that could impact the Group is carried out every six months and presented to the Risk and Compliance Committee, followed by the Board’s Risk Committee. This forward-looking analysis is complemented by an expanded study of emerging and increasingly important risks, covering nascent or rapidly evolving risks whose impact could be significant in the medium or long term.
Since the previous study, the macroeconomic context has changed. Although inflation seems to be stabilizing, uncertainties remain, particularly regarding the political situation in France, the impacts of the US administration’s political decisions, and the overall increase in geopolitical risks that could affect economic stability in the short term.
Credit risk, cyber risk, interest rate risk and liquidity risk are still the four main risks weighing on business.
Regarding credit risk, the context remains deteriorated, with the level of corporate defaults continuing. The outlook for businesses, particularly small ones, and for the commercial real estate sector remains unfavorable, while the claims ratio for individuals could be exacerbated by a rise in unemployment.
Cyber risk also remains significant. The continued digitalization of the economy and financial services is accompanied by constant vigilance by banks in the face of cyber risks. The sophistication of cyber-attacks and potential vulnerability of their IS systems are both major risks for Groupe BPCE, in conjunction with the expectations of the regulatory authority.
-
3.3 Risk management
Risk management is governed by two main bodies at Group level: the Supervisory Board, which is supported by the Board’s Risk Committee, and the Executive Management Committee, of which the Head of Risk Management is a member.
Chaired by the Chairman of the Management Board, the Group Risk and Compliance Committee, an umbrella committee, sets the broad outlines of the risk policy and examines issues related to non-financial risks (specifically those related to banking, insurance and investment service compliance, and to financial security), annually reviews the risk appetite framework, and approves a prospective risk analysis.
The Group Risk division and Corporate Secretary’s Office – in charge of compliance and permanent control – measure, monitor and manage risks, pursuant to the order of November 3, 2014 as amended by the order of February 25, 2021, on internal control.
They ensure that the risk management framework is effective, complete and consistent, and that risk-taking is consistent with the guidelines for the business (particularly the targets and resources of the Group and its institutions).
These duties are formalized in Groupe BPCE’s Internal Control Charter, an umbrella charter. This charter is based on the two charters of the control functions, namely the Internal Audit Charter and the Second Line of Defense Charter, reviewed in March 2025.
The various departments of the Group Risk division are involved in all risks (credit, financial, operational, ESG, model and non-banking investments) by acting on:
The departments of the Group’s Risk division operate in three areas (Management, Monitoring and Control):
Management Monitoring Control - present the Management Board and Supervisory Board with a risk appetite framework for the Group and ensure its implementation and roll-out at each major entity;
- define the risk policies applicable to the Group’s scope and determine the overall risk ceilings (institutions, customers, business sector), and take part in discussions on the allocation of capital and ensure that portfolio management complies with this system of limits and allocations;
- define and implement standards and methods for consolidated risk measurement, risk-taking approval, risk control and reporting, and compliance with risk regulations;
- oversee the risk information system, working closely with the IS departments, while defining the standards to be applied for the measurement, control, reporting and management of risks;
- maintain a strong functional link with the risk and compliance functions, notably by approving the appointment or dismissal of all new Heads of Risk Management, Heads of Compliance, or Heads of Risk and Compliance;
- contribute to the dissemination of the risk and compliance culture and annual training plans and to the sharing of best practices within the Group.
- carry out the macro-level risk mapping exercise, factoring in the overall risk policy, risk appetite and annual permanent control plan, which is part of the internal control system;
- conduct permanent monitoring of portfolios and activities, limit breaches and their resolution, centralize risk data and prepare forward-looking risk reports on a consolidated basis;
- help the Groupe BPCE Management Board to identify emerging risks, concentration of risk and other various developments, and to devise strategy and adjust risk appetite;
- perform stress tests with the goal of identifying areas of risk and the Group’s resilience under various predetermined shock scenarios.
- assess and control the level of risk across the Group;
- conduct controls to ensure that the operations and internal procedures of Group companies comply with legal, professional, or internal standards applicable to banking, financial and insurance activities;
- implement a permanent second-level Group control system for the risks of the institutions and the sensitive activities of the Group Risk division;
- carry out permanent controls to ensure the correct implementation of risk policies or standards in the Group’s institutions.
Several committees are responsible for defining groupwide methodology standards for measuring, managing, reporting and consolidating all risks throughout the Group.
Group Risk and Compliance Committee - This committee covers the Group’s major risks and prepares issues that are reported to the Supervisory Board’s Risk Committee. It examines the Group’s main risk areas (all types of risks), including non-compliance, insurance and existing or potentially emerging risks (prospective vision) and validates the associated action plans. It reviews the Group risk dashboard, including the RAF indicators and the revised order of 11/03/2014, potential excesses of the indicators, and alerts on significant incidents under Article 98.
- It meets on a quarterly basis.
Group Counterparty and Credit Risk Committees - This committee covers credit, counterparty, concentration and residual risks. The Committee validates the dashboard for monitoring internal caps, group/individual limits by counterparty, by sector, by country and their breakdown between the entities, where applicable, the sectoral analyses and the analyses of consumer and home loan portfolios.
- The Committee meets twice a month, on average.
Group Watch List Committee and IFRS 9 Committee - This committee is divided into two parts, with a special Group IFRS 9 Committee, and covers the impairment of loan outstandings (individual loans for significant or shared amounts and statistical provisioning on performing loans) and market outstandings.
- It meets quarterly in connection with the closing of accounts.
Group Market Risk Committees - This committee covers market, interest rate, securitization, liquidity reserve (investment), liquidity, spread and foreign exchange risks. The committee makes decisions on the review of the ALM risk management framework and market risks, action plans and monitoring in the event of overruns, new products authorized for the institutions’ own activities and new management activities, and portfolio review (Private Equity, Non-Operating Real Estate and Other Assets).
- The Committee meets almost monthly.
Non-Financial Risk Committee - This committee covers risks relating to operational, model, legal, non-compliance, and fraud and the EBCP risk management framework, personal and property security as well as Group information systems security.
- It also performs consolidated supervision of losses, incidents and alerts, including reports made to the Autorité de contrôle prudentiel et de résolution (ACPR), the French prudential supervisory authority for the banking and insurance sector, under Article 98 of order A-2014-11-03 as amended by the order of February 25, 2021, for non-financial risks, and contributes to risk-mapping and monitoring the action plans for reducing non-financial risks.
- It meets on a quarterly basis.
Asset/Liability Committee GAP - The Committee’s main duties are to determine the Group’s general policy with regard to liquidity and transformation risks (including interest rate risk), examine the consolidated view of the structural risks of the Group and its various entities as well as changes in the balance sheet, define the limits of the structural risks of the Group and the pools and monitor them (with validation by the Risk Department), validate the allocation to liquidity pools and limits; and monitor liquidity consumption at Group and pool level, validate Groupe BPCE’s overall annual MLT and ST refinancing program and carry out overall monitoring, and validate the investment and allocation criteria as well as the desired overall profile of the Group’s liquidity reserve.
- The Committee meets every two months.
ESG Risk Committee - It is responsible for consolidated monitoring of Groupe BPCE’s ESG risks and ensuring the implementation of the organizational and operational strategy regarding ESG risk management. It validates the main methodological choices and scenarios used within the Group in the context of ESG risk management. It reviews and validates the assessment of the materiality of ESG risks and decides on the Group’s ESG risk appetite.
- This Committee meets quarterly.
Model Risk Management Committee - This committee proposes to the governance a resilient model risk management framework, making it possible to propose risk indicators and any associated thresholds to the bodies, to monitor the evolution of the portfolio of models, to ensure the proper dissemination of the model risk management framework within the Group.
- It meets every two months.
Group Internal Control Coordination Committee - This committee brings together, at a minimum, all periodic and permanent control functions (risk and compliance), the financial function responsible for accounting controls, and the Security function, including Information Systems Security. It addresses all cross-cutting actions aimed at strengthening the coherence and effectiveness of internal control. It is a decision-making committee.
- It meets on a quarterly basis.
The Risk Governance and Control department is responsible for coordinating and animating the risk division, the second level permanent control of the Risk division within Groupe BPCE, and the activities of the Group Risk division. The Second Line of Defense Charter calls for the Group Risk division to participate, at its own initiative, in the annual performance assessment of the Heads of the Permanent Control functions, particularly as regards risk and/or compliance, in consultation with the Chairman of the Management Board or the Chief Executive Officer.
The Risk Governance and Control department deploys the entire system on a daily basis and contributes to the overall supervision of Group risks, primarily through:
- oversight and updates of key risk and Compliance function documents such as charters and standards;
- second-level permanent control of Groupe BPCE’s Risk division, as well as the sensitive activities of the Group’s Risk division, via a dedicated department;
- the performance of operational efficiency work (effective benchmark standards), work related to the risk-based approach (half-yearly risk and compliance reporting, risk appetite framework, macro-mapping of risks, etc.);
- the follow-up of all recommendations issued by supervisors and by the General internal audit in the area of risk management and permanent control;
- an assessment of the Risk Management functions is conducted every year and presented to the Risk Committee of the Groupe BPCE Supervisory Board.
- Contribution to the Risk division’s transformation projects.
- Implementation of permanent level 2.2 controls on credit files by the permanent risk control division.
- Control of the proper implementation of the Group’s risk policies (credit risks, operational risks, reputational risks, ALM risks) in the local policies of the institutions.
- Implementation of monthly monitoring of affiliates’ risk appetite indicators.
- Review of the specific headcount benchmark standard for a few institutions.
- Implementation of an induction day for new employees in the Risk division.
To promote and strengthen the risk and compliance culture at all levels, the Group Risk division and the Group Compliance department strive to develop risk and compliance training and awareness programs at all Group levels, establish regular communication on risk and compliance issues throughout the Group, and disseminate and measure the risk and compliance culture.
Rigorous risk management is one of the principles of Groupe BPCE, which has always prioritized a culture of risk management and control. In order to support the development of its activities, within the framework of its risk appetite, Groupe BPCE strives to promote and strengthen the risk and compliance culture at all levels.
First of all, risk training and acculturation are one of the major challenges in the development of the risk culture. All employees and managers are concerned, regardless of their level, including directors. This is why the Group Risk division has developed the Risk Academy, which offers training modules to support the development and refinement of the skills of Risk division employees in their various business lines.
Coordination and animation for regulatory watch is set up in order to discuss regulatory news and anticipate projects that could be rolled out. Coordination of the risk chapters is also implemented for regulatory reporting (Universal Registration Document, Pillar III, annual report on internal control, ICAAP).
The Eval’ CultuRisques study aims to assess the level of risk culture of Groupe BPCE institutions via a questionnaire based on Group standards in accordance with regulatory requirements and best practices in terms of risk culture, particularly as described by the EBA in its “internal governance” document.
In addition to the risk supervision conducted both individually and by type of risk, Groupe BPCE’s Risk division also performs consolidated monitoring of the Group’s risks.
The Group Risk division also conducts or coordinates cross-business risk analyses and specific stress tests on the Group’s main portfolios or activities and, if needed, for the entities. It has also developed half-year forward-looking risk analyses aimed at identifying economic risk factors (known and emerging; international, national and regional), circumstantial threats (regulations, etc.) and their potential impact on the Group. These forward-looking analyses are presented at meetings of the Group Supervisory Board’s Risk Committee.
In addition, it carries out risk measurements on a portfolio basis. It reviews and validates risk models developed internally. Lastly, it contributes to efforts to define internal capital requirements as well as internal and external solvency stress tests aimed at measuring the Group’s sensitivity to a series of risk factors and its resilience in the event of a severe shock, by determining impacts in terms of cost of risk and RWA.
Groupe BPCE has been developing stress tests since 2011 that can be performed using the risk modules for Group strategic analysis purposes and regulatory purposes.
There are two types of stress tests:
- internal stress tests (including reverse stress tests);
- regulatory stress test (including EBA stress test, ECB thematic stress tests, such as climate or geopolitical stress).
The governance of the Group’s stress testing system is based on a comprehensive approach covering all Group entities, taking into consideration their specific characteristics, and covering the following risks:
- credit risks: change in cost of risk and risk-weighted assets;
- securitization portfolio and counterparty risk: change in impairment and risk-weighted assets;
- market risks: market shocks, change in securities portfolios and risk-weighted assets;
- revenue risks (including net interest margin and fees and commissions);
- operational risks;
- climate risks;
- insurance risk.
Risks associated with sovereign exposures are addressed according to their accounting classification in market risk or credit risk.
Models are used for each risk category to determine the impacts of scenarios on the various income statement items and capital requirements.
The methodologies used to determine the projections are based on:
- the methodology stipulated by the ECB and the EBA for regulatory stress tests;
- internal methodologies adapted to the Group’s business model, as part of the budget exercise and risk management.
Several scenarios are tested in order to assess all impacts: Baseline scenario Baseline scenario comprising the budget scenario. ICAAP adverse scenarios Scenarios that are both severe and plausible to provide relevant information on risk and resilience under the ICAAP. Adverse Preventive Recovery Plan scenarios Scenarios used as part of the Preventive Recovery Plan to assess the Group’s ability to recover. These scenarios are linked to those of the ICAAP (in terms of solvency) and the ILAAP (in liquidity) with possible adjustments in terms of severity. Reverse scenarios Unlike stress tests, reverse analyses aim to determine the plausibility of negative events for the Group’s financial trajectory. They improve the Group’s knowledge of its risks and ensure that stress scenarios are well suited to testing the Group’s vulnerabilities. -
3.4 Internal control
The Group control system relies on three levels of controls, in accordance with banking regulations and sound management practices (two levels of permanent controls and one level of periodic control), as well as the establishment of consolidated control processes in accordance with provisions approved by BPCE’s Management Board.
The Group’s Risk division and the Corporate Secretary’s Office carry out their missions within the framework of a business line approach dedicated to the management of credit risks, financial risks, operational risks, climate risks and non-compliance risks extended to business continuity functions, financial control and security of information systems, GDPR, business continuity and crisis management. They ensure that the risk policies of the affiliates and subsidiaries comply with those of Groupe BPCE.
The Risk and/or Compliance divisions of subsidiaries not subject to the banking supervision regulatory framework are functionally subordinate to the Group Risk division and the Corporate Secretary’s Office.
The strong functional authority is exercised by the Head of Risk Management and by the Secretary General, both members of Groupe BPCE’s Executive Management Committee. It enables risk controls to be performed objectively, as each Group entity’s operational functions are independent from its risk and Compliance functions. It also promotes a risk management and compliance culture and the application of shared risk management standards, and ensures that managers are given independent, objective and detailed information on the Group’s risk exposures and any possible deterioration in its risk profile.
Group institutions are responsible for defining, monitoring and managing their risk levels, as well as producing reports and data for submission to the central institution’s Risk division and Corporate Secretary’s Office. They ensure the quality, reliability and completeness of the data used to control and monitor risks at the company level and on a consolidated basis, in line with Group risk standards and policies.
The organization of permanent control in the Group is specified in the Internal Control Charter (updated in 2025) and in the Second Line of Defense Charter (updated on March 27, 2025) in paragraphs 2 and 5 in accordance with the order of November 3, 2014 (revised on February 25, 2021).
In terms of governance, the assessment of the permanent control system is the responsibility of the Group Internal Control Coordination Committee (or 3CI or CCFC in its local implementation).
The Chairman of the BPCE Management Board is responsible for ensuring the consistency and effectiveness of the internal control system. A Group Internal Control Coordination Committee, chaired by the Chairman of the Management Board, meets periodically.
This committee is responsible for dealing with all issues relating to the consistency and effectiveness of the Group internal control system, as well as the results of risk management and internal control work and follow-up work.
As part of the responsibilities defined in Article 17 of order A-2014-11-03 amended on February 25, 2021 on internal control, the Group Internal Audit or the Internal Audit function carries out periodic controls of all activities, ensuring the quality, effectiveness, consistency and efficiency of the permanent control system and risk management. Its scope of intervention covers all the risks and all the activities of the institution, including those that are outsourced. Internal audit also extends to its subsidiaries and prudentially consolidated entities.
In fulfilling this responsibility, it relies on the findings of its department’s investigations and the work of other supervisory bodies, such as the Autorité de contrôle prudentiel et de résolution (ACPR), the French prudential supervisory authority for the banking and insurance sector.
In accordance with the duties incumbent on the central institution, and pursuant to the rules of collective solidarity, the General internal audit is responsible for periodically verifying the operation of all Group institutions and providing their executive managers with reasonable assurance of their financial strength.
-
3.5 Recovery Plan
The plan is in line with European regulatory measures on the recovery and resolution of banks and investment firms, and with the provisions of the French Monetary and Financial Code.
The objective of the Recovery Plan is to identify options to restore the Group’s financial stability in the event it deteriorates significantly.
The plan presents a dedicated crisis management system and analyzes the relevance and feasibility of the options for restoring capital and liquidity under different crisis scenarios in order to estimate its overall recovery capacity.
- a description of the Group’s organizational structure and the specific implications of its cooperative status;
- the identification of the Group’s critical functions and the main activities (Core Business Lines) exercised by the Group;
- capital and liquidity management systems;
- the quantification and analysis of financial crisis scenarios;
- the identification of options impacting the restoration of the Group’s financial position and their impacts on the Group’s business model;
- preventative oversight of leading indicators on financial and economic conditions;
- establishment of the organizational structures needed to implement the recovery.
-
4.1 Regulatory framework
Credit institutions’ capital is regularly monitored in accordance with regulations defined by the Basel Committee.
These regulations were reinforced following the introduction of Basel III, with an increase in the level of regulatory capital requirements and the introduction of new risk categories.
In 2025, Groupe BPCE is required to observe a minimum Common Equity Tier-1 ratio of 4.5% under Pillar I, a minimum Tier-1 capital ratio of 6% and, lastly, a minimum total capital ratio of 8%.
Alongside Pillar I minimum capital requirements, Groupe BPCE is subject to additional Tier-1 capital requirements:
- as of January 1, 2019, the Tier-1 capital conservation buffer is 2.5% of the total amount of risk exposures;
- Groupe BPCE’s countercyclical buffer equals the EAD-weighted average of the buffers defined for each of the Group’s countries of operation. Groupe BPCE’s maximum countercyclical buffer as from January 1, 2019 is 2.5%;
- the G-SII buffer has been set at 1% for the Group;
- the systemic risk buffer is applied to all exposures located in the Member State setting this buffer and/or to sectoral exposures located in the same Member State. These buffers only apply above a certain exposure threshold. As Groupe BPCE is below these thresholds, it is not subject to them.
Credit institutions must comply with the prudential requirements, which are based on three pillars that form an indivisible whole:
Pillar I sets minimum requirements for capital. It aims to ensure that banking institutions hold sufficient capital to provide a minimum level of coverage for their credit risk, market risk and operational risk. The bank can use standardized or advanced methods to calculate its capital requirement.
2024 2025 Minimum regulatory capital requirements Common Equity Tier-1 (CET1) capital 4.5% 4.5% Total Tier-1 capital (T1 = CET1 + AT1) 6.0% 6.0% Regulatory capital (T1 + T2) 8.0% 8.0% Additional requirements Capital conservation buffer 2.5% 2.5% G-SII buffer applicable to Groupe BPCE (1) 1.0% 1.0% Maximum countercyclical buffer applicable to Groupe BPCE (2) 2.5% 2.5% Maximum total capital requirements for Groupe BPCE Common Equity Tier-1 (CET1) capital 10.5% 10.5% Total Tier-1 capital (T1 = CET1 + AT1) 12.0% 12.0% Regulatory capital (T1 + T2) 14.0% 14.0% - (1) G-SII buffer: global systemic buffer.
- (2) The countercyclical buffer requirement is calculated quarterly.
Pillar II establishes a process of prudential supervision that complements and strengthens Pillar I.
- an analysis by the bank of all of its risks, including those already covered by Pillar I;
- an estimate by the bank of the capital requirement for these risks;
- a comparison by the banking supervisor of its own analysis of the bank’s risk profile with the analysis conducted by the bank, in order to adapt its choice of prudential measures where applicable, which may take the form of capital requirements exceeding the minimum requirements or any other appropriate technique.
-
4.2 Scope of application
Groupe BPCE is required to submit consolidated regulatory reports to the European Central Bank (ECB), the supervisory authority for Eurozone banks. Pillar III is therefore prepared on a consolidated basis.
The regulatory scope of consolidation is established based on the statutory scope of consolidation. The main difference between these two scopes lies in the consolidation method for insurance companies, which are accounted for by the equity method within the regulatory scope, regardless of the statutory consolidation method.
The following insurance companies are accounted for by the equity method within the prudential scope of consolidation:
- Surassur;
- BPCE Assurances (formerly Natixis Assurances);
- Compagnie Européenne de Garanties et de Cautions;
- Prépar-Vie;
- Prépar-IARD;
- Oney Insurance;
- Oney Life.
The following insurance companies are accounted for by the equity method within both the statutory and regulatory scopes of consolidation:
In addition, since the second quarter of 2020, the Versailles entity is consolidated using the equity method. This change, which concerns only the regulatory scope, since the entity is still considered to be under control within the meaning of IFRS, follows a detailed analysis of the regulatory texts. The latter stipulate that non-financial entities that do not constitute ancillary services within the meaning of the standard are accounted for using the equity method for the purposes of reporting ratios. This decision, approved by the Group’s bodies, allows for an alignment of the scopes used to calculate liquidity and solvency.
The table below shows the transition from an accounting balance sheet to a prudential balance sheet for Groupe BPCE at December 31, 2025.
The differences between the statutory and regulatory scopes can be attributed to restatements for subsidiaries excluded from the regulatory scope (see the description of the regulatory scope below) and the reincorporation of intra-group transactions related to these subsidiaries.
12/31/2025 a b c Balance sheet in the
published financial
statementsAccording to the regulatory
scope of consolidationin millions of euros At end of period At end of period Reference (1) ASSETS - BREAKDOWN BY ASSET CLASSES ACCORDING TO THE BALANCE SHEET IN THE PUBLISHED FINANCIAL STATEMENTS 1 Cash and amounts due from central banks 133,938 134,049 2 Financial assets at fair value through profit or loss 239,646 239,973 3 – o/w debt securities 38,956 38,858 4 – o/w equity instruments 48,808 48,808 5 – o/w loans (excluding repurchase agreements) 9,283 9,283 6 – o/w repurchase agreements 77,613 77,649 7 – o/w trading derivatives 52,720 52,928 8 – o/w security deposits paid 12,266 12,447 9 Hedging derivatives 6,398 6,398 10 Financial assets at fair value through other comprehensive income 63,971 63,976 11 Securities at amortized cost 26,851 27,119 12 Loans and advances to banks at amortized cost 122,373 122,036 13 Loans and advances to customers at amortized cost 879,407 878,105 14 Revaluation differences on interest rate risk-hedged portfolios, assets (2,201) (2,201) 15 Insurance activities financial investments 129,597 0 16 Insurance contracts issued - Assets 1,168 618 17 Reinsurance contracts held - Assets 9,188 62 18 Current tax assets 796 795 19 Deferred tax assets 4,292 3,999 1 20 Accrued income and other assets 14,932 14,997 21 Non-current assets held for sale 197 197 22 Investments accounted for using equity method 2,200 6,101 23 Investment property 984 984 24 Property, plant and equipment 6,645 6,637 25 Intangible assets 1,328 1,221 2 26 Goodwill 4,023 3,973 2 TOTAL ASSETS 1,645,733 1,509,039 LIABILITIES - BREAKDOWN BY LIABILITY CLASSES ACCORDING TO THE BALANCE SHEET IN THE PUBLISHED FINANCIAL STATEMENTS 1 Central banks 12 12 2 Financial liabilities at fair value through profit or loss 233,777 229,211 3 3 – o/w securities sold short 25,478 25,477 4 – o/w other liabilities issued for trading purposes 97,780 97,780 5 – o/w trading derivatives 43,036 43,194 6 – o/w security deposits received 10,298 10,301 7 – o/w financial liabilities designated at fair value through profit or loss – under option 57,185 52,459 8 Hedging derivatives 13,251 13,159 9 Debt securities 283,035 279,390 10 Amounts due to banks 90,939 87,912 11 Amounts due to customers 757,253 763,170 12 Revaluation differences on interest rate risk-hedged portfolios, liabilities 25 25 13 Insurance contracts issued - Liabilities 129,971 0 14 Reinsurance contracts held - Liabilities 109 0 15 Current tax liabilities 2,433 2,434 16 Deferred tax liabilities 1,491 1,196 1 17 Accrued expenses and other liabilities 20,527 20,071 18 Liabilities associated with non-current assets held for sale 21 21 19 Provisions 4,613 4,569 20 Subordinated debt 18,012 17,649 3 TOTAL LIABILITIES 1,555,469 1,418,819 1 Shareholders’ equity 2 Equity attributable to equity holders of the parent 89,309 89,301 4 3 Share capital and additional paid-in capital 29,461 29,461 4 Consolidated reserves 56,070 56,062 5 Gains and losses recognized directly in other comprehensive income (283) (283) 6 Net income for the period 4,061 4,061 7 Non-controlling interests 955 919 5 TOTAL SHAREHOLDERS’ EQUITY 90,264 90,220 12/31/2024 a b c Balance sheet in the
published financial
statementsAccording to the regulatory
scope of consolidationin millions of euros At end of period At end of period Reference (1) ASSETS - BREAKDOWN BY ASSET CLASSES ACCORDING TO THE BALANCE SHEET IN THE PUBLISHED FINANCIAL STATEMENTS 1 Cash and amounts due from central banks 133,186 133,225 2 Financial assets at fair value through profit or loss 230,521 230,546 3 – o/w debt securities 26,900 26,750 4 – o/w equity instruments 48,114 48,114 5 – o/w loans (excluding repurchase agreements) 8,861 8,861 6 – o/w repurchase agreements 81,693 81,693 7 – o/w trading derivatives 53,616 53,767 8 – o/w security deposits paid 11,337 11,361 9 Hedging derivatives 7,624 7,624 10 Financial assets at fair value through other comprehensive income 57,166 57,281 11 Securities at amortized cost 27,021 27,298 12 Loans and advances to banks at amortized cost 115,862 115,696 13 Loans and advances to customers at amortized cost 851,843 850,416 14 Revaluation differences on interest rate risk-hedged portfolios, assets (856) (856) 15 Insurance activities financial investments 115,631 16 Insurance contracts issued - Assets 1,134 654 17 Reinsurance contracts held - Assets 9,320 60 18 Current tax assets 640 647 19 Deferred tax assets 4,160 3,885 1 20 Accrued income and other assets 16,444 16,317 21 Non-current assets held for sale 438 438 22 Investments accounted for using equity method 2,146 5,912 23 Investment property 733 733 24 Property, plant and equipment 6,085 6,074 25 Intangible assets 1,147 1,027 2 26 Goodwill 4,312 4,262 2 TOTAL ASSETS 1,584,558 1,461,241 LIABILITIES - BREAKDOWN BY LIABILITY CLASSES ACCORDING TO THE BALANCE SHEET IN THE PUBLISHED FINANCIAL STATEMENTS 1 Central banks 1 1 2 Financial liabilities at fair value through profit or loss 218,963 215,130 3 3 – o/w securities sold short 21,576 21,577 4 – o/w other liabilities issued for trading purposes 100,130 100,130 5 – o/w trading derivatives 43,557 43,626 6 – o/w security deposits received 10,073 10,093 7 – o/w financial liabilities designated at fair value through profit or loss – under option 43,627 39,704 8 Hedging derivatives 14,260 14,253 9 Debt securities 304,957 301,351 10 Amounts due to banks 69,953 67,268 11 Amounts due to customers 723,090 728,230 12 Revaluation differences on interest rate risk-hedged portfolios, liabilities 14 14 13 Insurance contracts issued - Liabilities 117,551 14 Reinsurance contracts held - Liabilities 119 15 Current tax liabilities 2,206 2,212 16 Deferred tax liabilities 1,323 1,109 1 17 Accrued expenses and other liabilities 20,892 20,483 18 Liabilities associated with non-current assets held for sale 312 312 19 Provisions 4,748 4,702 20 Subordinated debt 18,401 18,186 3 TOTAL LIABILITIES 1,496,790 1,373,251 1 Shareholders’ equity 2 Equity attributable to equity holders of the parent 87,137 87,129 4 3 Share capital and additional paid-in capital 29,349 29,349 4 Consolidated reserves 53,427 53,419 5 Gains and losses recognized directly in other comprehensive income 842 842 6 Net income for the period 3,520 3,520 7 Non-controlling interests 630 861 5 TOTAL SHAREHOLDERS’ EQUITY 87,768 87,990 -
4.3 Composition of regulatory capital
The regulatory capital is determined in accordance with Regulation (EU) 575/2013 of the European Parliament of June 26, 2013 on capital amended by Regulation (EU) 2024/1623 (CRR3).
It is divided into three categories: Common Equity Tier-1 capital, Additional Tier-1 capital and Tier-2 capital. Deductions are made from these categories.
These categories are broken down according to decreasing degrees of solidity and stability, duration and degree of subordination.
in millions of euros 12/31/2025
Basel IV12/31/2024
Basel IIIShare capital and additional paid-in capital 29,461 29,349 Consolidated reserves 56,062 53,419 Net income for the period 4,061 3,520 Gains and losses recognized directly in other comprehensive income (283) 842 CONSOLIDATED EQUITY ATTRIBUTABLE TO EQUITY HOLDERS OF THE PARENT 89,301 87,130 Perpetual deeply subordinated notes classified as other comprehensive income - - CONSOLIDATED EQUITY ATTRIBUTABLE TO EQUITY HOLDERS OF THE PARENT EXCLUDING PERPETUAL DEEPLY SUBORDINATED NOTES CLASSIFIED AS OTHER COMPREHENSIVE INCOME 89,301 87,130 Non-controlling interests 221 219 – o/w prudential filters - - Deductions (6,309) (6,352) – o/w goodwill (1) (4,070) (4,255) – o/w intangible assets (1) (984) (852) – o/w irrevocable payment commitments (1,144) (1,147) Prudential restatements (6,903) (7,150) – o/w shortfall of credit risk adjustments to expected losses (15) (210) – o/w prudent valuation (1,113) (1,088) – o/w insufficient coverage for non-performing exposures - Pillar II (1,063) (1,122) COMMON EQUITY TIER-1 CAPITAL (2) 76,310 73,847 Additional Tier-1 capital - - TIER-1 CAPITAL 76,310 73,847 Tier-2 capital 12,447 12,210 TOTAL REGULATORY CAPITAL 88,757 86,057 - (1) Including non-current assets and entities classified as held for sale.
- (2) The Common Equity Tier-1 included €29,693 million in cooperative shares (after taking allowances into account) at December 31, 2025, and €29,581 million at December 31, 2024.
Details of debt instruments recognized as additional Tier-1 and Tier-2 capital, other instruments eligible for TLAC, as well as their characteristics, as required by Implementing Regulation 1423/2013 are published at https://groupebpce.com/en/investors/results-and-publications/pillar-iii.
- share capital;
- additional paid-in capital or merger premiums;
- reserves, including revaluation differences and gains or losses recognized directly in other comprehensive income;
- retained earnings;
- net income attributable to equity holders of the parent;
- non-controlling interests in banking or related subsidiaries for the share after CET1 eligibility caps.
- treasury shares held and measured at their carrying amount;
- intangible assets (excluding the amount of prudently valued software, exempt from deduction) including start-up costs and goodwill;
- deferred tax assets and liabilities that rely on future profitability;
- prudential filters resulting from CRR Articles 32, 33, 34 and 35: gains or losses on cash flow hedges, gains on transactions in securitized assets, own credit risk;
- negative amounts arising from the comparison between provisions and expected losses (in this calculation, performing loans are clearly separated from loans in default);
- equity interests in eligible banking, financial and insurance institutions, according to the rules on allowances for these holding companies and the phase-in period;
- value adjustments arising from the prudent valuation of assets and liabilities measured at fair value according to a prudential method, deducting any value adjustments;
- defined benefit pension fund assets net of related deferred tax liabilities;
- insufficient hedging of non-performing exposures under Pillar I and Pillar II.
in millions of euros Non-controlling
interestsCarrying amount (regulatory scope) – 12/31/2025 919 Perpetual deeply subordinated notes classified as non-controlling interests - Ineligible non-controlling interests (642) Proposed dividend payout - Caps on eligible non-controlling interests (56) Non-controlling interests (excluding other items) 221 Other items - Prudential amount – 12/31/2025 221 - subordinated instruments issued in compliance with the restrictive eligibility criteria set forth by CRR Article 52;
- additional paid-in capital related to these instruments.
Deductions comprise equity interests in eligible banking, financial and insurance institutions, according to the rules on allowances for these holding companies.
- subordinated instruments issued in compliance with the restrictive eligibility criteria set forth by CRR Article 63;
- additional paid-in capital related to Tier-2 items;
- the amount arising from provisions in excess of expected losses (in this calculation, performing loans are clearly separated from loans in default).
Deductions comprise equity interests in eligible banking, financial and insurance institutions, according to the rules on allowances for these holding companies.
- (1) As of June 30, 2025, to meet an ECB requirement notified to banks, subordinated loans included in regulatory capital are now measured at their carrying amount, including any hedging effects, rather than at their nominal value. This application had an impact of -€435 million on the value of the Tier-2 assets at December 31, 2025.
-
4.4 Regulatory capital requirements and risk-weighted assets
In accordance with Regulation (EU) 2024/1623 (CRR3) of the European Parliament, as amended by Regulation (EU) 2019/876 (CRR2), credit risk exposures can be measured using two approaches:
- the “standardized” approach, based on external credit ratings and specific risk weightings according to Basel exposure classes;
- the “internal ratings based” (IRB) approach, based on the financial institution’s internal ratings system, broken down into two categories:
- – the Foundation IRB approach – banks use only their probability of default estimates for this approach,
- – the Advanced IRB approach – banks use all their internal component estimates for this approach, i.e. probability of default, loss given default, exposure at default and maturity.
The methodology applied for IRB approaches is described in greater detail in Section 5 “Credit risk.”
In addition to the requirements related to counterparty risk in market transactions, the Regulation of June 26, 2013 provides for the calculation of an additional charge to hedge against the risk of loss associated with counterparty credit risk (CCR). Capital requirements for the Credit Valuation Adjustment (CVA) are determined using the Standardized Approach.
The table below complies with the CRR format, presenting capital requirements for credit and counterparty risks, before the CVA and after the application of risk mitigation techniques.
Total risk exposure amounts (TREA) Total own funds
requirementsa b c in millions of euros 12/31/2025 09/30/2025 12/31/2025 1 Credit risk (excluding CCR) 375,332 376,664 30,027 2 Of which the standardised approach 175,403 173,089 14,032 3 Of which the Foundation IRB (F-IRB) approach 53,991 53,583 4,319 4 Of which slotting approach - - - EU 4a Of which equities under the simple risk weighted approach 3,408 6,475 273 5 Of which the Advanced IRB (A-IRB) approach 133,910 135,362 10,713 6 Counterparty credit risk - CCR 11,206 11,823 896 7 Of which the standardised approach 2,496 2,597 200 8 Of which internal model method (IMM) 6,276 6,117 502 EU 8a Of which exposures to a CCP 1,036 1,240 83 EU 8b Of which credit valuation adjustment - CVA - 9 Of which other CCR 1,397 1,869 112 10 Credit valuation adjustments risk - CVA risk 4,145 4,151 332 10a Of which the standardised approach (SA) - - - 10b Of which the basic approach (F-BA and R-BA) 4,145 4,151 332 10c Of which the simplified approach - - - 15 Settlement risk 17 2 1 16 Securitisation exposures in the non-trading book (after the cap) 4,016 3,952 321 17 Of which SEC-IRBA approach 174 70 14 18 Of which SEC-ERBA (including IAA) 1,392 1,491 111 19 Of which SEC-SA approach 2,448 2,382 196 EU 19a Of which 1250% / deduction 1 8 0 20 Position, foreign exchange and commodities risks (Market risk) 17,517 15,116 1,401 21 Of which the Alternative standardised approach (A-SA) - - - 21a Of which the Simplified standardised approach (S-SA) 12,724 10,434 1,018 22 Of which the Alternative Internal Models Approach (A-IMA) 4,793 4,682 383 EU 22a Large exposures - - - 23 Reclassifications between trading and non-trading books - - - 24 Operational risk 50,821 43,320 4,066 24a Exposures to crypto-assets - - - 25 Amounts below the thresholds for deduction (subject to 250% risk weight) 13,813 13,545 1,105 26 Output floor applied (%) 50% 50% 27 Floor adjustment (before application of transitional cap) - - 28 Floor adjustment (after application of transitional cap) - - 29 Total 463,054 455,029 37,044 Basel III/IV in millions of euros Credit risk (1) CVA Market risk Operational risk Total Retail banking 12/31/2024 296,680 207 1,611 25,177 323,675 12/31/2025 298,669 210 1,758 31,884 332,521 Global Financial Services 12/31/2024 71,996 1,158 10,586 12,329 96,070 12/31/2025 64,656 3,518 13,232 16,453 97,858 Other 12/31/2024 28,851 287 3,003 4,706 36,846 12/31/2025 27,246 417 2,527 2,485 32,675 Total risk-weighted assets 12/31/2024 397,527 1,652 15,200 42,212 456,591 12/31/2025 390,571 4,145 17,517 50,821 463,055 12/31/2025 a b c d EU d Risk weighted-exposure amounts (RWEAs) in millions of euros RWEAs for
modelled
approaches that
institutions have
supervisory
approval to useRWEAs for
portfolios where
standardised
approaches are
usedTotal actual
RWEAs
(a + b)RWEAs calculated
using full
standardised
approachRWEAs that is the
base of the
output floor1 Credit risk (excluding counterparty credit risk) 198,740 175,403 374,143 593,767 541,418 2 Counterparty credit risk 9,011 2,195 11,206 25,044 23,413 3 Credit valuation adjustment 4,145 4,145 4,145 4,145 4 Securitisation exposures in the banking book 1,567 2,448 4,016 5,532 5,532 5 Market risk 4,793 12,724 17,517 26,867 26,867 6 Operational risk 50,821 50,821 50,821 50,821 7 Other risk-weighted exposure amounts 1,206 1,206 17 17 8 Total 214,111 248,943 463,054 706,193 652,213 EU CMS2 – Comparison of modelled and standardised risk weighted exposure amounts for credit risk at asset class level
12/31/2025 a b c d EU d Risk weighted exposure amounts (RWEAs) in millions of euros RWEAs for
modelled
approaches that
institutions have
supervisory
approval to useRWEAs for
column (a) if
re-computed
using the
standardised
approachTotal actual
RWEAsRWEAs
calculated
using full
standardised
approachRWEAs that is
the base of the
output floor1 Central governments and central banks - 28 8,482 8,510 8,510 EU 1a Regional government or local authorities - 2 1,973 1,975 1,975 EU 1b Public sector entities 24 232 3,543 3,751 3,751 EU 1c Categorised as Multilateral Development Banks in SA - 9 23 31 31 EU 1d Categorised as International organisations in SA - - - - - 2 Institutions 3,329 4,118 5,153 5,943 5,943 3 Equity 10,836 11,780 29,932 30,876 30,876 5 Corporates 99,093 137,904 166,808 220,721 205,619 5.1 Of which: F-IRB is applied 49,023 72,646 49,023 86,408 72,646 5.2 Of which: A-IRB is applied 40,500 94,089 40,500 95,565 94,089 EU 5a Of which: Corporates - General 89,524 113,669 149,003 128,771 113,669 EU 5b Of which: Corporates - Specialised lending 8,872 24,234 17,109 32,471 32,471 EU 5c Of which: Corporates - Purchased receivables - - - - - 6 Retail 27,440 76,904 33,450 82,914 82,914 6.1 Of which: Retail - Qualifying revolving 3,401 6,323 3,401 6,323 6,323 EU 6.1a Of which: Retail - Purchased receivables - - - - - EU 6.1b Of which: Retail - Other 23,846 70,581 23,846 70,581 70,581 6.2 Of which: Retail - Secured by residential real estate 32,120 88,649 32,120 88,649 88,649 EU 7a Of which: Retail - Categorised as secured by mortgages on immovable properties and ADC exposures in SA 47,656 118,700 82,359 190,650 153,403 EU 7b Collective investment undertakings (CIU) 79 83 8,825 8,830 8,829 EU 7c Categorised as exposures in default in SA 10,086 11,268 15,561 16,743 16,743 EU 7d Categorised as subordinated debt exposures in SA - 812 - 812 812 EU 7e Categorised as covered bonds in SA 197 316 276 394 394 EU 7f Categorised as claims on institutions and corporates with a short-term credit assessment in SA - 3,858 485 4,343 4,343 8 Others - - 17,272 17,272 17,272 9 Total 198,740 366,014 374,143 593,767 541,418 -
4.5 Management of Group capital adequacy
The methods used by Groupe BPCE to calculate risk-weighted assets are described in Section 4.4 “Regulatory capital requirements and risk-weighted assets”.
in millions of euros 12/31/2025
Basel IV12/31/2024
Basel IIICommon Equity Tier-1 (CET1) capital 76,310 73,847 Additional Tier-1 (AT1) capital 0 0 TOTAL TIER-1 (T1) CAPITAL 76,310 73,847 Tier-2 (T2) capital 12,447 12,210 TOTAL REGULATORY CAPITAL 88,757 86,057 Credit risk exposure 390,554 397,526 Settlement/delivery risk exposure 17 0 CVA risk exposure 4,145 1,652 Market risk exposure 17,517 15,200 Operational risk exposure 50,821 42,212 TOTAL RISK EXPOSURE 463,054 456,591 Capital adequacy ratios Common Equity Tier-1 ratio 16.5% 16.2% Tier-1 ratio 16.5% 16.2% Total capital adequacy ratio 19.2% 18.8% The Common Equity Tier-1 ratio was 16.5% on December 31, 2025 compared to 16.2% on December 31, 2024.
The 31 basis point change in the Common Equity Tier-1 ratio in 2025 was mainly due to the growth in Common Equity Tier 1, driven by retained earnings (+73 basis points), which offset the impact of the year's acquisitions: Société Générale Equipment Solutions and Nagelmakers (-41 basis points).
At December 31, 2025, the Tier-1 ratio stood at 16.5% and the total capital ratio at 19.2% compared to 16.2% and 18.8%, respectively, at December 31, 2024. These ratio levels remain well above the regulatory requirements defined by the European Central Bank (ECB) during the Supervisory Review and Evaluation Process (SREP) in 2025.
Capital and total loss absorbing capacity (TLAC) targets are determined according to Groupe BPCE’s target ratings, in line with prudential constraints.
Capital adequacy management is therefore subject to a high management buffer which not only greatly exceeds prudential constraints on capital adequacy ratios, but is also well above the trigger for the Maximum Distributable Amount.
Thus, the management of own capital and loss absorbing capacity goes beyond the integration of prudential developments (e.g. qualification as a G-SIB) and leads the Group to build its total loss absorbing capacity mainly from CET1 and additionally from subordinated MREL-eligible and TLAC-eligible debt (mainly Tier-2 capital and eligible senior non-preferred debt). The issues of these eligible debts are carried out by BPCE.
Lastly, in addition to this capacity to absorb losses, Groupe BPCE has an MREL. The MREL capacity consists of instruments eligible for loss absorption, as well as senior preferred debt with residual maturity of more than one year.
The Group’s current MREL requirement was received in March 2024 by the Autorité de contrôle prudentiel et de résolution (ACPR), the French prudential supervisory authority for the banking and insurance sector. It amounts to 27.30% of the Group’s risk-weighted assets (RWA) and is respected with a margin. It does not require the Group to modify or increase its issuance program.
Groupe BPCE complies with Articles 92a (1)(a) and 494 of Regulation (EU) 575/2013 (CRR) providing since 2022 for a requirement of 18% of RWA plus solvency buffers, i.e. 22.4% of RWA. The subordination requirement in the leverage base has been set at 6.75% since 2022 pursuant to Article 92a (1)(b) of the CRR. This is also respected with a margin.
The Group implemented action plans from 2024 aimed specifically at ensuring the capital adequacy of its networks and its subsidiaries. BPCE SA thus subscribed for €475 million to a Tier 1 issue by Natixis, replacing a Tier 1 issue of $500 million repaid by the subsidiary. BPCE SA also set up a repayable Tier 2 subordinated loan of €60 million for the benefit of its subsidiary Banque Palatine and a second loan of €100 million granted to Natixis.
The entry into force of the Capital Requirements Regulation, known as CRR3, makes the leverage ratio a binding requirement as from June 28, 2021. The minimum requirement for this ratio is 3%, plus a buffer for global systemic banks of 0.5% in 2025.
The leverage ratio is not sensitive to risk factors and as such, it is considered as a measure that complements the solvency and liquidity management system, which already limits the size of the balance sheet. The leverage ratio is projected and managed at the same time as Groupe BPCE’s solvency trajectory. The risk of excessive leverage is also measured in the internal stress test via the projection of the regulatory leverage ratio.
Groupe BPCE’s leverage ratio, calculated according to the capital requirements regulation, known as CRR3, was 5.1% at December 31, 2025, based on phased-in Tier-1 capital.
12/31/2025 12/31/2024 a a in millions of euros Applicable amount Applicable amount 1 Total assets as per published financial statements 1,645,733 1,584,558 2 Adjustment for entities which are consolidated for accounting purposes but are outside the scope of prudential consolidation (136,694) (123,317) 3 (Adjustment for securitised exposures that meet the operational requirements for the recognition of risk transference) - - 4 (Adjustment for temporary exemption of exposures to central banks (if applicable)) - - 5 (Adjustment for fiduciary assets recognised on the balance sheet pursuant to the applicable accounting framework but excluded from the total exposure measure in accordance with point (i) of Article 429a(1) CRR) - - 6 Adjustment for regular-way purchases and sales of financial assets subject to trade date accounting - - 7 Adjustment for eligible cash pooling transactions - - 8 Adjustment for derivative financial instruments (5,628) (18,996) 9 Adjustment for securities financing transactions (SFTs) 8,866 8,396 10 Adjustment for off-balance sheet items (i.e. conversion to credit equivalent amounts of off-balance sheet exposures) 103,181 99,730 11 (Adjustment for prudent valuation adjustments and specific and general provisions which have reduced Tier 1 capital) - - EU-11a (Adjustment for exposures excluded from the total exposure measure in accordance with point (c) and point (ca) of Article 429a(1) CRR) (3,000) (4,028) EU-11b (Adjustment for exposures excluded from the total exposure measure in accordance with point (j) of Article 429a(1) CRR) (105,930) (103,067) 12 Other adjustments (17,190) (7,430) 13 Total exposure measure 1,489,339 1,435,845 As an institution exercising banking and insurance activities, Groupe BPCE is also required to comply with a financial conglomerate ratio. This ratio is determined by comparing the financial conglomerate’s total capital against all the regulatory capital requirements for its banking and insurance activities.
The financial conglomerate ratio demonstrates that the institution’s prudential capital sufficiently covers the total regulatory capital requirements for its banking activities (in accordance with CRR3) and insurance sector activities, in accordance with the Solvency 2 regulation.
The calculation of surplus capital is based on the statutory scope. Insurance company capital requirements, determined for the banking capital adequacy ratio by weighting the equity-method value, are replaced with capital requirements based on the solvency margin. The capital requirements within the banking scope are determined by multiplying the risk-weighted assets by the applicable rate under Pillar II, i.e. 15.90% at December 31, 2025 compared to 15.75% at December 31, 2024.
As the supervisory authority under Pillar II, the ECB conducts an annual assessment of banking institutions. This assessment, referred to as the Supervisory Review and Evaluation Process (SREP), is primarily based on:
- an evaluation based on information taken from prudential reports;
- documentation established by each banking institution, including in particular the Internal Capital Adequacy Assessment Process (ICAAP) and the Internal Liquidity Adequacy Assessment Process (ILAAP);
- an assessment of governance & risks, the business model, share capital and liquidity.
Based on the conclusions of the SREP carried out by the ECB in 2024, Groupe BPCE shall maintain a consolidated Common Equity Tier-1 ratio of 10.59% on January 2, 2025, including:
- 1.69% in respect of Pillar II requirements (excluding Pillar II guidance);
- 2.50% in respect of the capital conservation buffer;
- 1.00% in respect of the buffer for global systemically important banks (G-SIB buffer);
- 0.90% in respect of the countercyclical buffer.
With a Common Equity Tier-1 ratio of 16.5% at the end of December 2025, Groupe BPCE has exceeded the specific capital requirements set by the ECB.
As regards the internal capital adequacy assessment under Pillar II, the principles defined in the ICAAP/ILAAP guidelines published by the ECB in February 2018 and supplemented by the ECB publication in February 2025, were applied in Groupe BPCE’s ICAAP. The assessment is thus carried out using two different approaches:
- a “normative” approach aimed at measuring the impact of internal stress tests within three years of the initial Pillar I regulatory position;
- an “economic” approach aimed at identifying, quantifying and hedging risks using internal capital over the short term (one year) and using internal methodologies. The methodologies developed by Groupe BPCE provide a better assessment of risks that are already covered under Pillar I, and also an additional assessment of risks that are not covered by Pillar I.
The results obtained using these two approaches confirmed the Group’s financial soundness and no capital buffer is necessary in addition to the existing regulatory buffers.
The objectives of the “VISION 2030” strategic plan are, with regard to the Common Equity Tier-1 ratio, to exceed 15.5%, and with regard to the subordinated MREL ratio (i.e. TLAC) to exceed 25.5%.
The Group remained on the list of G-SIBs (Global Systemically Important Banks) in November 2023, with a systemic buffer to be respected on the MREL and TLAC ratios of 1%.
In addition to capital adequacy ratios, ratios aiming at verifying the Group’s capacity to carry out a bail-in in the event of default are implemented via the Minimum Requirement for own funds and Eligible Liabilities (MREL) and Total Loss Absorbing Capacity. This second ratio is known as TLAC, according to the terminology of the Financial Stability Board, and in Europe it is defined in the BRRD directive and the CRR regulation as subordinated MREL. Groupe BPCE has established internal monitoring of these indicators.
The senior unsecured debt at more than one year and the Group’s regulatory capital make up the numerator of the total MREL (minimum requirement for own funds and eligible liabilities) ratio. The Group’s current MREL requirement was notified in May 2025 by the ACPR.
For subordinated MREL, the numerator - in addition to the Group’s regulatory capital - only includes the junior liabilities up to the senior non-preferred debt because BPCE has renounced for the time being to use a senior preferred debt allowance, its updated requirement was set at 24.7% of the Group’s risk-weighted assets. The subordinated MREL ratio was 26.7% at December 31, 2025, stable compared to December 31, 2024.
-
4.6 Detailed quantitative information
The detailed quantitative information relating to capital management and capital requirements in the following tables enhances the information in the previous section under Pillar III.
12/31/2025 a b c d e f g Prudential consolidation method (1) Accounting
consolidation
methodFull
consolidationProportionate
consolidationEquity method Not
consolidated
Not deductedDeducted Description of the entity I) CONSOLIDATING ENTITY I-1 Banques Populaires BANQUE POPULAIRE ALSACE LORRAINE CHAMPAGNE FC X Credit institution BANQUE POPULAIRE ALSACE LORRAINE CHAMPAGNE, LUXEMBOURG BRANCH FC X Credit institution BANQUE POPULAIRE AQUITAINE CENTRE ATLANTIQUE FC X Credit institution BANQUE POPULAIRE AUVERGNE RHÔNE ALPES FC X Credit institution BANQUE POPULAIRE BOURGOGNE FRANCHE-COMTÉ FC X Credit institution BANQUE POPULAIRE DU NORD FC X Credit institution BANQUE POPULAIRE DU SUD FC X Credit institution BANQUE POPULAIRE GRAND OUEST FC X Credit institution BANQUE POPULAIRE MÉDITERRANÉE FC X Credit institution BANQUE POPULAIRE MÉDITERRANÉE, MONACO BRANCH FC X Credit institution BANQUE POPULAIRE OCCITANE FC X Credit institution BANQUE POPULAIRE RIVES DE PARIS FC X Credit institution BANQUE POPULAIRE VAL DE FRANCE FC X Credit institution BRED – BANQUE POPULAIRE FC X Credit institution CASDEN – BANQUE POPULAIRE FC X Credit institution CRÉDIT COOPÉRATIF FC X Credit institution I-2 Caisses d’Epargne CAISSE D’EPARGNE AQUITAINE POITOU-CHARENTES FC X Credit institution CAISSE D’EPARGNE BRETAGNE PAYS DE LOIRE FC X Credit institution CAISSE D’EPARGNE CÔTE D’AZUR FC X Credit institution CAISSE D’EPARGNE CÔTE D’AZUR, MONACO BRANCH FC X Credit institution CAISSE D’EPARGNE D’AUVERGNE ET DU LIMOUSIN FC X Credit institution CAISSE D’EPARGNE DE BOURGOGNE FRANCHE-COMTÉ FC X Credit institution CAISSE D’EPARGNE DE MIDI-PYRÉNÉES FC X Credit institution CAISSE D’EPARGNE HAUTS DE FRANCE FC X Credit institution CAISSE D’EPARGNE HAUTS DE FRANCE, BELGIUM BRANCH FC X Credit institution CAISSE D’EPARGNE HAUTS DE FRANCE, DUTCH BRANCH FC X Credit institution CAISSE D’EPARGNE ILE-DE-FRANCE FC X Credit institution CAISSE D’EPARGNE LANGUEDOC-ROUSSILLON FC X Credit institution CAISSE D’EPARGNE LOIRE-CENTRE FC X Credit institution CAISSE D’EPARGNE LOIRE DRÔME ARDÈCHE FC X Credit institution CAISSE D’EPARGNE GRAND EST EUROPE FC X Credit institution CAISSE D’EPARGNE NORMANDIE FC X Credit institution CAISSE D’EPARGNE PROVENCE-ALPES-CORSE FC X Credit institution CAISSE D’EPARGNE RHÔNE ALPES FC X Credit institution I-3 BPCE SA BPCE SA FC X Credit institution I-4 Mutual Guarantee Companies 29 MUTUAL GUARANTEE COMPANIES FC X Guarantee companies II) “AFFILIATED” INSTITUTIONS CMGM NI X Financial company GEDEX DISTRIBUTION NI X Financial company SOCOREC NI X Financial company SOFISCOP SUD EST NI X Financial company SOMUDIMEC NI X Financial company EDEL EQ X Credit institution III) SUBSIDIARIES, JOINT VENTURES AND ASSOCIATES III-1 - Subsidiaries of the Banques Populaires ACLEDA EQ X Credit institution ADAXTRA CAPITAL FC X Private equity BANQUE CALÉDONIENNE D’INVESTISSEMENT EQ X Credit institution BANQUE DE SAVOIE FC X Credit institution BANQUE DE TRANSITION ÉNERGETIQUE FC X Financial investment
advisory servicesBANQUE FRANCO LAO FC X Credit institution Bay Dvpt Ltd FC X Real estate operations BCEL EQ X Credit institution BCI MER ROUGE FC X Credit institution BIC BRED FC X Credit institution BIC BRED (Suisse) SA FC X Credit institution BP DÉVELOPPEMENT FC X Private equity FPCI BP DEVELOPPEMENT FC X Private equity BPD FINANCEMENT FC X Private equity BPA ATOUTS PARTICIPATIONS FC X Private equity BRED BANK CAMBODIA PLC FC X Credit institution BRED BANK FIJI LTD FC X Credit institution BRED COFILEASE FC X Equipment leasing BRED GESTION FC X Credit institution BRED IT FC X IT services BRED MADAGASIKARA BANQUE POPULAIRE FC X Credit institution BRED SOLOMON ISLANDS FC X Credit institution BRED VANUATU FC X Credit institution BTP BANQUE FC X Credit institution BTP CAPITAL INVESTISSEMENT EQ X Private equity CADEC EQ X Private equity COFEG FC X Consulting COFIBRED FC X Holding COOPMED EQ X Private equity CREPONORD FC X Equipment and real estate leasing ECOFI INVESTISSEMENT FC X Portfolio management EPBF FC X Credit institution ESFIN EQ X Private equity ESFIN GESTION FC X Portfolio management EURO CAPITAL FC X Private equity FCC ELIDE FC X French securitization fund (FCT) FINANCIÈRE IMMOBILIÈRE DERUELLE FC X Real estate investment FONCIÈRE BFCA FC X Real estate development/ management, real estate investment FONCIÈRE DU VANUATU FC X Real estate investment FONCIERE HEROUVILLE SAS FC X Rental of land and other real estate FONCIÈRE VICTOR HUGO FC X Real estate operations FRP II SAS FC X Rental of land and other real estate FRP V SAS FC X Rental of land and other real estate FRP VI SAS FC X Rental of land and other real estate FRP VII SAS FC X Rental of land and other real estate GARIBALDI CAPITAL DÉVELOPPEMENT FC X Private equity GESSINORD FC X Real estate operations BP NORD DÉVELOPPEMENT FC X Portfolio management GROUPEMENT DE FAIT FC X Services company I-BP INVESTISSEMENT FC X Real estate operations IMMOCARSO SNC FC X Investment property INGEPAR FC X Financial investment advisory services IRR INVEST FC X Private equity Maison Bleue BP Nord FC X Rental of land and other real estate MULTICROISSANCE SAS FC X Portfolio management NAXICAP RENDEMENT 2018 FC X Private equity NAXICAP RENDEMENT 2022 FC X Private equity NAXICAP RENDEMENT 2024 FC X Private equity NJR INVEST FC X Private equity ORAMA MASTER FCT FC X French securitization fund (FCT) OUEST CROISSANCE SCR FC X Private equity PARNASSE GARANTIES EQ X Insurance PERSPECTIVES ENTREPRISES FC X Holding PLUSEXPANSION FC X Services company PRÉPAR COURTAGE FC X Brokerage PRÉPAR-IARD FC X Non-life insurance PRÉPAR-VIE FC X Life insurance and endowment PROMEPAR FC X Portfolio management RIVES CROISSANCE FC X Investment company SAS BP IMMO NOUVELLE AQUITAINE FC X Investment real estate SAS GARIBALDI PARTICIPATIONS FC X Risk capital company SAS SOCIÉTÉ IMMOBILIÈRE DE LA RÉGION RHÔNE ALPES FC X Real estate company SAS SUD CROISSANCE FC X Private equity SAS TASTA FC X Services company SASU BFC CROISSANCE FC X Private equity SCI BP SAVOISIENNE FC X Real estate company SBE FC X Credit institution SCI BPSO BASTIDE FC X Real estate operations SCI BPSO MÉRIGNAC 4 CHEMINS FC X Real estate operations SCI BPSO TALENCE FC X Real estate operations SCI CREDIMAR IMMOBILIER FC X Real estate operations SCI DU CRÉDIT COOPÉRATIF DE SAINT-DENIS FC X Real estate operations SCI FAIDHERBE FC X Real estate operations SCI HEROUVILLE 14 FC X Rental of land and other real estate SCI POLARIS FC X Real estate operations SCI PYTHÉAS PRADO 1 FC X Real estate operations SCI PYTHÉAS PRADO 2 FC X Real estate operations SCI SAINT-DENIS FC X Real estate operations SI ÉQUINOXE FC X Real estate operations SIPMÉA FC X Real estate development/ management, real estate investment SOCIÉTÉ CENTRALE DU CRÉDIT MARITIME MUTUEL FC X Services company SOCIÉTÉ D’EXPANSION BOURGOGNE FRANCHE-COMTÉ FC X Private equity SOCIÉTÉ IMMOBILIÈRE PROVENÇALE ET CORSE FC X Real estate operations SOCREDO EQ X Credit institution SOFIAG FC X Financial company SOFIDER FC X Financial company SPIG FC X Property leasing SUD PARTICIPATIONS IMMOBILIÈRES FC X Real estate agent activities TRANSIMMO FC X Real estate agent UNION DES SOCIÉTÉS DU CRÉDIT COOPÉRATIF (EIG) FC X Services company VAL DE FRANCE IMMO FC X Investments in real estate developments VAL DE FRANCE TRANSACTIONS FC X Services company III-2 - Subsidiaries of the Caisses d’Epargne SCI 339 ETATS UNIS FC X Real estate excl. operations 4 CHENE GERMAIN EQ X Real estate operations SCI ADOUR SERVICES COMMUNS FC X Real estate excl. operations SCI L APOUTICAYRE LOGEMENT FC X Real estate excl. operations BANQUE BCP SAS FC X Credit institution BANQUE DE NOUVELLE-CALÉDONIE FC X Credit institution BANQUE DE TAHITI FC X Credit institution BANQUE DU LÉMAN FC X Credit institution BANQUE NAGELMACKERS FC X Credit institution B-Arena NV FC X French securitization fund (FCT) BATIMAP FC X Real estate leasing BATIMUR FC X Equipment leasing BATIROC BRETAGNE PAYS DE LOIRE FC X Equipment and real estate leasing BDR IMMO 1 FC X Rental of land and other real estate property BEAULIEU IMMO FC X Real estate operations SCI BLEU RESIDENCE LORMONT FC X Real estate excl. operations CAPITOLE FINANCE FC X Equipment leasing CE CAPITAL FC X Private equity CE DÉVELOPPEMENT III FC X Private equity CEBIM FC X Real estate agent CEPAC FONCIÈRE FC X Real estate and investment property operations CEPAC INVESTISSEMENT ET DÉVELOPPEMENT FC X Private equity CEPRAL FC X Investments in real estate developments CHENE GERMAIN PARTICIPATIONS FC X Fund management COZYNERGY HOLDING FC X Fund management COZYNERGY SAS FC X Engineering and technical studies ENR-CE FC X French securitization fund (FCT) FERIA PAULMY FC X Real estate excl. operations FONCEA FC X Rental of land and other real estate property GIE CE SYNDICATION RISQUES FC X Guarantee company HABITAT EN RÉGION SERVICES FC X Holding IMMOCEAL FC X Investment property IMMOBILIERE THOYNARD IDF FC X Investment property SA CEPAIM FC X Real estate excl. operations SCI EUROTERTIA IMMO FC X Real estate excl. operations SCI G IMMO FC X Real estate excl. operations SCI G 102 FC X Real estate excl. operations SCI JEAN JAURES 24 FC X Real estate excl. operations SCI LABEGE LAKE H1 FC X Real estate excl. operations SCI LANGLADE SERVICES COMMUNS FC X Real estate excl. operations SCI LEVISEO FC X Real estate excl. operations SCI MIDI – COMMERCES FC X Real estate excl. operations MIDI FONCIERE FC X Real estate excl. operations SCI MIDI MIXT FC X Real estate excl. operations SCI MONTAUDRAN PLS FC X Real estate excl. operations SCI MURET ACTIVITES FC X Real estate excl. operations SCI ROISSY COLONNADIA FC X Real estate excl. operations S.A.S 42 DERUELLE FC X Investment property SAS FONCIÈRE DES CAISSES D’EPARGNE FC X Investment property SAS FONCIÈRE ECUREUIL II FC X Investment property SAS LOIRE CENTRE IMMO FC X Real estate investment SAS NSAVADE FC X Real estate operations SC RESIDENCE LES AILES D’ICARE EQ X Real estate excl. operations SC RESIDENCE LE CARRE DES PIONNIERS EQ X Real estate excl. operations SC RESIDENCE ILOT J EQ X Real estate excl. operations SC RESIDENCE LATECOERE EQ X Real estate excl. operations SC RESIDENCE JEAN MERMOZ EQ X Real estate excl. operations SC RESIDENCE SAINT EXUPERY EQ X Real estate excl. operations SCI AVENUE WILLY BRANDT FC X Investment property SCI DANS LA VILLE FC X Investment property SCI FONCIÈRE 1 FC X Investment property SCI GARIBALDI OFFICE FC X Real estate operations SCI LA FAYETTE BUREAUX FC X Investment property SCI LE CIEL FC X Real estate operations SCI LE RELAIS FC X Real estate operations SCI LOIRE CENTRE MONTESPAN FC X Real estate operations SCI SHAKE HDF FC X Real estate operations SCI TOURNON FC X Real estate operations SNC ECUREUIL 5 RUE MASSERAN FC X Investment property SOCIÉTÉ HAVRAISE CALÉDONIENNE FC X Real estate operations SODERO PARTICIPATIONS FC X Private equity SPPICAV AEW FONCIÈRE ECUREUIL FC X Real estate operations SRL MONTECO FC X Real estate operations SCI TETRIS FC X Non-operating real estate UNIMO NV FC X Real estate company URBAN CLAY TLS FC X Non-operating real estate III-3 - Subsidiaries of BPCE ALBIANT-IT FC X IT systems and software consulting AVAL FCT FC X French securitization fund (FCT) BANCO PRIMUS FC X Credit institution BANCO PRIMUS Spain FC X Credit institution BATILEASE FC X Real estate leasing BPCE ACHATS SERVICES FC X Services company BPCE BAIL FC X Real estate leasing BPCE CAR LEASE FC X Long-term vehicle leasing BPCE DEMETER FC X French securitization fund (FCT) BPCE DEMETER 4 FCT FC X French securitization fund (FCT) BPCE DEMETER DUO FCT FC X French securitization fund (FCT) BPCE DEMETER PANTA FCT FC X French securitization fund (FCT) BPCE DEMETER TRIA FCT FC X French securitization fund (FCT) BPCE ENERGECO FC X Equipment and real estate leasing BPCE EOLIOS FCT FC X French securitization fund (FCT) BPCE EQUIPEMENT SOLUTION SA FC X Holding company activity BPCE EQUIPMENT FINANCE HUNGARY PLC FC X Leasing BPCE EQUIPMENT FINANCE ITALIA SPA FC X Leasing BPCE EQUIPMENT SOLUTIONS BENELUX BV FC X Leasing BPCE EQUIPMENT SOLUTIONS BENELUX BV - BELGIUM BRANCH FC X Leasing BPCE EQUIPMENT SOLUTIONS BRASIL SA FC X Leasing BPCE EQUIPMENT SOLUTIONS CHINA CO. LTD FC X Leasing BPCE EQUIPMENT SOLUTIONS IBERIA E.F.C., SA FC X Leasing BPCE EQUIPMENT SOLUTIONS ITALIA SPA FC X Leasing BPCE EQUIPMENT SOLUTIONS POLSKA SP ZOO FC X Leasing BPCE EQUIPMENT SOLUTIONS SCHWEIZ AG FC X Leasing BPCE EQUIPMENT SOLUTIONS UK (DECEMBER) LIMITED FC X Leasing BPCE EQUIPMENT SOLUTIONS UK LTD FC X Leasing BPCE EQUIPMENT SOLUTIONS USA CORP FC X Leasing BPCE EXPERTISES IMMOBILIÈRES (FORMERLY CRÉDIT FONCIER EXPERTISE) FC X Real estate valuation BPCE FACTOR FC X Factoring BPCE FINANCEMENT FC X Consumer credit BPCE GERMANY HOLDING GMBH FC X Holding company activities BPCE INFOGÉRANCE ET TECHNOLOGIE FC X IT services BPCE LEASE FC X Equipment leasing BPCE LEASE IMMO FC X Real estate leasing BPCE LEASE, MADRID BRANCH FC X Equipment and real estate leasing BPCE LEASE, MILAN BRANCH FC X Equipment and real estate leasing BPCE LEASE NOUMÉA FC X Equipment leasing BPCE LEASE RÉUNION FC X Equipment leasing BPCE LEASE TAHITI FC X Equipment leasing FCT HOME LOANS FC X French securitization fund (FCT) FCT CONSUMER LOANS FC X French securitization fund (FCT) FCT MASTER HOME LOANS FC X French securitization fund (FCT) BPCE PERSONAL CAR LEASE FC X Long-term vehicle leasing BPCE SERVICES FINANCIERS (FORMERLY CSF-GCE) FC X Services company BPCE SFH FC X Refinancing BPCE SME FCT (MERCURE) FC X French securitization fund (FCT) BPCE SOLUTIONS CLIENTS FC X Services company BPCE SOLUTIONS INFORMATIQUES FC X IT systems and software consulting BPCE SOLUTIONS IMMOBILIÈRES (FORMERLY CRÉDIT FONCIER IMMOBILIER) FC X Real estate operations CAPITOLE MASTER FCT FC X French securitization fund (FCT) CICOBAIL SA FC X Real estate leasing CO ASSUR CONSEIL ASSURANCE SA (BROKERAGE) FC X Insurance brokerage advisory COMPAGNIE EUROPÉENNE DE GARANTIES ET CAUTIONS FC X Insurance EUROLOCATIQUE FC X Vendor and leasing activities FCT PUMACC FC X French securitization fund (FCT) FG Management GmbH FC X Financial institution FONDS DE GARANTIE ET DE SOLIDARITE BPCE – FONDS DELESSERT FC X Mutual guarantee fund FRAER LEASING - SPA FC X Leasing GAIA MASTER CONSUMER LOANS FCT FC X French securitization fund (FCT) GCE PARTICIPATIONS FC X Holding GEFA BANK GMBH FC X Credit Institution GEFA VERSICHERUNGSDIENST GMBH EQ X Activities of insurance agents and brokers INTER-COOP SA FC X Real estate leasing LEASE EXPANSION SA FC X IT operational leasing MAISON FRANCE CONFORT PROU INVESTISSEMENTS EQ X Real estate development MEDIDAN FC X Other service activities MIDT FACTORING A/S FC X Factoring OLYMPIA MASTER HOME LOANS FC X French securitization fund (FCT) OPHELIA MASTER SME FC X French securitization fund (FCT) PHILIPS MEDICAL CAPITAL FRANCE FC X Leasing PHILIPS MEDICAL CAPITAL GMBH FC X Leasing PORTDALON FC X French securitization fund (FCT) PRAMEX INTERNATIONAL FC X International development and consulting services PRAMEX INTERNATIONAL AP LTD – HONG KONG FC X International development and consulting services PRAMEX INTERNATIONAL AU CASABLANCA FC X International development and consulting services PRAMEX INTERNATIONAL CO LTD – SHANGHAI FC X International development and consulting services PRAMEX INTERNATIONAL CONSULTING PRIVATE LTD – MUMBAI FC X International development and consulting services PRAMEX INTERNATIONAL CORP – NEW YORK FC X International development and consulting services PRAMEX INTERNATIONAL DO BRAZIL CONSULTARIA LTDA – SAO PAULO FC X International development and consulting services PRAMEX INTERNATIONAL GMBH – FRANKFURT FC X International development and consulting services PRAMEX INTERNATIONAL LTD – LONDON FC X International development and consulting services PRAMEX INTERNATIONAL PTE LTD – SINGAPORE FC X International development and consulting services PRAMEX INTERNATIONAL SRL – MILAN FC X International development and consulting services PRAMEX INTERNATIONAL SA – MADRID FC X International development and consulting services PRAMEX INTERNATIONAL SARL – TUNIS FC X International development and consulting services PRAMEX INTERNATIONAL SP.ZOO – WARSAW FC X International development and consulting services SOCFIM FC X Credit institution SOCFIM INVESTISSEMENTS FC X Activities of real estate dealers SOCFIM PARTICIPATIONS IMMOBILIÈRES FC X Holding SOCRAM BANQUE EQ X Credit institution SPORTS & IMAGINE FC X Services company SUD-OUEST BAIL FC X Real estate leasing SURASSUR FC X Reinsurance ONEY group ONEY BANK SA FC X Credit institution ONEY SERVICIOS FINANCIEROS EFC SAU FC X Financial institution BA FINANS FC X Brokerage GEFIRUS SAS FC X Holding IN CONFIDENCE INSURANCE SAS FC X Insurance agent ONEY HOLDING LIMITED FC X Holding ONEY LIFE (PCC) LIMITED FC X Insurance ONEY INSURANCE (PCC) LIMITED FC X Insurance ONEY SERVICES SP ZOO FC X Services provider ONEY FINANCES SRL FC X Brokerage ONEY BANK SA - Portugal BRANCH FC X Credit institution ONEYTRUST SAS FC X New Technologies ONEY UKRAINE FC X Brokerage SMARTNEY GRUPA ONEY FC X Financial intermediary, financial institution Groupe BPCE International BPCE INTERNATIONAL FC X Specialized credit institution BPCE INTERNATIONAL HO CHI MINH CITY, VIETNAM BRANCH FC X Specialized credit institution BPCE MAROC FC X Holding FRANSA BANK EQ X Credit institution Crédit Foncier group CFG COMPTOIR FINANCIER DE GARANTIE FC X Financial company COFIMAB FC X Real estate agent COMPAGNIE DE FINANCEMENT FONCIER FC X Financial company CRÉDIT FONCIER DE FRANCE FC X Credit institution CRÉDIT FONCIER DE FRANCE, BELGIUM BRANCH FC X Credit institution Banque Palatine group BANQUE PALATINE FC X Credit institution CONSERVATEUR FINANCE EQ X Fund management PALATINE ASSET MANAGEMENT FC X Asset Management Global Financial Services division 1818 IMMOBILIER FC X Real estate operations AEW – DUTCH BRANCH FC X Real estate management AEW (FORMERLY AEW CILOGER) FC X Real estate management AEW APREF GP SARL FC X Asset Management AEW APREF INVESTORS, LP FC X Asset Management AEW ASIA LIMITED FC X Asset Management AEW ASIA PTE LTD FC X Asset Management AEW AUSTRALIA PTY LTD FC X Asset Management AEW CAPITAL MANAGEMENT, INC. FC X Asset Management AEW CAPITAL MANAGEMENT, LP FC X Asset Management AEW CENTRAL EUROPE FC X Asset Management AEW CENTRAL EUROPE CZECH FC X Dividend payments AEW COLD OPS MM, LLC FC X Asset Management AEW EHF GP, LLC FC X Asset Management AEW EHF LUX GP SARL FC X Real estate management AEW EUROPEAN PROPERTY SECURITIES ABSOLUTE RETURN GP, LLC FC X Real estate management AEW EUROPE GLOBAL LUX FC X Asset Management AEW EUROPE HOLDING LTD FC X Asset Management AEW EUROPE INVESTMENT LTD FC X Asset Management AEW EUROPE LLP FC X Asset Management AEW EUROPE LLP, SPAIN BRANCH FC X Dividend payments AEW EUROPE SA (FORMERLY AEW SA) FC X Asset Management AEW EUROPE SARL FC X Asset Management AEW EVP GP LLP FC X Asset Management AEW GLOBAL ADVISORS (EUROPE) LTD FC X Asset Management AEW GLOBAL INVESTMENT FUND GP, LLC FC X Real estate management AEW GLOBAL LTD FC X Asset Management AEW GLOBAL PROPERTY GP, LLC FC X Real estate management AEW GLOBAL UK LTD FC X Asset Management AEW INVEST GMBH FC X Dividend payments AEW ITALIAN BRANCH (FORMERLY AEW CILOGER ITALIAN BRANCH) FC X Dividend payments AEW JAPAN CORPORATION FC X Asset Management AEW KOREA LLC FC X Asset Management AEW PARTNERS REAL ESTATE FUND IX, LLC FC X Asset Management AEW PARTNERS REAL ESTATE FUND VIII, LLC FC X Asset Management AEW PARTNERS V, INC. FC X Asset Management AEW PARTNERS VI, INC. FC X Asset Management AEW PARTNERS VII, INC. FC X Asset Management AEW PARTNERS X GP, LLC FC X Asset Management AEW PRIVATE DEBT HONG KONG LIMITED (FORMERLY NIMI HONG KONG LTD) FC X Asset Management AEW PROMOTE LP LTD FC X Asset Management AEW RED FUND GP, LLC FC X Real estate management AEW SENIOR HOUSING INVESTORS II INC. FC X Asset Management AEW SENIOR HOUSING INVESTORS III LLC FC X Asset Management AEW SENIOR HOUSING INVESTORS IV LLC FC X Asset Management AEW SHI V GP, LLC FC X Real estate management AEW TAPT GP, LLC FC X Real estate management AEW UK INVESTMENT MANAGEMENT LLP FC X Asset Management AEW UK INVESTMENT MANAGEMENT LLP, SPAIN BRANCH FC X Dividend payments AEW VALUE INVESTORS ASIA III GP LIMITED FC X Asset Management AEW VALUE INVESTORS USGP, LLC FC X Real estate management AEW VIA IV GP PARTNERS SARL FC X Asset Management AEW VIA V GP PARTNERS SARL FC X Asset Management ASAHI NATIXIS INVESTMENT MANAGERS CO.LTD EQ X Dividend payments AUDERE PARTNERS EQ X M&A advisory services AURORA INVESTMENT MANAGEMENT LLC FC X Asset Management AZURE CAPITAL HOLDINGS PTY LTD FC X M&A advisory services AZURE CAPITAL LIMITED FC X Holding BLEACHERS FINANCE FC X Securitization vehicle CAPRE (FORMERLY LOOMIS SAYLES CAPITAL RE)* FC X Asset Management CLIPPERTON HOLDING EQ X M&A advisory services CM REO HOLDINGS TRUST FC X Secondary markets finance CM REO TRUST FC X Secondary markets finance DARIUS CAPITAL CONSEIL FC X Financial investment advisory services DF EFG3 LIMITED FC X Holding DNCA FINANCE FC X Asset Management DNCA FINANCE, LUXEMBOURG BRANCH FC X Asset Management DNCA FINANCE, MILAN BRANCH FC X Asset Management DNCA FINANCE SUCURSAL EN ESPAÑA FC X Asset Management DNCA QUADRO FC X Asset Management DORVAL ASSET MANAGEMENT FC X Asset Management EDF INVESTMENT GROUP EQ X Investment company FENCHURCH ADVISORY PARTNERS LLP FC X M&A advisory services FENCHURCH ADVISORY PARTNERS US LP FC X M&A advisory services FENCHURCH PARTNERS LP FC X M&A advisory services FINANCIÈRE DE COURCELLES EQ X M&A advisory services FLEXSTONE PARTNERS LLC FC X Asset Management FLEXSTONE PARTNERS PTE LTD FC X Asset Management FLEXSTONE PARTNERS SARL FC X Asset Management FLEXSTONE PARTNERS SAS FC X Asset Management FLEXSTONE PRIVATE EQUITY OPPORTUNITIES FCPR FC X Asset Management GATEWAY INVESTMENT ADVISERS, LLC FC X Asset Management HARRIS ASSOCIATES LP FC X Asset Management HARRIS ASSOCIATES SECURITIES, LP FC X Dividend payments HARRIS ASSOCIATES, INC. FC X Asset Management INVESTIMA 77 FC X Holding INVESTORS MUTUAL LIMITED FC X Asset Management KENNEDY FINANCEMENT LUXEMBOURG FC X Investment company – Asset management KENNEDY FINANCEMENT LUXEMBOURG 2 FC X Central corporate treasury – Asset management LOOMIS SAYLES & COMPANY, INC. FC X Asset Management LOOMIS SAYLES & COMPANY, LP FC X Asset Management LOOMIS SAYLES (NETHERLANDS) BV FC X Dividend payments LOOMIS SAYLES (NETHERLANDS) BV, FRENCH BRANCH FC X Dividend payments LOOMIS SAYLES ALPHA LUXEMBOURG, LLC FC X Asset Management LOOMIS SAYLES ALPHA, LLC FC X Asset Management LOOMIS SAYLES DISTRIBUTORS, INC. FC X Dividend payments LOOMIS SAYLES DISTRIBUTORS, LP FC X Dividend payments LOOMIS SAYLES GLOBAL ALLOCATION FC X Asset Management LOOMIS SAYLES INVESTMENTS ASIA PTE LTD FC X Asset Management LOOMIS SAYLES INVESTMENTS LTD (UK) FC X Asset Management LOOMIS SAYLES SAKORUM LONG SHORT GROWTH EQUITY FC X Asset Management LOOMIS SAYLES TRUST COMPANY, LLC FC X Asset Management MASSENA CONSEIL SAS FC X Asset manager and investment advisory firm MASSENA PARTNERS – BRANCH FC X Asset manager and investment advisory firm MASSENA PARTNERS SA FC X Asset manager and investment advisory firm MASSENA WEALTH MANAGEMENT SARL FC X Asset manager and investment advisory firm MIROVA FC X Management of venture capital mutual funds MIROVA AFRICA INC FC X Private debt management company MIROVA KENYA LIMITED FC X Private debt management company MIROVA SWEDEN SUBSIDIARY FC X Asset Management Mirova UK Branch FC X Asset Management MIROVA UK LIMITED FC X Asset Management MIROVA US HOLDINGS LLC FC X Holding MIROVA US LLC FC X Asset Management MSR TRUST FC X Real estate finance NATIXIS ADVISORS LLC (FORMERLY NATIXIS ADVISORS, L.P.) FC X Dividend payments NATIXIS ALGÉRIE FC X Banking NATIXIS ALTERNATIVE HOLDING LIMITED FC X Holding NATIXIS ASIA LTD FC X Other financial company NATIXIS AUSTRALIA PTY LTD FC X Financial institution NATIXIS BEIJING FC X Financial institution NATIXIS BELGIQUE INVESTISSEMENTS FC X Investment company NATIXIS CANADA FC X Financial institution NATIXIS COFICINE FC X Finance company (audiovisual) NATIXIS CORPORATE AND INVESTMENT BANKING LUXEMBOURG FC X Issuing vehicle NATIXIS DISTRIBUTION, LLC (FORMERLY NATIXIS DISTRIBUTION, LP) FC X Dividend payments NATIXIS DUBAI FC X Financial institution NATIXIS FINANCIAL PRODUCTS LLC FC X Derivatives transactions NATIXIS FONCIERE SA FC X Real estate investment NATIXIS FUNDING CORP FC X Other financial company Natixis GIFT CITY BRANCH FC X Financial institution NATIXIS GLOBAL SERVICES (INDIA) PRIVATE LIMITED FC X Operational support NATIXIS HOLDINGS (HONG KONG) LIMITED FC X Holding NATIXIS HONG KONG FC X Financial institution NATIXIS IM INNOVATION FC X Asset Management NATIXIS IM KOREA LIMITED (NIMKL) FC X Dividend payments NATIXIS IM MEXICO, S DE RL DE CV FC X Asset Management NATIXIS IMMO DEVELOPPEMENT FC X Housing real estate development NATIXIS INTERÉPARGNE FC X Employee savings plan management NATIXIS INVESTMENT MANAGERS FC X Holding NATIXIS INVESTMENT MANAGERS AUSTRALIA PTY LIMITED FC X Dividend payments NATIXIS INVESTMENT MANAGERS HONG KONG LIMITED FC X Asset Management NATIXIS INVESTMENT MANAGERS INTERNATIONAL FC X Dividend payments NATIXIS INVESTMENT MANAGERS INTERNATIONAL, ITALY BRANCH FC X Dividend payments NATIXIS INVESTMENT MANAGERS INTERNATIONAL, BELGIAN BRANCH FC X Dividend payments NATIXIS INVESTMENT MANAGERS INTERNATIONAL, LLC FC X Dividend payments NATIXIS INVESTMENT MANAGERS INTERNATIONAL, LUXEMBOURG BRANCH FC X Dividend payments NATIXIS INVESTMENT MANAGERS INTERNATIONAL, NETHERLANDS FC X Dividend payments NATIXIS INVESTMENT MANAGERS INTERNATIONAL, SPAIN BRANCH FC X Dividend payments NATIXIS INVESTMENT MANAGERS INTERNATIONAL, ZWEIGNIEDERLASSUNG DEUTSCHLAND FC X Dividend payments NATIXIS INVESTMENT MANAGERS JAPAN CO, LTD FC X Asset Management NATIXIS INVESTMENT MANAGERS (FORMERLY NIMUSH) FC X Holding NATIXIS INVESTMENT MANAGERS MIDDLE EAST FC X Dividend payments NATIXIS INVESTMENT MANAGERS OPERATING SERVICES (FORMERLY NIM P6) FC X Holding NATIXIS INVESTMENT MANAGERS PARTICIPATIONS 1 FC X Holding NATIXIS INVESTMENT MANAGERS PARTICIPATIONS 3 FC X Holding NATIXIS INVESTMENT MANAGERS SECURITIES INVESTMENT CONSULTING CO.LTD FC X Asset Management NATIXIS INVESTMENT MANAGERS SINGAPORE LIMITED FC X Asset Management NATIXIS INVESTMENT MANAGERS SWITZERLAND SARL FC X Asset Management NATIXIS INVESTMENT MANAGERS UK LTD FC X Dividend payments NATIXIS INVESTMENT MANAGERS URUGUAY SA FC X Dividend payments NATIXIS JAPAN SECURITIES CO, LTD FC X Financial institution NATIXIS LABUAN FC X Financial institution NATIXIS LONDON FC X Financial institution NATIXIS MADRID FC X Financial institution NATIXIS MARCO FC X Investment company (extension of activity) NATIXIS MILAN FC X Financial institution NATIXIS NEW YORK FC X Financial institution NATIXIS NORTH AMERICA LLC FC X Holding NATIXIS PARTNERS FC X M&A advisory services NATIXIS PARTNERS IBERIA, SA FC X M&A advisory services NATIXIS PFANDBRIEFBANK AG FC X Credit institution NATIXIS PORTO FC X Financial institution NATIXIS PRIVATE EQUITY FC X Private equity NATIXIS REAL ESTATE CAPITAL LLC FC X Real estate finance NATIXIS REAL ESTATE FEEDER SARL FC X Issuing vehicle NATIXIS REAL ESTATE HOLDINGS LLC FC X Real estate finance NATIXIS SA FC X Credit institution NATIXIS SECURITIES AMERICAS LLC FC X Brokerage NATIXIS SEOUL FC X Financial institution NATIXIS SHANGHAI FC X Financial institution NATIXIS SINGAPORE FC X Financial institution NATIXIS STRUCTURED ISSUANCE FC X Issuing vehicle NATIXIS TAIWAN FC X Financial institution NATIXIS TOKYO FC X Financial institution NATIXIS TRADEX SOLUTIONS FC X Credit institution NATIXIS US MTN PROGRAM LLC FC X Issuing vehicle NATIXIS WEALTH MANAGEMENT FC X Credit institution NATIXIS ZWEIGNIEDERLASSUNG DEUTSCHLAND FC X Financial institution NAXICAP PARTNERS FC X Management of venture capital mutual funds NIM-OS TECHNOLOGIES INC. FC X Media and digital NIM-OS, LLC FC X Media and digital OSSIAM FC X Asset Management OSTRUM AM (NEW) FC X Asset Management OSTRUM AM US LLC FC X Asset Management PURPLE FINANCE CLO 1 FC X Securitization vehicle SAUDI ARABIA INVESTMENT COMPANY FC X Financial institution SEAPORT STRATEGIC PROPERTY PROGRAM I CO-INVESTORS, LLC FC X Asset Management SEVENTURE PARTNERS FC X Asset Management SOLOMON PARTNERS SECURITIES COMPANY LLC FC X Brokerage SOLOMON PARTNERS, LP FC X M&A advisory services SPG FC X Mutual fund TEORA FC X Insurance brokerage company THE AZURE CAPITAL TRUST FC X Holding THEMATICS ASSET MANAGEMENT FC X Asset Management VAUBAN INFRASTRUCTURE PARTNERS(2) FC X Asset Management VAUBAN INFRASTRUCTURE PARTNERS, GERMAN BRANCH FC X Asset Management VAUGHAN NELSON INVESTMENT MANAGEMENT, INC. FC X Asset Management VAUGHAN NELSON INVESTMENT MANAGEMENT, LP FC X Asset Management VEGA INVESTMENT SOLUTIONS (FORMERLY MANAGERS) FC X Asset Management VERMILION (BEIJING) ADVISORY COMPANY LIMITED FC X M&A advisory services VERMILION PARTNERS (HOLDINGS) LIMITED FC X Holding VERMILION PARTNERS (UK) LIMITED FC X Holding VERMILION PARTNERS LIMITED FC X Holding VERSAILLES FC X Securitization vehicle Insurance division ADIR EQ X Insurance Allocation Pilote Offensive FC X Insurance investment mutual fund ALLOCATION PILOTEE EQUILIBRE C FC X Insurance investment mutual fund BPCE ASSURANCES FC X Holding BPCE ASSURANCES IARD (FORMERLY BPCE ASSURANCES) FC X Property damage Insurance BPCE ASSURANCES PRODUCTION SERVICES FC X Service providers BPCE IARD (FORMERLY ASSURANCES BANQUE POPULAIRE IARD) EQ X Property damage Insurance BPCE LIFE FC X Life Insurance BPCE LIFE, FRANCE BRANCH FC X Life Insurance BPCE VIE FC X Life Insurance DNCA INVEST NORDEN FC X Insurance investment mutual fund ECUREUIL VIE DEVELOPPEMENT EQ X Brokerage FONDS VEGA EUROPE CONVICTIONS FC X Insurance investment mutual fund FRUCTIFONCIER FC X Insurance real estate investments MIROVA EUROPE ENVIRONNEMENT C FC X Insurance investment mutual fund MIROVA EUROPE SUSTAINABLE EQUITY FUND FC X Insurance investment mutual fund NA FC X Holding NAMI INVESTMENT FC X Insurance real estate investments NATIXIS ESG DYNAMIC FUND FC X Insurance investment mutual fund REAUMUR ACTIONS FC X Insurance investment mutual fund SCI DUO PARIS EQ X Real estate management SCPI ATLANTIQUE MUR RÉGIONS FC X Insurance investment mutual fund SCPI IMMOB EVOLUTIF FC X Insurance real estate investments SELECTIZ FC X Insurance investment mutual fund SELECTIZ PLUS FCP 4DEC FC X Insurance investment mutual fund THEMATICS Europe Selection FC X Insurance investment mutual fund THEMATICS META FUND FC X Insurance investment mutual fund VEGA COURT TERME DYNAMIQUE FC X Insurance investment mutual fund VEGA EURO RENDEMENT FCP RC FC X Insurance investment mutual fund VEGA FRANCE OPPORTUNITÉ (ELITE 1818) FC X Insurance investment mutual fund VEGA OBLIGATION EURO FC X Insurance investment mutual fund Payments division BPCE PAYMENTS SERVICES (formerly NATIXIS PAYMENTS SOLUTION) FC X Banking services BPCE PAYMENTS (formerly Shiva) FC X Holding BPH (formerly NATIXIS PAYMENT HOLDING) FC X Holding ESTREEM EQ X IT programming XPOLLENS (formerly S-MONEY) FC X Payment services PAYPLUG ENTERPRISE FC X Payment services SWILE EQ X Payment services, Service vouchers and Online services for employees Other BPCE IMMO EXPLOITATION (formerly NATIXIS IMMO EXPLOITATION) FC X Real estate operations III-5 Local savings companies (LSCs) 175 LOCAL SAVINGS COMPANIES (LSCS) FC X COOPERATIVE SHAREHOLDERS EU LI1 – Differences between the accounting scope of consolidation and the prudential consolidation scope and mapping of financial statement categories to regulatory risk categories
The following table presents the assets and liabilities recognized in Groupe BPCE’s prudential balance sheet, broken down by type of regulatory risk. The sum of the amounts broken down is not necessarily equal to the net book values of the prudential scope, as some items may be subject to capital requirements for several types of risk.
12/31/2025 a b c d e f g Carrying amounts of items in millions of euros Carrying
amounts as
reported in the
published
financial
statementsCarrying
amounts
according to
the prudential
consolidation
scopeSubject to
the credit
risk
frameworkSubject to the
counterparty
credit risk
frameworkSubject
to the
securitization
frameworkSubject to the
market risk
frameworkNot subject to
capital
requirements or
subject to
deductions from
capitalBREAKDOWN BY ASSET CLASSES ACCORDING TO THE BALANCE SHEET IN THE PUBLISHED FINANCIAL STATEMENTS 1 Cash and amounts due from central banks 133,938 134,049 134,049 - - - - 2 Financial assets at fair value through profit or loss 239,646 239,973 28,551 132,125 3,094 208,171 - 7 Hedging derivatives 6,398 6,398 - 6,398 - - - 3 Financial assets at fair value through other comprehensive income 63,971 63,976 63,976 - 686 - - 4 Debt securities at amortized cost 26,851 27,119 27,119 - 2,493 - - 5 Loans and advances to banks 122,373 122,036 119,127 2,908 - - - 6 Loans and Advances to Customers 879,407 878,105 874,463 3,642 2,797 - - 8 Revaluation differences on interest rate risk-hedged portfolios, assets (2,201) (2,201) - - - - (2,201) 9 Financial investments of insurance activities 129,597 - - - - - - 10 Insurance contracts issued - Assets 1,168 618 618 - - - - 11 Reinsurance contracts held - Assets 9,188 62 62 - - - - 12 Current tax assets 796 795 795 - - - - 13 Deferred tax assets 4,292 3,999 2,585 - - - 1,414 14 Accrued income and other assets 14,931 14,997 14,997 - - - - 15 Non-current assets held for sale 197 197 62 - - - 135 16 Investments accounted for using the equity method 2,200 6,101 5,824 - - - 277 17 Investment property 984 984 984 - - - - 18 Property, plant and equipment 6,645 6,637 6,637 - - - - 19 Intangible assets 1,328 1,221 226 - - - 995 20 Goodwill 4,023 3,973 - - - - 3,973 21 Accrued income and other assets 22 Total assets 1,645,733 1,509,039 1,280,075 145,075 9,070 208,171 4,593 BREAKDOWN BY LIABILITY CLASSES ACCORDING TO THE BALANCE SHEET IN THE PUBLISHED FINANCIAL STATEMENTS 1 Amounts due to central banks 12 12 - - - - 12 2 Financial liabilities at fair value through profit or loss 233,777 229,211 1,083 141,373 1,083 166,856 61,278 3 Hedging derivatives 13,251 13,159 - 13,159 - 0 - 4 Amounts due to banks 90,939 87,912 - 17,065 - - 70,848 5 Amounts due to customers 757,253 763,170 - 3,323 - 6 759,847 6 Debt securities 283,035 279,390 - - - - 279,390 7 Revaluation differences on interest rate risk-hedged portfolios, liabilities 25 25 - - - - 25 8 Insurance contracts issued - Liabilities 129,971 - - - - - - 9 Reinsurance contracts held - Liabilities 109 - - - - - - 10 Current tax liabilities 2,433 2,434 - - - - 2,434 11 Deferred tax liabilities 1,491 1,196 - - - - 1,196 12 Accrued expenses and other liabilities 20,528 20,071 1,056 - - - 19,016 13 Liabilities associated with non-current assets held for sale 21 21 - - - - 21 14 Provisions 4,613 4,569 925 - 0 - 3,644 15 Liabilities related to insurance contracts 16 Accrued expenses and other liabilities 17 Subordinated debt 18,012 17,649 - - - - 17,649 18 Equity attributable to equity holders of the parent 89,309 89,301 - - - - 89,301 19 Share capital and additional paid-in capital 29,461 29,461 - - - - 29,461 20 Consolidated reserves 56,070 56,062 - - - - 56,062 21 Recyclable gains and losses recognized directly in other comprehensive income (889) (889) - - - - (889) 22 Non-recyclable gains and losses recognized directly in other comprehensive income 606 606 - - - - 606 23 Net income for the period 4,061 4,061 - - - - 4,061 24 Non-controlling interests 955 919 - - - - 919 25 Total liabilities 1,645,733 1,509,039 3,063 174,920 1,083 166,862 1,305,579 12/31/2024 a b c d e f g Carrying amounts of items in millions of euros Carrying
amounts as
reported in the
published
financial
statementsCarrying
amounts
according to
the prudential
consolidation
scopeSubject
to the
credit risk
frameworkSubject to the
counterparty
credit risk
frameworkSubject
to the
securitization
frameworkSubject to
the
market risk
frameworkNot subject
to capital
requirements
or subject to
deductions
from capitalBREAKDOWN BY ASSET CLASSES ACCORDING TO THE BALANCE SHEET IN THE PUBLISHED FINANCIAL STATEMENTS 1 Amounts due to central banks 133,186 133,225 133,225 - - - - 2 Financial assets at fair value through profit or loss 230,521 230,546 26,221 137,159 4,243 199,965 - 3 Financial assets at fair value through other comprehensive income 57,166 57,281 57,281 - 574 - - 4 Debt securities at amortized cost 27,021 27,298 27,298 - 2,271 - - 5 Loans and advances to banks 115,862 115,696 114,764 931 - - - 6 Loans and Advances to Customers 851,843 850,416 847,891 2,525 2,376 22 - 7 Hedging derivatives – Positive FV 7,624 7,624 - 7,624 - - - 8 Revaluation differences on interest rate risk-hedged portfolios, assets (856) (856) - - - - (856) 9 Insurance business investments 126,085 714 714 - - - - 10 Investments accounted for using the equity method 2,146 5,912 5,624 - - - 288 11 Investment property 733 733 733 - - - - 12 Property, plant and equipment 6,085 6,074 6,074 - - - - 13 Intangible assets 1,147 1,027 185 - - - 842 14 Goodwill 4,312 4,262 - - - - 4,262 15 Current tax assets 640 647 647 - - - - 16 Deferred tax assets 4,160 3,885 2,726 - - - 1,159 17 Accrued income and other assets 16,444 16,317 16,317 - - - - 18 Non-current assets held for sale 438 438 356 - - - 82 19 Total assets 1,584,558 1,461,241 1,240,059 148,240 9,464 199,987 5,777 BREAKDOWN BY LIABILITY CLASSES ACCORDING TO THE BALANCE SHEET IN THE PUBLISHED FINANCIAL STATEMENTS 1 Amounts due to central banks 1 1 - - - - 1 2 Financial liabilities at fair value through profit or loss 218,963 215,130 679 144,585 684 166,166 48,290 3 Debt securities 304,957 301,351 - - - - 301,351 4 Amounts due to banks 69,953 67,268 - 11,602 - - 55,665 5 Amounts due to customers 723,090 728,230 - 3,173 - 1 725,057 6 Hedging derivatives – Negative FV 14,260 14,253 - 14,253 - - - 7 Revaluation differences on interest rate risk-hedged portfolios, liabilities 14 14 - - - - 14 8 Provisions 4,748 4,702 945 - - - 3,758 9 Liabilities related to insurance contracts 117,670 - - - - - - 10 Current tax liabilities 2,206 2,212 - - - - 2,212 11 Deferred tax liabilities 1,323 1,109 - - - - 1,109 12 Accrued expenses and other liabilities 20,892 20,483 1,117 - - - 19,365 13 Liabilities associated with non-current assets held for sale 312 312 - - - - 312 14 Subordinated debt 18,401 18,186 - - - - 18,186 15 Equity attributable to equity holders of the parent 87,137 87,129 - - - - 87,129 16 Capital and associated reserves 29,349 29,349 - - - - 29,349 17 Consolidated reserves 53,427 53,419 - - - - 53,419 18 Gains and losses recognized directly in other comprehensive income 842 842 - - - - 842 19 Net income for the period 3,520 3,520 - - - - 3,520 20 Non-controlling interests 630 861 - - - - 861 21 Total liabilities 1,584,558 1,461,241 2,741 173,613 684 166,166 1,263,310 EU LI2 – Main sources of differences between the regulatory exposure amounts and the carrying amounts in the financial statements
The following table shows the transition from the carrying amounts of the prudential scope presented by type of regulatory risk to the amount of exposure taken into account for regulatory purposes.
12/31/2025 a b c d e Items subject to in millions of euros Total Credit risk
frameworkSecuritizatio
n frameworkCounterparty
credit risk
frameworkMarket risk
framework1 Carrying amount of assets according to the prudential scope of consolidation (according to the EU LI1 model) 1,503,766 1,279,395 9,070 145,075 208,171 2 Carrying amount of liabilities according to the prudential scope of consolidation (according to the EU LI1 model) (203,461) (3,063) (1,083) (174,920) (166,862) 3 Total net amount according to the prudential scope of consolidation 1,300,306 1,276,332 7,987 (29,846) 41,309 4 Off-balance sheet amounts 230,718 217,295 13,423 5 Differences in valuation (1,113) (518) (596) 6 Differences due to different netting rules other than those already included in row 2 57,393 98,702 7 Differences due to the recognition of provisions 11,660 11,660 8 Differences due to the use of credit risk mitigation (CRM) techniques (10,278) (10,278) 9 Differences due to credit conversion factors (115,458) (115,458) - 10 Differences due to securitization with risk transfer (121) (121) 11 Other differences (28,693) (23,984) (186) 12 Exposure amounts taken into account for regulatory purposes 1,444,414 1,355,050 21,103 68,261 12/31/2024 a b c d e Items subject to in millions of euros Total Credit risk
frameworkSecuritization
frameworkCounterparty
credit risk
frameworkMarket risk
framework1 Carrying amount of assets according to the prudential scope of consolidation (according to the EU LI1 model) 1,455,464 1,240,059 9,464 148,240 199,987 2 Carrying amount of liabilities according to the prudential scope of consolidation (according to the EU LI1 model) (197,931) (2,741) (684) (173,613) (166,166) 3 Total net amount according to the prudential scope of consolidation 1,257,533 1,237,318 8,781 (25,373) 33,820 4 Off-balance sheet amounts 222,431 208,829 13,602 5 Differences in valuation (1,088) (539) (549) 6 Differences due to different netting rules other than those already included in row 2 65,340 - 99,160 7 Differences due to the recognition of provisions 11,115 11,115 8 Differences due to the use of credit risk mitigation (CRM) techniques (8,603) (8,603) 9 Differences due to credit conversion factors (86,989) (86,989) 10 Differences due to securitization with risk transfer (126) - (126) 11 Other differences (28,521) (24,940) (594) 12 Exposure amounts taken into account for regulatory purposes 1,431,091 1,336,190 21,663 73,238 The following table is presented in the format of Annex VI, Commission Implementing Regulation (EU) No. 1423/2013 of December 20, 2013. For the sake of simplicity, the denominations presented below are those of Annex VI, i.e. the phased denominations.
12/31/2025 12/31/2024 a b a b in millions of euros Amounts Source based
on reference
numbers/letters
of the balance
sheet under the
regulatory scope
of consolidationAmounts Source based
on reference
numbers/letters
of the balance
sheet under the
regulatory scope
of consolidationCommon Equity Tier-1 (CET1) capital: instruments and reserves 1 Capital instruments and the related share premium accounts 29,461 4 29,349 4 2 Retained earnings 2,600 4 3,140 4 3 Accumulated other comprehensive income (and other reserves) 51,850 4 49,757 4 EU-3a Funds for general banking risk - - - 4 Amount of qualifying items referred to in Article 484 (3) and the related share premium accounts subject to phase out from CET1 - - - 5 Minority interests (amount allowed in consolidated CET1) 221 5 219 5 EU-5a Independently reviewed interim profits net of any foreseeable charge or dividend 3,367 4 2,747 4 6 Common Equity Tier 1 (CET1) capital before regulatory adjustments 87,499 - 85,212 Common Equity Tier-1 (CET1) capital: regulatory adjustments 7 Additional value adjustments (negative amount) (1,113) - (1,088) 8 Intangible assets (net of related tax liability) (negative amount) (5,054) 2 (5,106) 2 10 Deferred tax assets that rely on future profitability excluding those arising from temporary differences (net of related tax liability where the conditions in Article 38 (3) are met) (negative amount) (484) 1 (644) 1 11 Fair value reserves related to gains or losses on cash flow hedges of financial instruments that are not valued at fair value (32) - (202) 12 Negative amounts resulting from the calculation of expected loss amounts (15) - (210) 13 Any increase in equity that results from securitized assets (negative amount) - - - 14 Gains or losses on liabilities valued at fair value resulting from changes in own credit standing 682 - (234) 15 Defined-benefit pension fund assets (negative amount) (111) - (98) 16 Direct and indirect holdings by an institution of own CET1 instruments (negative amount) - - - 17 Direct, indirect and synthetic holdings of the CET 1 instruments of financial sector entities where those entities have reciprocal cross holdings with the institution designed to inflate artificially the own funds of the institution (negative amount) - - - 18 Direct, indirect and synthetic holdings by the institution of the CET1 instruments of financial sector entities where the institution does not have a significant investment in those entities (amount above 10% threshold and net of eligible short positions) (negative amount) - - - 19 Direct, indirect and synthetic holdings by the institution of the CET1 instruments of financial sector entities where the institution has a significant investment in those entities (amount above 10% threshold and net of eligible short positions) (negative amount) - - - EU-20a Exposure amount of the following items which qualify for a RW of 1250%, where the institution opts for the deduction alternative - - - EU-20b –
of which: qualifying holdings outside the financial sector (negative amount)
- - - EU-20c –
of which: securitisation positions (negative amount)
- - - EU-20d –
of which: free deliveries (negative amount)
- - - 21 Deferred tax assets arising from temporary differences (amount above 10% threshold, net of related tax liability where the conditions in Article 38 (3) are met) (negative amount) - - - 22 Amount exceeding the 17.65% threshold (negative amount) - - - 23 –
of which: direct, indirect and synthetic holdings by the institution of the CET1 instruments of financial sector entities where the institution has a significant investment in those entities
- - - 25 –
of which: deferred tax assets arising from temporary differences
- - - EU-25b Foreseeable tax charges relating to CET1 items except where the institution suitably adjusts the amount of CET1 items insofar as such tax charges reduce the amount up to which those items may be used to cover risks or losses (negative amount) - - - 27a Other regulatory adjustments (5,061) - (3,760) 28 Total regulatory adjustments to Common Equity Tier 1 (CET1) (11,189) - (11,365) 29 Common Equity Tier 1 (CET1) capital 76,310 - 73,847 Additional Tier 1 (AT1) capital: instruments 30 Capital instruments and the related share premium accounts - - 31 –
of which: classified as equity under applicable accounting standards
- - 32 –
of which: classified as liabilities under applicable accounting standards
- - 33 Amount of qualifying items referred to in Article 484 (4) and the related share premium accounts subject to phase out from AT1 - - EU-33a Amount of qualifying items referred to in Article 494a(1) subject to phase out from AT1 - - EU-33b Amount of qualifying items referred to in Article 494b(1) subject to phase out from AT1 - - 34 Qualifying Tier 1 capital included in consolidated AT1 capital (including minority interests not included in row 5) issued by subsidiaries and held by third parties - - 35 –
of which: instruments issued by subsidiaries subject to phase out
- - 36 Additional Tier 1 (AT1) capital before regulatory adjustments - - Additional Tier 1 (AT1) capital: regulatory adjustments 37 Direct and indirect holdings by an institution of own AT1 instruments (negative amount) - - - 38 Direct, indirect and synthetic holdings of the AT1 instruments of financial sector entities where those entities have reciprocal cross holdings with the institution designed to inflate artificially the own funds of the institution (negative amount) - - - 39 Direct, indirect and synthetic holdings of the AT1 instruments of financial sector entities where the institution does not have a significant investment in those entities (amount above 10% threshold and net of eligible short positions) (negative amount) - - - 40 Direct, indirect and synthetic holdings by the institution of the AT1 instruments of financial sector entities where the institution has a significant investment in those entities (net of eligible short positions) (negative amount) - - (22) 42 Qualifying T2 deductions that exceed the T2 items of the institution (negative amount) - - - 42a Other regulatory adjustments to AT1 capital - - - 43 Total regulatory adjustments to Additional Tier 1 (AT1) capital - - (22) 44 Additional Tier 1 (AT1) capital - - - 45 Tier 1 capital (T1 = CET1 + AT1) 76,310 - 73,847 Tier 2 (T2) capital: instruments 46 Capital instruments and the related share premium accounts 13,419 3 13,617 3 47 Amount of qualifying items referred to in Article 484 (5) and the related share premium accounts subject to phase out from T2 as described in Article 486 (4) CRR - - - EU-47a Amount of qualifying items referred to in Article 494a (2) subject to phase out from T2 - - - EU-47b Amount of qualifying items referred to in Article 494b (2) subject to phase out from T2 - - 87 3 48 Qualifying own funds instruments included in consolidated T2 capital (including minority interests and AT1 instruments not included in rows 5 or 34) issued by subsidiaries and held by third parties - - - 49 –
of which: instruments issued by subsidiaries subject to phase out
- - - 50 Credit risk adjustments 530 - 306 51 Tier 2 (T2) capital before regulatory adjustments 13,948 - 14,009 Tier-2 (T2) capital: regulatory adjustments 52 Direct and indirect holdings by an institution of own T2 instruments and subordinated loans (negative amount) (24) - (25) 53 Direct, indirect and synthetic holdings of the T2 instruments and subordinated loans of financial sector entities where those entities have reciprocal cross holdings with the institution designed to inflate artificially the own funds of the institution (negative amount) - - - 54 Direct and indirect holdings of the T2 instruments and subordinated loans of financial sector entities where the institution does not have a significant investment in those entities (amount above 10% threshold and net of eligible short positions) (negative amount) - - - 55 Direct and indirect holdings by the institution of the T2 instruments and subordinated loans of financial sector entities where the institution has a significant investment in those entities (net of eligible short positions) (negative amount) (1,477) - (1,775) EU-56a Qualifying eligible liabilities deductions that exceed the eligible liabilities items of the institution (negative amount) - - - EU-56b Other regulatory adjustments to T2 capital - - - 57 Total regulatory adjustments to Tier 2 (T2) capital (1,501) - (1,800) 58 Tier 2 (T2) capital 12,447 - 12,210 59 Total capital (TC = T1 + T2) 88,757 - 86,057 60 Total risk exposure amount 463,054 - 456,591 Capital ratios and requirements including buffers 61 Common Equity Tier 1 (CET1) capital 16.48% - 16.17% 62 Tier 1 capital 16.48% - 16.17% 63 Total capital 19.17% - 18.85% 64 Institution CET1 overall capital requirements 10.16% - 10.08% 65 –
of which: capital conservation buffer requirement
2.50% - 2.50% 66 –
of which: countercyclical capital buffer requirement
0.90% - 0.90% 67 –
of which: systemic risk buffer requirement
0.00% - 0.00% EU-67a –
of which: Global Systemically Important Institution (G-SII) or Other Systemically Important Institution (O-SII) buffer requirement
1.00% - 1.00% EU-67b of which: additional own funds requirements to address the risks other than the risk of excessive leverage 1.27% - 68 Common Equity Tier 1 capital (as a percentage of risk exposure amount) available after meeting the minimum capital requirements 8.79% - 8.60% Amounts below the thresholds for deduction (before risk weighting) 72 Direct and indirect holdings of own funds and eligible liabilities of financial sector entities where the institution does not have a significant investment in those entities (amount below 10% threshold and net of eligible short positions) 1,022 - 1,010 73 Direct and indirect holdings by the institution of the CET1 instruments of financial sector entities where the institution has a significant investment in those entities (amount below 17.65% thresholds and net of eligible short positions) 2,941 - 2,635 74 Not applicable - - 75 Deferred tax assets arising from temporary differences (amount below 17.65% threshold, net of related tax liability where the conditions in Article 38 (3) are met) 2,585 - 2,726 Applicable caps on the inclusion of provisions in Tier2 76 Credit risk adjustments included in T2 in respect of exposures subject to standardised approach (prior to the application of the cap) - - - 77 Cap on inclusion of credit risk adjustments in T2 under standardised approach 2,216 - 1,741 78 Credit risk adjustments included in T2 in respect of exposures subject to internal ratings-based approach (prior to the application of the cap) 530 - 306 79 Cap for inclusion of credit risk adjustments in T2 under internal ratings-based approach 1,181 - 1,194 Capital instruments subject to phase-out arrangements (only applicable between January 1, 2014 and January 1, 2022) 80 Current cap on CET1 instruments subject to phase out arrangements - - - 81 Amount excluded from CET1 due to cap (excess over cap after redemptions and maturities) - - - 82 Current cap on AT1 instruments subject to phase out arrangements - - - 83 Amount excluded from AT1 due to cap (excess over cap after redemptions and maturities) - - - 84 Current cap on T2 instruments subject to phase out arrangements - - - 85 Amount excluded from T2 due to cap (excess over cap after redemptions and maturities) 10 - 10 in millions of euros 12/31/2025
Basel IV12/31/2024
Basel IIIAT1 capital instruments ineligible but benefiting from a grandfathering clause (1) - - Holdings of AT1 instruments of financial sector entities more than 10%-owned - - Transitional adjustments applicable to AT1 capital - - ADDITIONAL TIER-1 (AT1) CAPITAL - - in millions of euros 12/31/2025
Basel IV12/31/2024
Basel IIIEligible Tier-2 capital instruments 13,419 13,617 Own Tier-2 instruments (24) (25) Tier-2 capital instruments ineligible but benefiting from a grandfathering clause* - 87 Holdings of Tier-2 instruments of financial sector entities more than 10%-owned (1,477) (1,775) Transitional adjustments applicable to Tier-2 capital - - Excess provision over expected losses 530 306 TIER-2 CAPITAL 12,447 12,210 Issuer Issue date Maturity date Currency Amount in original
currency
(in millions)Outstandings
(in millions of euros)Prudential net
outstandings
(in millions of euros)BPCE 04/16/2014 04/16/2029 GBP 750 859 574 BPCE 07/25/2014 06/25/2026 EUR 350 350 34 BPCE 07/25/2014 06/25/2026 EUR 525 525 78 BPCE 02/17/2015 02/17/2027 EUR 240 240 53 BPCE 02/17/2015 02/17/2027 EUR 371 371 116 BPCE 04/17/2015 04/17/2035 USD 270 230 198 BPCE 04/29/2015 04/17/2035 USD 100 85 73 BPCE 04/29/2015 04/17/2035 USD 30 26 22 BPCE 06/01/2015 06/01/2045 USD 130 111 85 BPCE 03/17/2016 03/17/2031 EUR 60 60 60 BPCE 03/17/2016 03/17/2036 USD 150 128 108 BPCE 04/01/2016 04/01/2026 USD 750 639 32 BPCE 04/22/2016 04/22/2026 EUR 750 750 47 BPCE 05/03/2016 05/03/2046 USD 200 170 169 BPCE 07/19/2016 07/19/2026 EUR 696 696 77 BPCE 07/13/2016 07/13/2026 JPY 17,300 94 10 BPCE 10/13/2021 01/13/2042 EUR 900 900 892 BPCE 10/13/2021 10/13/2046 EUR 850 850 732 BPCE 10/19/2021 10/19/2042 USD 750 639 453 BPCE 10/19/2021 10/19/2032 USD 1,000 851 759 BPCE 12/01/2021 11/30/2032 GBP 500 573 546 BPCE 12/16/2021 12/16/2031 JPY 74,600 405 402 BPCE 12/16/2021 12/16/2036 JPY 5,800 32 29 BPCE 01/14/2022 01/14/2037 USD 800 681 620 BPCE 02/02/2022 02/02/2034 EUR 1,000 1,000 949 BPCE 03/02/2022 03/02/2032 EUR 500 500 499 BPCE 07/07/2022 07/07/2032 JPY 26,600 145 144 BPCE 12/15/2022 12/15/2032 JPY 8,400 46 45 BPCE 01/25/2023 01/25/2035 EUR 1,500 1,500 1,577 BPCE 06/01/2023 06/01/2033 EUR 500 500 518 BPCE 01/18/2024 01/18/2035 USD 900 766 783 BPCE 02/26/2024 02/26/2036 EUR 500 500 519 BPCE 03/08/2024 03/08/2034 SGD 400 265 278 BPCE 01/16/2025 07/16/2035 EUR 750 750 756 BPCE 01/14/2025 01/14/2046 USD 800 681 703 BPCE 01/21/2025 01/21/2035 SGD 300 199 210 BPCE 06/12/2025 06/12/2040 AUD 500 284 269 TOTAL 17,695 13,946 Details of debt instruments recognized as Tier-2 capital, as well as their characteristics, as required by Implementing Regulation (EU) 1423/ 2013, are published at the following address: https://groupebpce.com/en/investors/results-and-publications/pillar-iii.
EU CCyB1 - Geographical distribution of credit exposures relevant for the calculation of the countercyclical buffer
12/31/2025 a b c d e f g h i j k l m General credit
exposuresRelevant credit
exposures – Market
riskSecuritisation
exposures
Exposure
value for
non-trading
bookTotal
exposure
valueOwn fund requirements in millions of euros Exposure
value
under the
standardised
approachExposure
value under
the IRB
approachSum of long
and short
positions of
trading book
exposures
for SAValue of
trading book
exposures
for internal
modelsRelevant
credit risk
exposures -
Credit riskRelevant
credit
exposures –
Market riskRelevant credit
exposures –
Securitisation
positions in the
non-trading
bookTotal Risk-
weighted
exposure
amountsOwn fund
requirement
weights
(%)Countercyclical
buffer rate
(%)010 Breakdown by country: Germany 1,246 9,371 364 1,797 1,059 13,837 382 23 15 420 5,244 1.42% 0.75% Armenia - 1 - - - 1 0 - - 0 0 0.00% 1.50% Australia 81 3,086 36 26 1,011 4,240 97 1 13 110 1,375 0.37% 1.00% Belgium 4,424 2,968 163 1,915 - 9,470 282 7 - 290 3,621 0.98% 1.00% Bulgaria 0 2 - - - 2 0 - - 0 0 0.00% 2.00% Chile 0 1,748 0 - - 1,748 42 0 - 42 523 0.14% 0.50% Cyprus 0 8 - - - 8 0 - - 0 1 0.00% 1.00% Republic of Korea 87 483 357 39 - 965 20 0 - 21 259 0.07% 1.00% Croatia 0 5 - - - 5 0 - - 0 3 0.00% 1.50% Denmark 335 116 23 12 - 487 30 1 - 32 399 0.11% 2.50% Spain 1,935 4,727 411 491 652 8,215 284 16 10 310 3,869 1.05% 0.50% Estonia 1 64 3 - - 68 2 - - 2 24 0.01% 1.50% France 165,402 659,481 23,496 9,886 3,105 861,369 23,441 95 44 23,580 294,748 79.67% 1.00% Greece 0 127 1 1 - 129 2 0 - 2 30 0.01% 0.25% Hong Kong 34 2,280 186 - 190 2,691 60 15 3 78 978 0.26% 0.50% Hungary 108 108 5 0 - 222 9 0 - 9 117 0.03% 1.00% Ireland 155 2,262 147 24 842 3,430 60 9 10 79 992 0.27% 1.50% Iceland 0 1 - 1 - 2 0 0 - 0 0 0.00% 2.50% Latvia 0 1 1 - - 2 0 - - 0 0 0.00% 1.00% Lithuania 1 207 - - - 208 4 - - 4 50 0.01% 1.00% Luxembourg 1,648 9,454 127,367 898 919 140,286 448 12 9 469 5,864 1.59% 0.50% Norway 133 454 7 3 - 598 16 0 - 16 198 0.05% 2.50% Netherlands 1,571 4,227 373 862 983 8,016 201 17 38 257 3,210 0.87% 2.00% Poland 1,010 146 0 0 - 1,156 58 0 - 58 722 0.20% 1.00% Czech Republic 23 43 7 0 - 73 2 1 - 3 36 0.01% 1.25% Romania 9 11 - - - 20 1 - - 1 10 0.00% 1.00% United Kingdom 3,532 8,634 499 269 1,049 13,984 436 25 16 477 5,967 1.61% 2.00% Slovakia 41 35 0 0 - 76 3 0 - 3 36 0.01% 1.50% Slovenia 3 0 - - - 3 0 - - 0 3 0.00% 1.00% Sweden 80 578 21 26 - 705 23 1 - 24 298 0.08% 2.00% Other countries weighted at 0% 21,118 60,948 7,685 5,215 10,742 105,708 2,986 160 164 3,310 41,375 11.18% 0.00% 020 TOTAL 202,977 771,576 161,153 21,464 20,553 1,177,723 28,890 385 321 29,596 369,951 100.00% 12/31/2024 a b c d e f g h i j k l m General credit
exposuresRelevant credit
exposures – Market
riskOwn fund requirements in millions of euros Exposure
value
under the
standardised
approachExposure
value under
the IRB
approachSum of long
and short
positions of
trading book
exposures
for SAValue of
trading book
exposures
for internal
modelsSecuritisation
exposures
Exposure
value for non-
trading bookTotal
exposure
valueRelevant
credit risk
exposures -
Credit riskRelevant
credit
exposures –
Market riskRelevant credit
exposures –
Securitisation
positions in the
non-trading
bookTotal Risk-
weighted
exposure
amountsOwn fund
requirement
weights
(%)Countercyclical
buffer rate
(%)010 Breakdown by country: Armenia - 1 - - - 1 0 - - 0 0 0.00% 1.50% Australia 35 2,599 32 1 732 3,399 96 1 10 106 1,327 0.35% 1.00% Belgium 1,692 2,650 79 1,628 - 6,048 208 8 - 217 2,706 0.72% 1.00% Bulgaria 0 2 - - - 2 0 - - 0 0 0.00% 2.00% Chile - 1,838 0 - - 1,838 53 0 - 53 661 0.18% 0.50% Cyprus 0 10 - - - 10 0 - - 0 1 0.00% 1.00% Czech Republic 12 15 1 5 - 33 1 0 - 1 15 0.00% 1.25% Germany 906 2,471 268 2,463 898 7,007 141 18 11 170 2,130 0.57% 0.75% Denmark 241 293 38 126 - 697 33 1 - 33 418 0.11% 2.50% Estonia 1 0 3 - - 4 0 - - 0 1 0.00% 1.50% France 140,823 675,495 7,402 5,548 5,011 834,279 24,412 76 102 24,591 307,385 82.02% 1.00% United Kingdom 1,345 9,198 312 110 1,097 12,063 310 13 17 341 4,267 1.14% 2.00% Hong Kong 33 3,408 12 - 254 3,707 106 0 4 110 1,375 0.37% 1.00% Croatia 3 1 - - - 3 0 - - 0 2 0.00% 1.50% Hungary 9 103 5 - - 117 3 0 - 3 43 0.01% 0.50% Ireland 298 3,156 201 0 632 4,286 88 8 9 104 1,306 0.35% 1.50% Iceland - 1 - - - 1 0 - - 0 0 0.00% 2.50% Republic of Korea 18 152 485 124 - 779 12 1 - 13 159 0.04% 1.00% Lithuania 0 1 2 - - 2 0 - - 0 0 0.00% 1.00% Luxembourg 1,296 10,830 103,105 688 830 116,750 505 9 8 521 6,515 1.74% 0.50% Latvia 0 1 1 - - 2 0 - - 0 0 0.00% 0.50% Netherlands 1,602 4,389 193 643 983 7,810 185 11 34 231 2,883 0.77% 2.00% Norway 100 501 13 27 - 641 15 0 - 16 196 0.05% 2.50% Romania 10 10 - - - 19 1 - - 1 10 0.00% 1.00% Sweden 77 264 9 40 - 389 12 1 - 13 163 0.04% 2.00% Slovenia 2 0 - - - 2 0 - - 0 2 0.00% 0.50% Slovakia 22 1 1 0 - 24 1 0 - 1 13 0.00% 1.50% Other countries weighted at 0% 19,309 66,920 5,772 2,534 11,143 105,678 3,178 97 181 3,456 43,194 11.53% 0.00% 020 TOTAL 167,832 784,308 117,933 13,938 21,581 1,105,593 29,362 245 376 29,982 374,771 100.00% 12/31/2025 a b c d e EU e1 EU e2 f g h Risk category Category level AVA -
Valuation uncertainty
Category level AVA
in millions of eurosEquity Interest
RatesForeign
exchangeCredit Commodities Unearned
credit
spreads
AVAInvestment
and funding
costs AVATotal category
level post-
diversificationOf which:
Total core
approach in
the trading
bookOf which:
Total core
approach in
the banking
book1 Market price uncertainty 756 57 2 33 3 7 11 471 80 391 3 Close-out cost 265 67 5 6 1 8 1 181 141 40 4 Concentrated positions 64 11 2 14 - - - 91 70 21 5 Early termination - - - - - - - - - - 6 Model risk 158 56 23 43 0 52 4 174 159 15 7 Operational risk 49 6 0 2 0 - - 57 22 35 10 Future administrative costs 38 65 13 19 5 - - 140 124 16 12 TOTAL ADDITIONAL VALUATION ADJUSTMENTS (AVAS) 1,113 596 518 12/31/2024 a b c d e EU e1 EU e2 f g h Risk category Category level AVA -
Valuation uncertaintyCategory level AVA
in millions of eurosEquity Interest
RatesForeign
exchangeCredit Commodities Unearned
credit
spreads AVAInvestment
and funding
costs AVATotal category
level post-
diversificationOf which:
Total core
approach in
the trading
bookOf which:
Total core
approach in
the banking
book1 Market price uncertainty 636 52 3 52 2 13 50 404 70 333 3 Close-out cost 218 68 5 89 1 15 2,515 199 127 72 4 Concentrated positions 79 7 999 42 - 129 72 57 5 Early termination - - - - - - - - 6 Model risk 138 36 30 27 318 60 12,370 159 139 20 7 Operational risk 43 8 0 8 0 60 19 41 10 Future administrative costs 39 48 7 33 10 138 122 16 12 TOTAL ADDITIONAL VALUATION ADJUSTMENTS (AVAS) 1,088 549 539 The leverage ratio calculates Tier-1 capital to an exposure calculated quarterly on the basis of balance sheet and off-balance sheet items assessed using a prudential approach. Derivatives and repurchase agreements are subject to specific restatements. The commitments given are allocated a conversion factor in accordance with Article 429 (7) of the CRR2.
CRR leverage ratio exposures a b in millions of euros 12/31/2025 12/31/2024 ON-BALANCE SHEET EXPOSURES (EXCLUDING DERIVATIVES AND SFTS) 1 On-balance sheet items (excluding derivatives, SFTs, but including collateral) 1,366,613 1,315,096 2 Gross-up for derivatives collateral provided where deducted from the balance sheet assets pursuant to the applicable accounting framework 0 - 3 (Deductions of receivables assets for cash variation margin provided in derivatives transactions) (10,350) (8,833) 4 (Adjustment for securities received under securities financing transactions that are recognised as an asset) - - 5 (General credit risk adjustments to on-balance sheet items) - - 6 (Asset amounts deducted in determining Tier 1 capital) (6,840) (7,430) 7 Total on-balance sheet exposures (excluding derivatives and SFTs) 1,349,423 1,298,833 DERIVATIVES EXPOSURES 8 Replacement cost associated with SA-CCR derivatives transactions (ie net of eligible cash variation margin) 14,724 16,680 EU-8a Derogation for derivatives: replacement costs contribution under the simplified standardised approach - - 9 Add-on amounts for potential future exposure associated with SA-CCR derivatives transactions 34,465 30,904 EU-9a Derogation for derivatives: Potential future exposure contribution under the simplified standardised approach - - EU-9b Exposure determined under Original Exposure Method - - 10 (Exempted CCP leg of client-cleared trade exposures) (SA-CCR) - - EU-10a (Exempted CCP leg of client-cleared trade exposures) (simplified standardised approach) - - EU-10b (Exempted CCP leg of client-cleared trade exposures) (original Exposure Method) - - 11 Adjusted effective notional amount of written credit derivatives 44,501 31,115 12 (Adjusted effective notional offsets and add-on deductions for written credit derivatives) (39,991) (27,473) 13 Total derivatives exposures 53,699 51,227 SECURITIES FINANCING TRANSACTION (SFT) EXPOSURES 14 Gross SFT assets (with no recognition of netting), after adjustment for sales accounting transactions 83,758 84,754 15 (Netted amounts of cash payables and cash receivables of gross SFT assets) - - 16 Counterparty credit risk exposure for SFT assets 8,866 8,396 EU-16a Derogation for SFTs: Counterparty credit risk exposure in accordance with Articles 429e(5) and 222 CRR - - 17 Agent transaction exposures - - EU-17a (Exempted CCP leg of client-cleared SFT exposure) - - 18 Total securities financing transaction exposures 92,624 93,150 OTHER OFF-BALANCE SHEET EXPOSURES 19 Off-balance sheet exposures at gross notional amount 229,682 223,361 20 (Adjustments for conversion to credit equivalent amounts) (127,159) (123,631) 21 (General provisions deducted in determining Tier 1 capital and specific provisions associated with off-balance sheet exposures) - - 22 Off-balance sheet exposures 102,523 99,730 EXCLUDED EXPOSURES EU-22a (Exposures excluded from the total exposure measure in accordance with point (c) and point (ca) of Article 429a(1) CRR) (3,000) (4,028) EU-22b (Exposures exempted in accordance with point (j) of Article 429a (1) CRR (on and off balance sheet)) (105,930) (103,067) EU-22c (Excluded exposures of public development banks (or units) - Public sector investments) - - EU-22d (Excluded exposures of public development banks (or units) - Promotional loans) - - EU-22e (Excluded passing-through promotional loan exposures by non-public development banks (or units)) - - EU-22f (Excluded guaranteed parts of exposures arising from export credits) - - EU-22g (Excluded excess collateral deposited at triparty agents) - - EU-22h (Excluded CSD related services of CSD/institutions in accordance with point (o) of Article 429a(1) CRR) - - EU-22i (Excluded CSD related services of designated institutions in accordance with point (p) of Article 429a(1) CRR) - - EU-22j (Reduction of the exposure value of pre-financing or intermediate loans) - - EU-22k (Excluded exposures to shareholders according to Article 429a (1), point (da) CRR) - - EU-22l (Exposures deducted in accordance with point (q) of Article 429a(1) CRR) - - EU-22m (Total exempted exposures) (108,930) (107,095) CAPITAL AND TOTAL EXPOSURE MEASURE 23 Tier 1 capital 76,310 73,847 24 Total exposure measure 1,489,339 1,435,845 LEVERAGE RATIO 25 Leverage ratio 5.12% 5.14% EU-25 Leverage ratio (excluding the impact of the exemption of public sector investments and promotional loans) (%) 5.12% 5.14% 25a Leverage ratio (excluding the impact of any applicable temporary exemption of central bank reserves) 5.12% 5.14% 26 Regulatory minimum leverage ratio requirement (%) 3.00% 3.00% EU-26a Additional own funds requirements to address the risk of excessive leverage (%) 0.00% 0.00% EU-26b of which: to be made up of CET1 capital (percentage points) 0.00% 0.00% 27 Leverage ratio buffer requirement (%) 0.50% 0.50% EU-27a Overall leverage ratio requirement (%) 3.50% 3.50% CHOICE ON TRANSITIONAL ARRANGEMENTS AND RELEVANT EXPOSURES EU-27b Choice on transitional arrangements for the definition of the capital measure DISCLOSURE OF MEAN VALUES 28 Mean value of gross SFT assets, after adjustment for sale accounting transactions and netted of amounts of associated cash payables and cash receivables 113,634 119,974 29 Quarter-end value of gross SFT assets, after adjustment for sale accounting transactions and netted of amounts of associated cash payables and cash receivables 83,758 84,754 30 Total exposure measure (including the impact of any applicable temporary exemption of central bank reserves) incorporating mean values from row 28 of gross SFT assets (after adjustment for sale accounting transactions and netted of amounts of associated cash payables and cash receivables) 1,519,215 1,471,065 30a Total exposure measure (excluding the impact of any applicable temporary exemption of central bank reserves) incorporating mean values from row 28 of gross SFT assets (after adjustment for sale accounting transactions and netted of amounts of associated cash payables and cash receivables) 1,519,215 1,471,065 31 Leverage ratio (including the impact of any applicable temporary exemption of central bank reserves) incorporating mean values from row 28 of gross SFT assets (after adjustment for sale accounting transactions and netted of amounts of associated cash payables and cash receivables) 5.02% 5.02% 31a Leverage ratio (excluding the impact of any applicable temporary exemption of central bank reserves) incorporating mean values from row 28 of gross SFT assets (after adjustment for sale accounting transactions and netted of amounts of associated cash payables and cash receivables) 5.02% 5.02% EU LR3 – LRSpl: Split-up of on balance sheet exposures (excluding derivatives, SFTs and exempted exposures)
12/31/2025 12/31/2024 a a in millions of euros CRR leverage ratio
exposuresCRR leverage ratio
exposuresEU-1 Total on-balance sheet exposures (excluding derivatives, SFTs, and exempted exposures), of which: 1,247,329 1,199,719 EU-2 Trading book exposures 89,406 86,759 EU-3 Banking book exposures, of which: 1,157,923 1,112,961 EU-4 Covered bonds 3,947 2,749 EU-5 Exposures treated as sovereigns 262,612 254,768 EU-6 Exposures to regional governments, MDB, international organisations and PSE not treated as sovereigns 16,674 16,093 EU-7 Institutions 14,305 16,557 EU-8 Secured by mortgages on immovable properties 450,218 430,598 EU-9 Retail exposures 117,181 115,139 EU-10 Corporates 216,481 203,966 EU-11 Exposures in default 20,782 20,076 EU-12 Other exposures (e.g. equity, securitisations, and other non-credit obligation assets) 55,723 53,014 b c d e f in millions of euros 12/31/2025 09/30/2025 06/30/2025 03/31/2025 12/31/2024 OWN FUNDS AND ELIGIBLE LIABILITIES, RATIOS AND COMPONENTS OF THE RESOLUTION GROUP 1 TLAC own funds and eligible liabilities 123,651 122,497 123,648 125,899 122,069 EU-1a of which: own funds and subordinated liabilities 0 2 Risk-weighted assets (RWA) 463,054 455,029 451,854 451,453 456,591 3 TLAC ratio (in % of RWA) 26.70% 26.92% 27.36% 27.89% 26.73% EU-3a of which: own funds and subordinated liabilities 1 4 Leverage exposure measure 1,489,339 1,479,194 1,457,183 1,451,653 1,435,845 5 TLAC ratio (in % of leverage exposure) 8.30% 8.28% 8.49% 8.67% 8.50% EU-5a of which: own funds and subordinated liabilities 1 6a Does the exemption from subordination allowed by Article 72b(4) of Regulation (EU) No. 575/2013 apply? (5% exemption) n.a n.a n.a n.a n.a 6b Aggregate amount of permitted non-subordinated eligible liabilities instruments if the subordination discretion as per Article 72b(3) of Regulation (EU) No. 575/2013 is applied (max 3.5% exemption) n.a n.a n.a n.a n.a 6c If a capped subordination exemption applies under Article 72b(3) of Regulation (EU) No. 575/2013, the amount of funding issued that ranks pari passu with excluded liabilities and that is recognized under row 1, divided by funding issued that ranks pari passu with excluded liabilities and that would be recognized under row 1 if no cap was applied (in %) n.a n.a n.a n.a n.a 12/31/2025 b in millions of euros Capital requirements and
eligible liabilities
applicable to EISm (TLAC)OWN FUNDS AND ELIGIBLE LIABILITIES AND ADJUSTMENTS 1 Common Equity Tier-1 (CET1) capital 76,310 2 Additional Tier-1 (AT1) capital 6 Tier-2 (T2) capital 12,447 11 TLAC-eligible own funds 88,757 OWN FUNDS AND ELIGIBLE LIABILITIES: NON-REGULATORY CAPITAL ITEMS 12 Eligible liabilities instruments issued directly by the resolution entity that are subordinated to excluded liabilities (not grandfathered) 30,394 EU-12a Eligible liabilities instruments issued by other entities within the resolution group that are subordinated to excluded liabilities (not grandfathered) EU-12b Eligible liabilities instruments that are subordinated to excluded liabilities, issued prior to 06/27/2019 (subordinated grandfathered) 3,646 EU-12c Tier-2 instruments with a residual maturity of at least one year to the extent they do not qualify as Tier-2 items 878 13 Eligible liabilities that are not subordinated to excluded liabilities (not grandfathered pre cap) EU-13a Eligible liabilities that are not subordinated to excluded liabilities issued prior to 06/27/2019 (pre-cap) 14 Amount of non-subordinated instruments eligible, where applicable after application of Article 72b(3) of Regulation (EU) No. 575/2013 17 TLAC-eligible liabilities items before adjustments 34,918 EU-17a o/w: subordinated liabilities OWN FUNDS AND ELIGIBLE LIABILITIES: ADJUSTMENTS TO NON-REGULATORY CAPITAL ITEMS 18 TLAC-own funds and eligible liabilities items before adjustments 123,651 19 (Deduction of exposures between MPE resolution groups) 20 (Deduction of investments in other eligible liabilities instruments) 22 TLAC-own funds and eligible liabilities after adjustments 123,651 EU-22a o/w: own funds and subordinated liabilities RISK-WEIGHTED EXPOSURE AMOUNT AND LEVERAGE RATIO EXPOSURE MEASURE OF THE RESOLUTION GROUP 23 Risk-weighted assets (RWA) 463,054 24 Total leverage exposure measure 1,489,339 RATIO OF OWN FUNDS AND ELIGIBLE LIABILITIES 25 TLAC ratio (in % of RWA) 26.70% EU-25a o/w: own funds and subordinated liabilities 26 TLAC ratio (in % of leverage exposure) 8.30% EU-26a o/w: own funds and subordinated liabilities 27 CET1 capital (as a percentage of RWA) available after meeting the resolution group’s requirements 4.30% 28 Overall institution-specific capital buffer requirement 4.40% 29 o/w: capital conservation buffer requirement 2.50% 30 o/w: countercyclical buffer requirement 0.90% 31 o/w: systemic risk buffer requirement 1.00% EU-31a o/w: Global Systemically Important Institution (G-SII) or Other Systemically Important Institution (O-SII) buffer 1.00% FOR THE RECORD EU-32 Total amount of excluded liabilities referred to in Article 72a(2) of Regulation (EU) No. 575/2013 566,162 12/31/2024 b in millions of euros Capital requirements and
eligible liabilities applicable
to EISm (TLAC)OWN FUNDS AND ELIGIBLE LIABILITIES AND ADJUSTMENTS 1 Common Equity Tier-1 (CET1) capital 73,847 2 Additional Tier-1 (AT1) capital - 6 Tier-2 (T2) capital 12,210 11 TLAC-eligible own funds 86,057 OWN FUNDS AND ELIGIBLE LIABILITIES: NON-REGULATORY CAPITAL ITEMS 12 Eligible liabilities instruments issued directly by the resolution entity that are subordinated to excluded liabilities (not grandfathered) 27,825 EU-12a Eligible liabilities instruments issued by other entities within the resolution group that are subordinated to excluded liabilities (not grandfathered) EU-12b Eligible liabilities instruments that are subordinated to excluded liabilities, issued prior to 06/27/2019 (subordinated grandfathered) 4,783 EU-12c Tier-2 instruments with a residual maturity of at least one year to the extent they do not qualify as Tier-2 items 3,478 13 Eligible liabilities that are not subordinated to excluded liabilities (not grandfathered pre cap) EU-13a Eligible liabilities that are not subordinated to excluded liabilities issued prior to 06/27/2019 (pre-cap) 14 Amount of non-subordinated instruments eligible, where applicable after application of Article 72b(3) of Regulation (EU) No. 575/2013 17 TLAC-eligible liabilities items before adjustments 36,086 EU-17a – of which: subordinated liabilities OWN FUNDS AND ELIGIBLE LIABILITIES: ADJUSTMENTS TO NON-REGULATORY CAPITAL ITEMS 18 Eligible own funds and liabilities before adjustments 122,069 19 (Deduction of exposures between MPE resolution groups) 20 (Deduction of investments in other eligible liabilities instruments) 22 TLAC-own funds and eligible liabilities after adjustments 122,069 EU-22a – of which: own funds and subordinated liabilities RISK-WEIGHTED EXPOSURE AMOUNT AND LEVERAGE RATIO EXPOSURE MEASURE OF THE RESOLUTION GROUP 23 Total risk exposure amount (TREA) 456,591 24 Total exposure measure (TEM) 1,435,845 RATIO OF OWN FUNDS AND ELIGIBLE LIABILITIES 25 Own funds and eligible liabilities as a percentage of TREA 26.73% EU-25a – of which: own funds and subordinated liabilities 26 Own funds and eligible liabilities as a percentage of TEM 8.50% EU-26a – of which: own funds and subordinated liabilities 27 – CET1 (as a percentage of TREA) available after meeting the resolution group’s requirements 4.33% 28 Overall institution-specific capital buffer requirement 5.40% 29 – of which: capital conservation buffer requirement 2.50% 30 – of which: countercyclical buffer requirement 0.90% 31 – of which: systemic risk buffer requirement 1.00% EU-31a of which: Global Systemically Important Institution (G-SII) or Other Systemically Important Institution (O-SII) buffer 1.00% FOR THE RECORD EU-32 Total amount of excluded commitments indicated in article 72 bis, paragraph 2 of (EU) Regulation 75/2013 The hierarchy of creditors for the components of the TLAC is as follows in order of priority of repayment: senior non-preferred debt, subordinated debt eligible for issuance as Tier-2 capital and subordinated debt eligible for issuance as additional Tier-1 capital.
The eligible liabilities and their characteristics are published at the following address: https://www.groupebpce.com/en/investors/results-and-publications/pillar-iii/
12/31/2025 Hierarchy in the event of insolvency 1 3 5 in millions of euros (lowest rank) (highest rank) TOTAL Description of insolvency rank CET1 capital Tier-2 Senior non-preferred debt Liabilities and own funds 76,310 16,404 39,863 132,577 of which: excluded liabilities Liabilities and own funds less excluded liabilities 76,310 16,404 39,428 132,143 of which instruments eligible for the TLAC ratio 76,310 12,726 34,040 123,076 of which: residual maturity ≥ 1 year < 2 years 1,984 3,571 5,555 of which: residual maturity ≥ 2 years < 5 years 5,161 12,887 18,048 of which: residual maturity ≥ 5 years < 10 years 4,063 17,582 21,645 of which: residual maturity ≥ 10 years, but excluding perpetual securities 1,518 1,518 of which: perpetual securities 76,310 76,310 12/31/2024 Hierarchy in the event of insolvency 1 3 7 in millions of euros (lowest rank) (highest rank) TOTAL Description of insolvency rank (free text) CET1 capital Tier-2 Senior non-preferred debt Liabilities and own funds 73,847 17,649 36,393 127,888 of which: excluded liabilities Liabilities and own funds less excluded liabilities 73,847 17,649 36,393 127,888 Of which instruments eligible for the TLAC ratio 73,847 15,545 32,608 122,000 of which: residual maturity ≥ 1 year < 2 years 4,807 6,382 11,189 of which: residual maturity ≥ 2 years < 5 years 4,883 13,687 18,570 of which: residual maturity ≥ 5 years < 10 years 5,755 12,539 18,294 of which: residual maturity ≥ 10 years, but excluding perpetual securities 1,632 - 1,632 of which: perpetual securities 73,847 73,847 -
5 Credit risk
The Group’s Credit Risk division strengthened its risk management framework in 2025 with the creation of two new Group Credit policies (Asset-backed financing of private equity funds and Condominium financing) and the updating of numerous Group sector policies. In addition, the Group’s Consumer and Housing Credit policies have also been updated in line with the economic context and to cover the Group’s new activities. Both individual and portfolio supervision have been reinforced for several asset classes with stringent frameworks. In line with the difficulties encountered by the commercial real estate sector, the reinforced monitoring implemented during 2024 was maintained in 2025 in this sector. -
5.1 Credit risk management
The overall credit risk policy is governed in particular by the risk appetite framework, structured around the definition of the level of risk and risk appetite indicators. The balance between the search for profitability and the level of risk accepted is reflected in Groupe BPCE’s credit risk profile and in the Group’s credit risk policies. Groupe BPCE refrains from engaging in activities over which it has insufficient control. Activities with high risk-reward profiles are identified and strictly controlled.
In general, Groupe BPCE’s credit approval process is based first and foremost on the client’s ability to repay the loan, i.e. future cash flows, with clearly identified sources and channels and a reasonably realistic probability of occurrence.
Credit risk measurement relies on internal rating systems tailored to each category of client and transaction. The Group Risk division is responsible for defining and verifying the performance of these rating systems.
An internal rating methodology common to all Groupe BPCE institutions (specific to each client segment) is applied for “individual and professional customers”, as well as for “corporate customers”, “real estate professionals”, “project financing”, “central banks and other sovereign exposures”, “central governments”, “public-sector and similar entities” and “financial institutions”.
A dedicated governance structure is in place for the construction of all credit risk management, granting and classification systems.
Each standard, policy, system or method is the focus of workshops, organized and led by the Group Risk division teams, made up of Group representatives. The purpose of these workshops is to define the rules and expectations for each topic addressed, as it relates to the Group’s risk appetite and regulatory constraints. These topics are then decided by a Group committee made up of executive managers.
Compliance with the regulatory and internal limits on the main counterparties is regularly checked by the Group Risk and Compliance Committee and the Risk Committees of the Supervisory Board. Each institution is responsible for ensuring compliance with internal limits.
The Group Risk division also defines, for all institutions, the common framework of Level 2 permanent controls (CPN2) for credit risks and contributes to the coordination of Level 1 controls.
The Risk division is organized according to the principle of subsidiarity with a strong functional link: - each institution in Groupe BPCE has a Risk division covering credit and counterparty risks. Each institution manages its risks in accordance with Group standards and prepares a risk report every six months;
- each Head of Risk is in close contact with the Group Chief Risk Officer. The latter reports to the Chairman of the Management Board of Groupe BPCE and is a member of the Executive Management Committee.
The supervision of grants and the monitoring of portfolios declined or adapted in each Group institution are supervised within a system made up of: - credit risk policies and sector policies on credit;
- Group internal caps, internal caps for institutions in the Banque Populaire and Caisse d’Epargne networks and all BPCE subsidiaries;
- a set of Group internal limits covering the major categories of counterparties (a company made up of a parent and its subsidiaries) on a consolidated basis, for the main asset classes excluding retail, supplemented as needed by local limits; predominantly based on the internal rating approach, these methodologies are used to define the maximum risk that Groupe BPCE is willing to take;
- at each Group institution, a pro-con analysis or counter-analysis procedure involving the Risk division which holds the right to veto decisions, calling on the higher-level Credit Committee for arbitration where necessary, or the duly authorized representative.
Highlights
The requirement was also maintained for the operational integration of the main standards, rules and policies in institutions in order to guarantee uniform implementation within the Group.
Despite the persistent geopolitical and economic uncertainties loan production recovered. The number of defaults in France stabilized at a very high level. The commercial real estate sector remains strongly impacted by the economic situation, despite a gradual easing of the price of credit for individual customers. Reinforced monitoring of this sector has been put in place by the Group Risk division.
The internal caps system used across the Group, which are lower than the regulatory caps, is aimed at increasing the division of risks and is applied to all Group entities.
The internal caps system used by the institutions is lower than or equal to the Group internal caps, and is applied to the Banque Populaire and Caisse d’Epargne networks and the subsidiaries.
A Group individual limits system has also been established for the major counterparties as well as for the exposure levels concerning countries and industries. These limits apply to all Group institutions. The individual limits system in place, aimed at dividing up risks and making them individually acceptable in terms of each institution’s earning capacity and own funds, takes into account the gross exposure, i.e. without including the value of collateral, to define the maximum amount of acceptable risk for a given counterparty. The aim of this position is to neutralize the operational risk associated with the recognition of collateral and with execution in the event the institution is required to call in the collateral.
A system of limits on the asset classes deemed the most risky, such as Real Estate Professionals and Leverage Finance, has been put in place in all institutions in line with the Group’s risk appetite for these asset classes. Risk monitoring is organized on a sector-by-sector basis via a sector watch shared with all the Group’s institutions. Sector policies and limits have been established for that purpose.
On behalf of the Group Risk and Compliance Committee, the Group Risk division measures and verifies that these risk supervision mechanisms (individual and topical limits) are correctly implemented at each institution.
The Group Supervisory Board is kept informed as Group internal caps are monitored, and is notified of any possible breaches of limits defined in accordance with the risk appetite framework.
The quarterly Group risk dashboard is used to monitor consumption of risk-weighted assets in the Group’s main asset classes: it compares any differentials in terms of changes between gross exposures and consumption of RWA.
By using these systems, the Group is able to accurately monitor the change in capital needed to cover risks in each asset class, while also observing any changes in the quality of the asset classes in question.
Correlation risk is governed by a special decision-making process, where a counterparty offers its own shares as collateral. A top-up clause is systematically required on such transactions.
For wrong-way risk, usually associated with collateral swaps between credit institutions, BPCE’s liquidity reserve procedure defines this criterion as follows: “the counterparty to the repo and the securities received as collateral for that repo shall not be included in the same regulatory group”.
However, these transactions may be reviewed on a case-by-case basis, under a special decision-making process, where the collateral consists exclusively of retail loans serving to finance residential real estate.
From a regulatory standpoint, Article 118 of the order of November 3, 2014 as amended on internal control specifies that “at least once each quarter, supervised companies must perform an analysis of changes in the quality of their loan commitments”. In particular, this review should determine, for material transactions, whether any reclassifications need to be conducted among the internal risk credit risk assessment categories and, if necessary, the appropriate allocations to non-performing loans and charges to provisions.
When a counterparty is placed on either a local Watchlist (WL) or the Group WL, supervision of the counterparty in question is enhanced (Performing WL) or the decision is made to record an appropriate provision (Default WL).
Statistical provisions for performing loans, calculated at Group level for the networks in accordance with IFRS 9 requirements, are measured using a methodology validated by Group committees (reviewed by an independent unit and validated by the Risk Model Oversight Committee). These provisions include scenarios of changes in the economic environment determined each year by the Group’s Economic Research team, coupled with probabilities of occurrence reviewed quarterly by the Group Watchlist and Provisions Committee.
The allocated provisioning is calculated by taking into account the present value of the guarantees in a prudent approach.
Any defaulted exposures not covered by provisions shall be subject to enhanced justification requirements to explain why no provision has been recorded.
For credit transactions, Groupe BPCE is not required to carry out netting of on-balance sheet and off-balance sheet transactions.
Debt instruments classified as financial assets at amortized cost or at fair value through other comprehensive income, loan commitments and financial guarantees given that are not recognized at fair value through profit or loss, as well as lease receivables and trade receivables, shall be systematically impaired or covered by a provision for expected credit losses (ECL).
Impairment is recorded, for financial assets which have not been individually subject to ECL, based on observed past losses but also on reasonable and supportable DCF forecasts.
Financial instruments are divided into three categories (Stages) depending on the increase in credit risk observed since initial recognition. A specific credit risk measurement method applies to each category of instrument:
1. Stage 1 (S1) 2. Stage 2 (S2) 3. Stage 3 (S3) Loan outstandings for which credit risk has not increased materially since the initial recognition of the financial instrument. The impairment or the provision for credit risk corresponds to 12-month expected credit losses. Performing loans for which credit risk has increased materially since the initial recognition of the financial instrument are transferred to this category. The impairment or the provision for credit risk is determined on the basis of the financial instrument’s lifetime expected credit losses. Impaired exposures, within the meaning of IFRS 9, for which there is objective evidence of impairment loss due to an event which represents a known credit risk (e.g. non-repayment of a loan at its normal term, collective proceedings), occurring after the initial recognition of the instrument concerned. This category covers receivables for which a default event has been identified, as defined in Article 178 of the European regulation of June 26, 2013 on prudential requirements for credit institutions. A Group S3 Provisioning policy dedicated to the Corporate segment is being implemented. This policy lays the foundations for the calculation of loan impairment and defines the methodology for determining individual impairment based on expert opinion. It also specifies the concepts of credit risk measurement and the accounting principles for the impairment of customer receivables under IFRS and French GAAP. It details the data that must be included in a non-performing case file and a disputed case file, and included in a provisioning record.
Impairment for credit risk amounts to 12-month expected credit losses or lifetime expected credit losses, depending on the level of increase in credit risk since initial recognition (Stage 1 or Stage 2 asset). A set of qualitative and quantitative criteria is used to assess the increase in credit risk.
A significant increase in credit risk is measured on an individual basis by taking into account all reasonable and supportable information and by comparing the default risk on the financial instrument at the reporting date with the default risk on the financial instrument at the date of initial recognition. Any significant increase in credit risk shall be recognized before the transaction is impaired (Stage 3).
In order to assess a significant increase in credit risk, the Group implemented a process based on rules and criteria which apply to all Group entities:
- for the portfolios of individual customers, professionals and small and medium-sized companies, the quantitative criterion is based on the measurement of the difference between the counterparty’s rating at the time of granting and its rating at the closing date. This difference – or denotch – is measured on a master scale common to all these counterparties. The number of denotches before downgrading to Stage 2 depends on the rating at grant;
- for the large corporate, bank and specialized financing loan books, it is based on the change in rating since initial recognition;
- these quantitative criteria are accompanied by a set of qualitative criteria, including the existence of a payment more than 30 days past due, the classification of the contract as at-risk, the identification of forbearance exposure or the inclusion of the portfolio on a Watchlist;
- exposures rated by the large corporates, banks and specialized financing software tool are also downgraded to Stage 2 depending on the sector rating and the level of country risk.
The financial assets for which there is objective evidence of impairment loss due to an event representing a counterparty risk and occurring after initial recognition will be considered as impaired and classified as Stage 3. Identification criteria for impaired assets are similar to those under IAS 39 and are aligned with the default criterion. The accounting treatment of restructuring operations due to financial hardships is similar to their treatment under IAS 39.
The expected credit losses on Stage 1 or Stage 2 financial instruments are measured as the product of several inputs: - cash flows expected over the lifetime of the financial instrument, discounted at the valuation date – these flows are determined according to the characteristics of the contract, its effective interest rate and the level of prepayment expected on the contract;
- Loss Given Default (LGD);
- probabilities of default (PD), for the coming year in the case of Stage 1 financial instruments and until the contract’s maturity in the case of Stage 2 financial instruments.
The Group draws on existing concepts and mechanisms to define these inputs, and in particular on internal models developed to calculate regulatory capital requirements and on projection models used in the stress test system. Certain adjustments are made to comply with the specifics of IFRS 9.
IFRS 9 inputs: - aim to provide an accurate estimate of expected credit losses for accounting provision purposes, whereas prudential inputs are more cautious for regulatory framework purposes. Several of the safety buffers applied to prudential inputs are therefore restated;
- shall allow expected credit losses to be estimated until the contract’s maturity, whereas prudential inputs are defined to estimate 12-month expected losses. 12-month inputs are thus projected over long periods;
- shall be forward-looking and take into account the expected economic environment over the projection period, whereas prudential inputs correspond to through-the-cycle estimates (for PD) or downturn estimates (for LGD and the flows expected over the lifetime of the financial instrument). Prudential PD and LGD inputs are therefore also adjusted to reflect forecasts of future economic conditions.
Inputs are adjusted to economic conditions by defining three economic scenarios over a three-year period. The variables defined in each of these scenarios allow for the distortion of the PD and LGD inputs and the calculation of an expected credit loss for each economic scenario. Projections of inputs for periods longer than three years are based on the mean reversion principle. The models used to distort the PD and LGD inputs are based on those developed for the stress test system for consistency reasons. The models for calculating the various parameters used to calculate provisions (PD, LGD, segmentation, etc.) are regularly updated to ensure that they maintain their accuracy, meet the regulator’s expectations and more generally to improve their relevance.
The economic scenarios are associated with probabilities of occurrence, making it possible to calculate the average probable loss, which is used as the IFRS 9 impairment amount.
These scenarios are defined using the same organization and governance as those defined for the budget process, requiring an annual review based on proposals from the Economic Research department. For consistency purposes, the Baseline scenario serves as the budget scenario. Two variants – an optimistic view and a pessimistic view – are also developed around this scenario. The probability of occurrence of each scenario is reviewed on a quarterly basis by the Group Watchlist and Provisions Committee. The inputs thus defined are used to measure expected credit losses for all rated exposures, whether they were subject to the IRB or the standardized approach for the calculation of risk-weighted assets. For unrated exposures (insignificant for Groupe BPCE), prudent valuation rules are applied by default.
The IFRS 9 input validation process is fully aligned with the Group’s existing model validation process. The validation of the parameters follows a review process by an independent internal model validation unit, then the review of this work is presented to the Risk Models Oversight Committee. Finally, quarterly monitoring of recommendations by the Group Model Committee has replaced annual monitoring.
The classification of exposures as forbearance results from the combination of a ‘concession’ and ‘financial hardship’ (probable or proven). It may concern performing or non-performing contracts. These forbearance credit restructurings are designed to help the debtor cope with financial difficulties and ultimately meet its commitments. Forbearance only applies to the exposure concerned, i.e. to the ‘Forborne’ contract. This status is not contagious to the other exposures of the same debtor.
A situation of forced restructuring, a situation of over-indebtedness proceedings or any kind of default within the meaning of the Group standard implies qualification as “forbearance/non-performing”
-
5.2 Risk measurement and internal ratings
12/31/2025 Customer segment Banque Populaire
networkCaisse d’Epargne
networkCrédit
Foncier/Banque
Palatine/BPCE
International
subsidiariesNatixis BPCE SA Central banks and other sovereign exposures Standard** Standard Standard Standard** Standard** Central administrations Standard** Standard Standard Standard** Standard** Public sector and similar entities Standard Standard Standard Standard Standard Financial institutions IRBF/Standard IRBF/Standard Standard IRBF*** IRBF/Standard Corporate customers (Rev.* >€3m) IRBA/IRBF/Standard IRBA/IRBF/Standard Standard IRBA/IRBF***/Standard Standard Retail IRBA IRBA Standard Standard Standard - * Revenue.
- ** The “Sovereign” customer segment switched to the “permanent” Standard approach by the ECB decision letter of 09/19/2024.
- *** Within the Natixis scope, financial institutions and some Corporates are switching from the IRBA approach to the IRBF approach following the entry into force of CRR3.
12/31/2024 Customer segment Banque Populaire
networkCaisse
d’Epargne networkCrédit
Foncier/Banque
Palatine/BPCE
International
subsidiariesNatixis BPCE SA Central banks and other sovereign exposures Standard** Standard Standard Standard** Standard** Central administrations Standard** Standard Standard Standard** Standard** Public sector and similar entities Standard Standard Standard Standard Standard Institutions IRBF Standard Standard IRBA IRBF Corporate customers (Rev.* >€3m) IRBF/Standard IRBF/Standard Standard IRBA Standard Retail IRBA IRBA Standard Standard Standard - * Revenue.
- ** The “Sovereign” customer segment switched to the “permanent” Standard approach by the ECB decision letter of 09/19/2024.
The Oney subsidiary is approved for credit models applicable to retail customers in France. The Portugal, Spain, Russia, Hungary and Poland scopes use the standardized approach.
Groupe BPCE conducted a review of its IRB system during the 2025 fiscal year and established an overall strategy at Group level, based on objective and clearly defined criteria, to determine the choice of the most appropriate approach (IRB or standard approach) for calculating the capital requirements of a given scope, in order to ensure a better overall coherence of the system.
12/31/2025 12/31/2024 EAD EAD In % Standard IRBF IRBA Standard IRBF IRBA Central banks and other sovereign exposures 100.0% 0.0% 0.0% 100.0% 0.0% 0.0% Central administrations 99.7% 0.3% 0.0% 90.5% 0.0% 9.5% Public sector and similar entities 99.8% 0.2% 0.0% 99.9% 0.1% 0.0% Financial institutions 39.8% 60.2% 0.0% 42.7% 16.2% 41.2% Corporate customers 34.3% 33.7% 32.0% 34.8% 16.8% 48.4% Retail 6.9% 0.0% 93.1% 6.5% 0.0% 93.5% Total 43.4% 11.2% 44.0% 40.5% 5.9% 52.0% Internal rating system models are developed based on historical data for observed defaults and losses. They are used to measure the credit risks to which Groupe BPCE is exposed, expressed as a one-year Probability of Default (PD), as a Loss Given Default (LGD) and as Credit Conversion Factors (CCF), depending on the characteristics of the transactions.
These internal rating systems are also applied to risk supervision, authorization systems, internal limits on counterparties, etc. and may also serve as a basis for other processes, such as statistical provisioning.
The resulting risk metrics are then used to calculate capital requirements once they have been validated by the supervisory authority in compliance with regulatory requirements.
The internal governance of rating systems is centered on the development, validation, monitoring, and modification of decisions linked to the evolution of these systems.
The Groupe BPCE Risk division is responsible for reviewing the Group’s internal models whenever a new model is being developed or an existing model changed. It also performs the annual review of backtests on credit, market and Asset/Liability management risk models.
The following table lists the internal credit models used by the Group for risk management purposes and, where authorized by the supervisor, to calculate capital requirements for the Banque Populaire and Caisse d’Epargne networks, Natixis and its subsidiaries, Crédit Foncier and Banque Palatine.
Exposure class Portfolio Number of probability of
default (PD) and management
rating modelsDescription/Methodology Sovereigns, central governments and central banks Sovereigns and affiliates 1 (NA*) Expert criteria including quantitative and qualitative economic and descriptive variables - Portfolio with low default risk Multilateral development banks 1 Expert criteria - Portfolio with low default risk Public sector Municipalities (communes), departments, regions, social housing, hospitals, etc. 6 (NA*) Expert criteria/statistical modeling (logistic regression) - Portfolio with low default risk Institutions OECD or non-OECD banks, multilateral development banks 2 Expert criteria - Portfolio with low default risk Corporate customers Large corporates (Rev. >€1 billion) 7 Expert criteria including quantitative and qualitative variables, depending on the business sector - Portfolio with low default risk Small and medium-sized companies (Rev. >€3 million) 10 (o/w 2 NA*) Statistical models (logistic regression) or flat scores, on companies publishing parent company or consolidated financial statements, mainly based on balance sheet data depending on the business sector, and banking behavior/history Insurance of which mutual insurance 1 Expert criteria including quantitative and qualitative variables - Portfolio with low default risk Associations 1 Statistical model with quantitative and qualitative variables Specialized financing (real estate, asset pool, aircraft, etc.) 6 (o/w 1 NA*) Expert criteria based on features of the financed goods/projects - Portfolio with low default risk Leasing 2 Statistical models (logistic regression), mainly based on balance sheet data depending on the business sector, and banking behavior Retail Individual customers 7 Statistical models (logistic regression) including behavioral and socioeconomic variables, differentiated by customer profile Professional customers (socioeconomic category differentiated according to certain sectors) 5 Statistical models (logistic regression) including balance sheet and behavioral variables Leasing 2 Statistical models (logistic regression) including balance sheet and behavioral variables Residential real estate 3 Statistical models (logistic regression) including behavioral and socioeconomic variables, differentiated by customer profile Revolving loans 7 Statistical models (logistic regression) including behavioral and socioeconomic variables Exposure class Portfolio Number of
LGD models
(loss given
default)Description/Methodology Number of CCF/
EAD models
(exposure given
default)Description/Methodology Sovereigns, central governments and central banks Sovereigns and affiliates 1 (NA) Expert criteria including quantitative and qualitative variables Institutions Banks 1 (NA) Expert criteria including quantitative and qualitative variables Corporate customers General case 7 (o/w 1 NA) Models based on estimated losses, segmented by type of contract and guarantee, or expert criteria 2 (o/w 1 NA) Conversion factors, applicable to revolving exposures Leasing 4 Models based on estimates of asset resale conditions, segmented by type of asset financed Specialized financing (real estate, asset pool, aircraft, etc.) 4 Models based on estimates of asset resale conditions or future cash flows Retail Residential real estate 4 Models based on estimated losses, segmented by type of contract and guarantee Other individual and professional customers 4 Models based on estimated losses, segmented by type of contract and guarantee 2 Conversion factors, applicable to revolving exposures Leasing 4 Models based on estimates of asset resale conditions, segmented by type of asset financed Revolving loans 2 Models based on estimated losses, segmented by type of contract 2 Conversion factors, applicable to revolving exposures With the entry into force of the CRR 3 regulation on January 1, 2025, the CCF (conversion factors) models are limited to revolving exposures. Other exposures are treated with fixed values.
The models dealing with leasing exposures within the scope of BPCE Equipment Solutions have been added to this table.
For retail customers, Groupe BPCE has established standardized internal ratings-based methods and centralized ratings applications used to assess the credit quality of its loan books for better risk supervision. For the Banque Populaire and Caisse d’Epargne networks, they are also used to determine capital requirements under the Advanced IRB method.
The probability of default of retail customers is modeled by the Risk department, based in large part on the banking behavior of the counterparties. The models are segmented by type of customer, distinguishing between individual and professional customers (with or without balance sheets) and according to products owned. The counterparties in each segment are automatically classified using statistical models (usually logistic regression models) into similar and statistically separate risk categories. Probability of default is estimated for each of these categories, based on the observation of average default rates over the longest period possible so as to obtain a period representative of the possible variability of the observed default rates. These estimates are systematically adjusted by applying margins of conservatism to cover any uncertainties. For comparison purposes, risk reconciliation is carried out between internal ratings and agency ratings.
Loss given default (LGD) is an economic loss measured by incorporating all inherent factors in a transaction as well as the costs incurred during the collection process. LGD estimation models for retail customers are applied specifically to each network. LGD values are first estimated by product, and based on whether or not any collateral has been provided. Other factors may also be considered secondarily, where they can be used to statistically distinguish between degrees of loss. The estimation method employed is based on the observation of marginal collection rates, depending on how long the customer has been in default. The advantage of this method is that it can be directly used to estimate LGD rates applied to performing loans and ELBE rates applied to loans in default. Estimates are based on internal collection histories for exposures at default over an extended period. Two margins of conservatism are then systematically added: the first to cover estimate uncertainties and the second to mitigate any economic slowdown effect.
Groupe BPCE uses two models to estimate EAD. The first estimates a Credit Conversion Factor (CCF) for off-balance sheet exposures. This model is automatically applied when off-balance sheet exposures are deemed material (i.e. exceeding the limits set for each type of product). The second estimates a flat increase in the balance sheet for non-material off-balance sheet exposures.
Groupe BPCE has comprehensive systems for measuring non-retail customer risks, using either the Foundation IRB or Advanced IRB approach depending on the network and the customer segment. These systems can also be used to assess the credit quality of its loan books for better risk supervision.
The rating system consists in assigning a score to each counterparty. Given the Group’s cooperative structure, a network of officers is responsible for determining the client’s rating for the Group based on the uniqueness of the score. The score assigned to a counterparty is usually suggested by a model, then adjusted and validated by Risk division experts after they perform an individual analysis. This process is applied to the entire Non-Retail portfolio, except the new models reserved for Small Businesses, which are automatically rated (as with the Retail portfolio). The counterparty rating models are mainly structured according to the type of counterparty (corporates, financial institutions, public sector entities, etc.) and size of the company (measured by its annual revenues). When volumes are sufficient (SMEs, mid-sized companies, etc.), the models rely on statistical modeling (logistic regression methods) of client defaults, combined with qualitative questionnaires.
Failing that, grids built by experts are used. These consist of quantitative elements (financial ratios, solvency, etc.) derived from financial data and qualitative elements assessing the client’s economic and strategic dimensions.
The rating methodologies for low-default portfolios are expert-based; qualitative and quantitative criteria (corresponding to the characteristics of the counterparty to be rated) are used to link the counterparty to a score and a rating, which is then linked to a PD. This PD is based on observation of external default data, but also on internal rating data. A PD scale cannot be quantified due to the low number of internal defaults.
With respect to country risk, the system is based on sovereign ratings and country ratings that limit the ratings that can be given to non-sovereign counterparties. The rating scale is built using past Standard & Poor’s ratings to ensure the direct comparability in terms of risks with the rating agencies.
For the new Small Businesses, High Segment, SCI and NGO modules, dedicated scales per model have been defined for regulatory calculations. These scales are connected with the rating scale for internal risk management. For statistical models, the calibration of probabilities of default on the scales defined for regulatory calculations is based on the same principles as those set out for retail customers (in particular the historic representation of default rates, as well as the estimation of uncertainty margins).
LGD models (excluding retail customers) are predominantly applied by type of counterparty, type of asset, and whether or not any collateral has been provided. Similar risk categories are then defined, particularly in terms of collections, procedures and type of environment. LGD estimates are assessed on a statistical basis if the number of defaults is high enough (e.g. for the Corporate customers asset class). Past internal data on collections covering the longest possible period are used. If the number of defaults is not high enough, external databases and benchmarks are used to determine expert rates (e.g. for banks and sovereigns). Finally, some values are based on stochastic model, for loans in collection. Downturn LGD is checked and margins of conservatism are added if necessary.
Groupe BPCE uses two models to estimate EAD for corporates. The first estimates a Credit Conversion Factor (CCF) for off-balance sheet exposures. This model is automatically applied when off-balance sheet exposures are deemed material (i.e. exceeding the limits set for each type of product). The second estimates a flat increase in the balance sheet for non-material off-balance sheet exposures.
The “risk measurement and internal ratings” section describes the various approved models used by Groupe BPCE for the different exposures classes. Where the Group does not have an internal model authorized for use in determining capital requirements for a given exposure class, they have to be estimated based on corresponding inputs under the standardized approach. These inputs are based in particular on the credit assessments (ratings) performed by rating agencies recognized by the supervisory authority as meeting ECAI (External Credit Assessment Institutions) requirements, such as Fitch Ratings, Moody’s, Standard & Poor’s, and Banque de France for Groupe BPCE.
In accordance with Article 138 of Regulation (EU) 575/2013 (Capital Requirements Regulation or CRR) on capital requirements for credit institutions and investment firms, where a counterparty has been rated by several rating agencies, the counterparty’s rating is determined on the basis of the second highest rating.
When an external credit rating directly applicable to a given exposure is required and exists for the issuer or for a specific issuance program, the procedures used to determine the weighting are applied in accordance with CRR Article 139.
For fixed-income securities (bonds), short-term external ratings of the bond take precedence over external ratings of the issuer. If there are no external ratings for the bond, the issuer’s long-term external rating is taken into account for senior debt only, except in the specific case of exposure to institutions whose risk weight is derived from the credit rating of the sovereign country in which it is established.
All three credit risk inputs are subject to yearly backtesting in order to verify the performance of the rating system. More specifically, backtesting is aimed at measuring the overall performance of models used, primarily to ensure that the model’s discriminating power has not declined significantly relative to the modeling period. The parameters used in EAD calculations are also backtested
Observed default rates are then compared with estimated default rates for each rating. Ratings are checked for through-the-cycle applicability. More specifically, for portfolios with low default rates (public sector and social housing, large corporates, banks, sovereigns and specialized financing), a detailed analysis is carried out using additional indicators, including more qualitative analyses, among other things.
The scope of LGD default values is consistent with the values observed, i.e. limited exclusively to exposures at default. Estimated values therefore cannot be directly compared with LGD values measured in the outstanding portfolio. Downturn LGDs are also verified.
Backtesting results may call for the implementation of action plans if the system is deemed not sufficiently prudent or effective. The backtesting results and the associated action plans are discussed by First Line of Defense Committees (LoD1) and then reviewed by the Second Line of Defense Committees (LoD2) (see internal rating system governance).
On the basis of these exercises, the rating system has been deemed satisfactory overall in terms of effective risk management. Moreover, the calibrations of risk parameters remain conservative on the whole, relative to actual risk observations.
Impacts on the amount of guarantees the institution is required to give in the event its credit rating is downgraded
The CRR2 and the Delegated act require institutions to report to the competent authorities any contracts the conditions of which lead to additional liquidity outflows following a material deterioration of the credit quality of the institution (e.g. a downgrade in its external credit assessment by three notches). The institution shall regularly review the extent of this deterioration in light of what is relevant under the contracts it has entered into and shall notify the result of its review to the competent authorities (CRR 423.2/AD 30.2).
The competent authorities decide the weighting to be assigned to contracts deemed to have a material impact.
For contracts containing early exit clauses on master agreements (framework agreements between the bank and a counterparty for OTC derivative transactions without collateral), the early termination clause allows one counterparty to terminate the contract early following the deterioration of the credit quality of the other counterparty. Accordingly, the number of early terminations generated by credit quality deterioration shall be estimated.
It was agreed that the Group would measure outflows generated by reviewing all the Group’s master agreements or credit support annexes on the OTC market, in order to assess the amount of the deposit/collateral required following a downgrade of three notches in the institution’s long-term credit rating by three rating agencies (Moody’s, S&P, Fitch). The calculation also includes the amount of the deposit/collateral required following a downgrade of one notch in the institution’s short-term credit rating, with the Group considering such a downgrade inevitable if the institution’s LT credit rating is downgraded three notches.
At Groupe BPCE level, the calculation covers BPCE SA, Natixis, Crédit Foncier and their funding vehicles: BP CB, GCE CB, BPCE SFH, FCT HL, SCF and VMG. Some intragroup contracts generate outflows at the individual institution level, but are neutralized at the Groupe BPCE consolidated level.
- the impact for each contract is the maximum amount between the three rating agencies between a 1-notch downgrade in the ST rating and a 3-notch downgrade in the LT rating;
- the amount of ratings triggers reported is the sum of all impacts of a 1-notch downgrade in the ST rating and a 3-notch downgrade in the MLT rating;
- the assumption is made that all external ratings are downgraded simultaneously by the three agencies and for all rated entities;
- as the national competent authority has not issued a recommendation, a weighting of 100% is applied to reported out flows for the calculation of the LCR.
-
5.3 Use of credit risk mitigation techniques
Credit risk mitigation techniques are widely used within the Group and are divided into real guarantees and personal guarantees.
A distinction is made between guarantees having an actual impact on collections in the event of hardships and guarantees recognized by the supervisory authority in the weighting of exposures used to reduce capital consumption. For example, a personal and joint guarantee provided in due form by a company director who is a customer of the Group, and collected in accordance with regulations, may be effective without being eligible as a statistical risk mitigation factor.
In some cases, the Group’s institutions choose, in addition to employing risk mitigation techniques, to take opportunities to sell portfolios of disputed loans, particularly when the techniques used are less effective or non-existent.
Credit derivatives are also used to reduce risks, and apply almost exclusively to the Corporate customers asset class (and mainly Natixis).
A real guarantee involves one or more solidly measured movable or immovable assets that belong to the debtor or a third party. This guarantee consists of granting the creditor a real right to said asset (mortgage, pledge of real property, pledge of listed liquid securities, pledge of listed liquid merchandise with or without divestiture, pledge, third party guarantee, etc.).
- reduce the credit risk incurred on an exposure, given the rights of the institution subject to exposure, in the event of default or other specific credit events affecting the counterparty;
- obtain the transfer of ownership of certain amounts or assets.
A personal guarantee is collateral that reduces the credit risk on an exposure, due to the commitment provided by a third party to pay a set amount if the counterparty defaults or due to any other specific event.
Under the standardized approach: Under the IRB approach: For retail customers under the IRBA approach: Personal guarantees and real guarantees are accounted for, subject to eligibility, using an enhanced weighting of the guarantee portion of the exposure. Real guarantees such as cash or liquid collateral are deducted from the gross exposure. Excluding retail customers, real guarantees are taken into account, subject to eligibility, by decreasing the Loss Given Default applicable to the transactions. Personal guarantees are recognized, subject to eligibility, by substituting a third party’s PD with that of a guarantor.
The Banque Populaire and Caisse d’Epargne networks are implementing the IRB approach, with a last production batch in January 2026 (SCI scope). It should be noted that the major corporate customers of the Caisse d’Epargne network are not yet implementing the IRB approach.
Personal and real guarantees are taken into account, subject to eligibility, by decreasing the Loss Given Default applicable to the transactions. Articles 207 to 210 of Regulation (EU) 2024/1623 of May 31, 2024, amending Regulations (EU) No. 2019/876 and No. 575/2013, set out the conditions for the recognition of guarantees, in particular:
- the credit quality of the obligor and the value of the collateral shall not have a material positive correlation. Securities issued by the obligor shall not qualify as eligible collateral;
- the institution shall properly document the collateral arrangements and have in place clear and robust procedures for the timely liquidation of collateral;
- the institution shall have in place documented policies and practices concerning the types and amounts of collateral accepted;
- the institution shall calculate the market value of the collateral, and revalue it accordingly, whenever it has reason to believe that a significant decrease in the market value of the collateral has occurred.
The division of risks is a credit risk mitigation technique. In practice, individual or topical caps and limits are defined, thus reducing the bank’s sensitivity to risks deemed excessive, either individually or industry-wide, in the event of a major incident.
Risk supervision activities may be implemented to reduce exposure to a given risk if it is deemed too high. They also contribute to effective division of risks.
The division of risks is a credit risk mitigation technique. It is reflected in the individual or topical limit systems and helps reduce each institution’s sensitivity to risks considered either individually or sectorially to be too significant to carry in the event of major incidents.
The Banque Populaire network has historically used professionals and mutual guarantee companies (such as SOCAMAs, which guarantee loans to craftspeople) to secure its loans, in addition to the real guarantees used.
For loans to individual customers, it also turns to CASDEN Banque Populaire (and primarily its Parnasse Garanties structure) to back loans to all civil servants, to Crédit Logement and increasingly to Compagnie Européenne de Garanties et Cautions (CEGC, a subsidiary of BPCE SA).
For home loans, the Caisse d’Epargne network mainly calls on CEGC, FGAS (Fonds de garantie à l’accession sociale à la propriété) and, to a lesser extent, Crédit Logement (a financial institution and a subsidiary of most of the main French banking networks). These institutions specialize in the provision of guarantees for bank loans (predominantly home loans).
FGAS offers guarantees from the French government for secured loans. Loans covered by FGAS guarantees granted before December 31, 2006 are given a 0% risk weight, and loans covered by guarantees granted after that date have a risk weight of 15%.
For their home loans, the Banque Populaire and Caisse d’Epargne networks also use several mutual insurers, such as MGEN, Mutuelle de la Gendarmerie, etc.
For professional and corporate customers, the entire Group still uses Banque Publique d’Investissement, while calling on the European Investment Fund or European Investment Bank for guarantee packages in order to substantially reduce credit risk.
In some cases, organizations such as Auxiga are used for the seizure of inventory and the transfer of its ownership to the bank as collateral for commitments made in the event of financial hardships.
Finally, on an occasional basis, Natixis purchases credit insurance for certain transactions and in some circumstances, from private for example (SCOR) or public (Coface, Hermes, other sovereign agencies) reinsurance companies, while also making use of Credit Default Swaps (CDS).
In light of the Covid crisis, the French government allowed its guarantee to be used within the scope of the SGLs granted. Groupe BPCE used this option.
Credit derivatives serving as currency or interest rate hedges are entrusted to approved clearing houses in Europe or the US for Natixis operations in this country.
By type of guarantor: - for home loan exposures, most collateral takes the form of mortgages (risk diversified by definition, bank better protected by basing credit approval decisions on client income), insurance-oriented guarantees such as those provided by CEGC (a subsidiary of Groupe BPCE, subject to regular stress testing), Crédit Logement (providing guarantees to multiple banks subject to the same constraints), FGAS (controlled by the French State, considered equivalent to sovereign risk). The CASDEN guarantee, issued to government employees, currently offers solid resilience according to a model based on the robust income of this particular customer base;
- for professional customer exposures, the most common guarantees are those provided by the Banque Publique d’Investissement (BPI), subject to strict formal constraints, and mortgages. Guarantees provided by institutions such as SOCAMAs, whose solvency depends on the credit institutions of Groupe BPCE, are also used;
- for corporate customers, the main guarantees used are Banque Publique d’Investissement mortgages and guarantees.
By credit derivative providers: - the regulations require the use of clearing houses for interest rate risk on the new flow. This security does not, however, cover the counterparty default risk, which is a granular risk. Volumes of collateral provided by clearing houses are gradually on the rise, generating a regulated and supervised risk;
- the currency risk is hedged at the level of each contract with the introduction of margin calls at a frequency appropriate to the risk. These transactions are matched to interbank counterparties specializing in this type of transaction, within the framework of individual limits authorized by the Group Credit Committee and counterparties.
By credit sector: - Groupe BPCE has established sector-specific mechanisms to guide the guarantee policy based on the business sector in question. Appropriate recommendations are issued to the institutions.
By geographic area: - Groupe BPCE is mainly exposed to France and, via Natixis, to other countries to a lesser extent. As a result, most guarantees are located in France.
Groupe BPCE has an automatic valuation tool for real-estate guarantees available to all its networks.
Across the Banque Populaire network, in addition to real guarantees, the valuation tool also takes into account pledges of vehicles, equipment and tools, pleasure craft, and business assets.
The Caisse d’Epargne network uses the revaluation engine for real estate guarantees in all its risk segments.
Within the Group, the guarantees from Mutual Guarantee Companies recognized as providers of sureties considered equivalent to mortgages by the supervisory body are subject to a credit insurance valuation.
An enhanced Group valuation process was established to measure real estate guarantees above certain amounts. The certification obtained by BPCE Solutions immobilières (formerly Crédit Foncier Expertise), a subsidiary of BPCE since the decision was made to place CFF under run-off management, strengthens the Group’s synergies.
Guarantees other than those referred to above are assessed and validated on the basis of a systematic valuation, either according to market value where the guarantees are quoted on liquid markets (e.g. listed securities), or based on expert opinion demonstrating the value of the guarantee used to hedge risks (e.g. the value of recent transactions on aircraft or ships according to their characteristics, the value of commodity holdings, the value of a pledge given on merchandise, or the value of a business based on its location, etc.).
-
5.4 Quantitative information
Groupe BPCE ’ s total gross exposures amounted to more than € 1,552 billion on December 31, 2025, up by € 41 billion.
The gross exposures are very predominantly located in Europe, especially in France, for all asset classes.
12/31/2025 12/31/2024 Concentration by borrower Distribution
Gross amount/
Total major risks*Weighting in
relation to capital
Gross amount/
Capital**Distribution
Gross amount/
Total major risks*Weighting in
relation to capital
Gross amount/
Capital**No. 1 borrower 5.7% 18.3% 6.4% 21.9% Top 10 borrowers 21.8% 69.9% 23.4% 79.2% Top 50 borrowers 51.0% 163.6% 53.1% 180.0% Top 100 borrowers 68.8% 220.7% 70.4% 238.6% - * Total large exposures excluding sovereigns for Groupe BPCE large scope (€244.8 bn at 12/31/2025).
- ** Regulatory capital, Groupe BPCE large scope (line 11 CA4 of Corep at 12/31/2025): €76.3 bn.
The percentage of the Top 100 borrowers was slightly up over the fiscal year and did not show any particular concentration.
In 2025, the cost of risk amounted to €2,465 million, up by 20% year-on-year. It can be broken down as follows:
- on performing loans classified as Stage 1 or Stage 2: €62 million reversal provision in 2025 compared with €177 million reversed in 2024;
- the provisions for performing loans classified as Stage 3 went from €2,238 million in 2024 to €2,527 million in 2025.
In 2025, Groupe BPCE’s cost of risk stood at 28 bps in relation to gross customer loan outstandings (24 bps in 2024). It included a provision reversal on performing loans of 1 bp (compared with a reversal of 2 bps in 2024) and an allocation of 29 bps for proven risks (compared with an allocation of 26 bps in 2024).
The cost of risk stood at 29 bps for the Retail Banking and Insurance division (24 bps in 2024), including a provision reversal for performing loans of 2 bps (as in 2024) and an allocation of 30 bps on outstandings with proven risk (compared with a provision of 26 bps in 2024).
The Corporate & Investment Banking cost of risk amounted to 30 bps (40 bps in 2024) including a reversal of 4 bps for provisioning of performing loans (compared with a reversal of 6 bps in 2024) and a provision of 26 bps on outstandings with proven risk (compared with a provision of 46 bps in 2024).
The ratio of non-performing loans to gross loan outstandings stood at 2.7% on December 31, 2025, up by 0.2 pp from the end of December 2024.
in millions of euros 12/31/2025 12/31/2024 Gross loan outstandings to customers and credit institutions 1,015,914 980,988 O/w S1/S2 outstandings 988,515 956,647 O/w S3 outstandings 27,399 24,341 Ratio of non-performing/gross loan outstandings 2.7% 2.5% S1/S2 impairments recognized 4,962 5,047 S3 impairments recognized 10,791 9,703 Impairments recognized/non-performing loans 39.4% 39.9% Coverage ratio (including guarantees related to impaired outstandings) 62.9% 68.2% 12/31/2025 a b c d e f g h Gross carrying amount/Nominal amount of exposures with forbearance
measuresAccumulated impairment, accumulated
negative changes in fair value due to credit
risk and provisionsCollaterals received and financial
guarantees received on forborne exposuresNon-performing forborne Of which: Collateral and
financial guarantees received
on non-performing exposures
with forbearance measuresin millions of euros Performing forborne Of which defaulted Of which impaired On performing
forborne exposuresOn non-performing
forborne exposures010 Loans and advances 3,696 8,395 8,395 8,395 (171) (2,502) 6,462 4,125 020 Central banks 4 4 4 (4) 030 General governments 15 15 15 15 (5) 2 2 050 Other financial corporations 13 47 47 47 (1) (31) 5 5 060 Non-financial corporations 1,721 4,257 4,257 4,257 (96) (1,466) 2,719 1,817 070 Households 1,947 4,072 4,072 4,072 (74) (996) 3,736 2,301 080 Debt Securities 4 4 4 (4) 090 Loan commitments given 134 46 46 46 (5) (6) 27 14 100 TOTAL 3,830 8,445 8,445 8,445 (176) (2,512) 6,489 4,139 12/31/2024 a b c d e f g h Gross carrying amount/Nominal amount of exposures with forbearance
measuresAccumulated impairment, accumulated
negative changes in fair value due to credit
risk and provisionsCollaterals received and financial
guarantees received on forborne exposuresNon-performing forborne Of which: Collateral and
financial guarantees received
on non-performing exposures
with forbearance measuresin millions of euros Performing forborne Of which defaulted Of which impaired On performing
forborne exposuresOn non-performing
forborne exposures010 Loans and advances 3,620 7,260 7,260 7,260 (162) (2,171) 5,999 3,748 020 Central banks 4 4 4 (4) 030 General governments 6 3 3 3 (2) 040 Credit institutions 050 Other financial corporations 12 45 45 45 (1) (30) 6 5 060 Non-financial corporations 1,742 3,489 3,489 3,489 (89) (1,287) 2,420 1,535 070 Households 1,860 3,719 3,719 3,719 (72) (848) 3,573 2,208 080 Debt securities 4 4 4 (4) 090 Loan commitments given 33 43 43 43 (1) (3) 34 14 100 TOTAL 3,653 7,307 7,307 7,307 (163) (2,178) 6,033 3,762 12/31/2025 a b c d e f g h i j k l n o Gross carrying amount/nominal amount Accumulated impairment, accumulated negative changes
in fair value due to credit risk and provisionsCollaterals and
financial guarantees
receivedPerforming exposures Non-performing exposures Performing exposures –
Accumulated impairment
and provisionsNon-performing exposures -
Accumulated impairment,
accumulated negative
changes in fair value due to
credit risk and provisionsOn
performing
exposuresOn non-
performing
exposuresin millions of euros of which:
stage 1of which:
stage 2 (1)of which:
stage 2 (1)of which:
stage 3 (1)of which:
stage 1of which:
stage 2 (1)of which:
stage 2 (1)of which:
stage 3 (1)005 Cash balances at central banks and other demand deposits 137,645 137,400 238 010 Loans and advances 985,238 859,632 122,127 27,400 26,375 (4,962) (1,194) (3,764) (10,791) (10,350) 563,012 11,865 020 Central banks 3,156 3,148 7 19 15 (1) (1) (19) (15) 030 General governments 158,141 152,644 4,762 100 98 (22) (9) (13) (49) (48) 3,371 2 040 Credit institutions 6,531 6,275 256 6 1 (4) (3) (1) (5) (1) 868 050 Other financial corporations 26,796 25,746 1,050 209 192 (45) (29) (16) (163) (146) 5,877 36 060 Non-financial corporations 343,255 281,836 58,694 17,801 16,837 (3,505) (822) (2,680) (7,471) (7,065) 174,797 7,081 070 Of which: SMEs 170,459 135,434 34,940 9,900 9,581 (2,316) (422) (1,892) (3,930) (3,795) 111,366 4,336 080 Households 447,359 389,983 57,358 9,265 9,232 (1,385) (331) (1,053) (3,084) (3,075) 378,099 4,746 090 Debt Securities 92,814 85,532 803 275 270 (36) (19) (17) (244) (240) 921 100 Central banks 1,367 1,367 110 General governments 60,637 59,349 108 (6) (3) (3) 512 120 Credit institutions 12,203 11,979 94 (8) (7) 130 Other financial corporations 11,497 6,521 394 231 231 (11) (3) (8) (210) (210) 285 140 Non-financial corporations 7,110 6,316 207 44 39 (11) (6) (6) (34) (30) 124 150 Off-balance sheet exposures 236,190 213,505 15,151 1,135 1,064 (593) (206) (386) (322) (307) 43,058 284 160 Central banks 174 174 170 General governments 10,344 8,125 416 (2) (1) (1) 673 180 Credit institutions 14,329 10,844 151 6 6 (3) (3) 123 190 Other financial corporations 33,135 31,483 583 10 10 (6) (5) (2) (2) (2) 3,452 3 200 Non-financial corporations 144,201 130,002 12,894 1,061 992 (493) (144) (348) (309) (295) 32,068 268 210 Households 34,007 32,877 1,107 58 56 (89) (53) (35) (11) (10) 6,742 13 220 Total 1,451,887 1,296,069 138,319 28,810 27,709 (5,591) (1,419) (4,167) (11,357) (10,897) 606,991 12,149 12/31/2024 a b c d e f g h i j k l n o Gross carrying amount/nominal amount Accumulated impairment, accumulated negative changes
in fair value due to credit risk and provisionsCollaterals and
financial guarantees
receivedPerforming exposures Non-performing exposures Performing exposures –
Accumulated impairment
and provisionsNon-performing exposures -
Accumulated impairment,
accumulated negative
changes in fair value due to
credit risk and provisionsOn
performing
exposuresOn non-
performing
exposuresin millions of euros of which:
stage 1of which:
stage 2 (1)of which:
stage 2 (1)of which:
stage 3 (1)of which:
stage 1of which:
stage 2 (1)of which:
stage 2 (1)of which:
stage 3 (1)005 Cash balances at central banks and other demand deposits 136,008 135,846 156 9 010 Loans and advances 954,306 816,245 134,267 24,344 23,321 (5,054) (1,066) (3,983) (9,703) (9,298) 551,097 10,206 020 Central banks 1,592 1,584 7 19 15 (1) (1) (19) (15) 030 General governments 155,886 150,412 4,591 74 68 (24) (8) (15) (50) (48) 3,279 6 040 Credit institutions 4,492 4,303 190 16 11 (10) (7) (3) (11) (6) 923 050 Other financial corporations 23,849 22,805 851 137 118 (43) (23) (20) (103) (85) 3,637 13 060 Non-financial corporations 328,755 263,439 62,614 15,825 14,892 (3,530) (717) (2,809) (6,821) (6,467) 171,480 5,741 070 Of which: SMEs 153,092 116,851 36,139 8,752 8,461 (2,178) (348) (1,828) (3,474) (3,394) 101,080 3,464 080 Households 439,732 373,702 66,014 8,273 8,217 (1,446) (311) (1,135) (2,699) (2,677) 371,778 4,446 090 Debt Securities 86,519 79,036 787 318 311 (28) (21) (7) (246) (242) 1,034 100 Central banks 1,383 1,383 110 General governments 56,116 54,790 81 (3) (2) (1) 573 120 Credit institutions 10,695 10,333 197 (7) (7) 130 Other financial corporations 11,114 6,100 458 269 266 (10) (6) (4) (208) (208) 258 140 Non-financial corporations 7,211 6,430 51 49 45 (8) (6) (2) (38) (34) 203 150 Off-balance sheet exposures 232,898 204,321 17,614 1,429 1,179 (526) (195) (331) (408) (343) 40,739 249 160 Central banks 199 199 170 General governments 11,893 8,187 592 3 3 (1) (1) 512 180 Credit institutions 12,511 9,007 317 5 5 (12) (4) (7) 443 190 Other financial corporations 30,248 28,740 895 18 18 (6) (4) (1) (2) (2) 2,553 6 200 Non-financial corporations 145,027 126,415 14,600 1,314 1,068 (422) (132) (292) (391) (326) 31,235 227 210 Households 33,020 31,773 1,210 89 85 (85) (55) (30) (15) (15) 5,996 16 220 Total 1,409,731 1,235,448 152,824 26,091 24,811 (5,608) (1,282) (4,321) (10,357) (9,883) 592,879 10,455 12/31/2025 a b c d e f g h i j k l Gross carrying amount / Nominal amount Performing exposures Non-performing exposures in millions of euros Not past
due or
Past due
≤ 30 daysPast due
> 30 days
≤ 90 daysUnlikely
to pay
that are
not past-
due or
past-due
≤ 90 daysPast due
> 90 days
≤ 180 daysPast due
> 180
days
≤ 1 yearPast due
> 1 year
≤ 2 yearsPast due
> 2 years
≤ 5 yearsPast due
> 5 years
≤ 7 yearsPast due
> 7 yearsOf which
defaulted005 Cash balances at central banks and other demand deposits 137,645 137,645 010 Loans and advances 985,238 982,011 3,227 27,400 21,915 1,281 1,319 1,432 974 149 330 27,376 020 Central banks 3,156 3,156 19 4 15 19 030 General governments 158,141 158,008 133 100 45 1 9 6 6 33 100 040 Credit institutions 6,531 6,462 69 6 6 6 050 Other financial corporations 26,796 26,679 117 209 107 29 29 12 3 29 209 060 Non-financial corporations 343,255 341,140 2,115 17,801 14,143 730 900 1,122 647 84 175 17,778 070 Of which SMEs 170,459 169,457 1,002 9,900 7,954 385 525 591 328 36 81 9,900 080 Households 447,359 446,566 793 9,265 7,614 521 381 292 318 61 78 9,264 090 Debt Securities 92,814 92,814 275 216 59 275 100 Central banks 1,367 1,367 110 General governments 60,637 60,637 120 Credit institutions 12,203 12,203 130 Other financial corporations 11,497 11,497 231 172 59 231 140 Non-financial corporations 7,110 7,110 44 44 44 150 Off-balance sheet exposures 236,190 1,135 1,134 160 Central banks 174 170 General governments 10,344 180 Credit institutions 14,329 6 6 190 Other financial corporations 33,135 10 10 200 Non-financial corporations 144,201 1,061 1,060 210 Households 34,007 58 58 220 Total 1,451,887 1,212,470 3,227 28,810 22,131 1,281 1,319 1,432 974 208 330 28,785 12/31/2024 a b c d e f g h i j k l Gross carrying amount / Nominal amount Performing exposures Non-performing exposures in millions of euros Not past
due or Past
due ≤ 30
daysPast due
> 30 days
≤ 90 daysUnlikely
to pay that
are not
past-due
or past-due
≤ 90
daysPast due
> 90 days
≤ 180 daysPast due
> 180
days
≤ 1 yearPast due
> 1 year
≤ 2 yearsPast due
> 2 years
≤ 5 yearsPast due
> 5 years
≤ 7 yearsPast due
> 7 yearsOf which
defaulted005 Cash balances at
central banks and
other demand deposits136,008 136,008 010 Loans and advances 954,306 951,392 2,914 24,344 19,415 1,282 1,290 1,240 647 170 300 24,331 020 Central banks 1,592 1,592 19 1 4 14 19 030 General governments 155,886 155,654 232 73 31 2 2 2 3 3 30 74 040 Credit institutions 4,492 4,426 66 16 11 5 16 050 Other financial corporations 23,849 23,680 169 137 78 7 11 11 1 29 137 060 Non-financial corporations 328,755 327,010 1,745 15,826 12,483 805 951 952 390 90 155 15,814 070 Of which SMEs 153,092 152,298 794 8,752 7,166 394 503 396 174 36 83 8,751 080 Households 439,732 439,030 702 8,273 6,811 468 326 275 248 73 72 8,271 090 Debt securities 86,519 86,517 2 318 259 59 318 100 Central banks 1,383 1,383 110 General governments 56,116 56,116 120 Credit institutions 10,695 10,695 130 Other financial corporations 11,114 11,112 2 269 210 59 269 140 Non-financial corporations 7,211 7,211 49 49 49 150 Off-balance sheet exposures 232,898 1,429 1,425 160 Central banks 199 170 General governments 11,893 3 3 180 Credit institutions 12,511 5 5 190 Other financial
corporations30,248 18 18 200 Non-financial corporations 145,027 1,314 1,310 210 Households 33,020 89 89 220 Total 1,409,731 1,173,917 2,916 26,091 19,674 1,283 1,290 1,240 647 229 301 26,074 12/31/2025 a b c d e f g Gross carrying/Nominal amount Accumulated
impairmentProvisions on off-balance sheet
commitments and financial
guarantees givenAccumulated negative changes
in fair value due to credit risk
on non-performing exposuresof which: non-performing of which: subject
to impairmentin millions of euros of which:
defaulted010 On balance sheet exposures 1,243,372 27,675 27,651 1,233,741 (16,032) 020 France 1,041,824 24,552 24,552 1,034,443 (14,255) 030 United States 49,561 525 519 48,987 (179) 040 Japan 16,548 0 0 16,548 (3) 050 Italy 13,911 242 237 13,896 (139) 060 Luxembourg 12,152 240 240 11,763 (160) 070 Other countries 109,376 2,116 2,103 108,104 (1,296) 080 Off balance sheet exposures 237,325 1,135 1,134 915 090 France 143,429 903 902 815 100 United States 34,283 180 180 29 110 Luxembourg 5,026 6 6 20 120 Italy 4,932 0 0 6 130 United Kingdom 4,184 0 0 4 140 Other countries 45,471 46 46 41 150 TOTAL 1,480,697 28,810 28,785 1,233,741 (16,032) 915 12/31/2024 a b c d e f g Gross carrying/Nominal amount Accumulated
impairmentProvisions on off-balance
sheet commitments and
financial guarantees givenAccumulated negative changes
in fair value due to credit risk
on non-performing exposuresof which: non-performing of which: subject
to impairmentin millions of euros of which:
defaulted010 On balance sheet exposures 1,065,488 24,663 24,649 1,055,436 (15,030) 020 France 922,949 22,013 22,012 915,759 (13,425) 030 United States 35,814 487 487 34,863 (162) 040 Luxembourg 10,728 195 195 10,234 (166) 050 Italy 8,970 116 116 8,970 (79) 060 Spain 8,452 78 77 8,451 (72) 070 Other countries 78,575 1,774 1,762 77,159 (1,126) 080 Off balance sheet exposures 234,327 1,428 1,425 934 090 France 147,024 1,351 1,349 836 100 United States 33,988 31 31 27 110 Luxembourg 4,702 4 4 13 120 Switzerland 4,603 0 0 2 130 Spain 4,468 0 0 3 140 Other countries 39,542 42 41 52 150 TOTAL 1,299,815 26,091 26,074 1,055,436 (15,030) 934 12/31/2025 a b c d e f Gross carrying amount Accumulated
impairmentAccumulated negative changes
in fair value due to credit risk
on non-performing exposuresof which: non-performing of which: loans and advances
subject to impairmentin millions of euros of which: defaulted 010 Agriculture, forestry and fishing 5,960 457 457 5,960 (370) 020 Mining and quarrying 2,767 185 185 2,767 (78) 030 Manufacturing 22,267 1,911 1,909 22,267 (1,040) 040 Electricity, gas, steam and air conditioning supply 13,416 374 374 13,416 (163) 050 Water supply 2,337 91 91 2,334 (45) 060 Construction 17,468 1,855 1,850 17,467 (1,116) 070 Wholesale and retail trade 39,228 2,311 2,309 37,943 (1,542) 080 Transport and storage 10,465 564 563 10,462 (277) 090 Accommodation and food service activities 11,789 1,092 1,092 11,789 (673) 100 Information and communication 10,508 430 430 10,254 (198) 110 Real estate activities 36,296 1,093 1,093 35,958 (808) 120 Financial and insurance activities 132,391 4,800 4,788 132,239 (2,703) 130 Professional, scientific and technical activities 23,829 1,224 1,224 23,710 (780) 140 Administrative and support service activities 13,800 645 644 13,800 (316) 150 Public administration and defense, compulsory social security 300 1 1 300 (2) 160 Education 1,878 79 79 1,878 (44) 170 Human health services and social work activities 9,613 278 278 9,520 (229) 180 Arts, entertainment and recreation 1,931 118 118 1,931 (67) 190 Other services 4,813 293 293 4,644 (523) 200 TOTAL 361,056 17,801 17,779 358,638 (10,975) 12/31/2024 a b c d e f Gross carrying amount Accumulated
impairmentAccumulated negative changes
in fair value due to credit risk
on non-performing exposuresof which: non-performing of which: loans and advances
subject to impairmentin millions of euros of which:
defaulted010 Agriculture, forestry and fishing 5,443 376 376 5,443 (341) 020 Mining and quarrying 2,991 252 252 2,991 (115) 030 Manufacturing 21,120 1,871 1,870 21,120 (990) 040 Electricity, gas, steam and air conditioning supply 12,912 319 318 12,912 (127) 050 Water supply 1,985 65 65 1,985 (41) 060 Construction 16,899 1,756 1,753 16,897 (1,034) 070 Wholesale and retail trade 37,255 1,998 1,996 36,201 (1,352) 080 Transport and storage 8,096 483 482 8,094 (252) 090 Accommodation and food service activities 11,174 1,050 1,050 11,174 (663) 100 Information and communication 9,243 353 353 8,822 (203) 110 Real estate activities 35,616 1,034 1,034 35,307 (839) 120 Financial and insurance activities 130,007 3,929 3,928 129,850 (2,670) 130 Professional, scientific and technical activities 21,885 1,137 1,135 21,757 (679) 140 Administrative and support service activities 13,468 528 527 13,465 (265) 150 Public administration and defense, compulsory social security 245 245 (1) 160 Education 1,753 80 80 1,752 (39) 170 Human health services and social work activities 9,045 237 237 8,988 (187) 180 Arts, entertainment and recreation 1,936 105 105 1,936 (62) 190 Other services 3,509 254 254 3,367 (490) 200 TOTAL 344,582 15,827 15,815 342,306 (10,350) 12/31/2025 Unsecured
carrying amountSecured
carrying amountOf which
secured by
collateralOf which secured
by financial
guaranteesOf which secured
by credit
derivativesin millions of euros a b c d e 1 Loans and advances 559,653 574,877 185,802 389,075 2 Debt securities 91,889 921 921 3 TOTAL 651,542 575,798 185,802 389,996 4 Of which non-performing exposures 4,775 11,865 5,556 6,309 EU-5 Of which defaulted 5,197 11,865 12/31/2024 Unsecured
carrying amountSecured carrying
amountOf which
secured by
collateralOf which secured
by financial
guaranteesOf which secured
by credit
derivativesin millions of euros a b c d e 1 Loans and advances 538,599 561,303 174,721 386,582 2 Debt securities 85,529 1,035 1,035 3 TOTAL 624,128 562,338 174,721 387,617 4 Of which non-performing exposures 4,508 10,206 4,407 5,799 EU-5 Of which defaulted 4,903 10,206 The BPCE scope includes BPCE SA and its subsidiaries. The Banques Populaires and Caisses d’Epargne do not contribute to the results of BPCE.
12/31/2025 a b c d e f g h Gross carrying amount/Nominal amount of exposures with
forbearance measuresAccumulated impairment, accumulated
negative changes in fair value due to credit
risk and provisionsCollaterals received and financial
guarantees received on forborne exposuresNon-performing forborne Of which: Collateral and
financial guarantees received
on non-performing exposures
with forbearance measuresin millions of euros Performing
forborneOf which
defaultedOf which
impairedOn performing
forborne exposuresOn non-performing
forborne exposures010 Loans and advances 1,357 3,393 3,393 3,393 (43) (974) 2,683 1,742 020 Central banks 4 4 4 (4) 030 General governments 15 2 2 2 (2) 050 Other financial corporations 10 28 28 28 (1) (23) 060 Non-financial corporations 512 2,052 2,052 2,052 (22) (715) 1,008 769 070 Households 820 1,307 1,307 1,307 (20) (230) 1,675 973 080 Debt Securities 4 4 4 (4) 090 Loan commitments given 94 24 24 24 (3) (5) 15 7 100 TOTAL 1,451 3,421 3,421 3,421 (46) (983) 2,698 1,749 12/31/2024 a b c d e f g h Gross carrying amount/Nominal amount of exposures with
forbearance measuresAccumulated impairment, accumulated
negative changes in fair value due to credit
risk and provisionsCollaterals received and financial
guarantees received on forborne exposuresNon-performing forborne Of which: Collateral and
financial guarantees received
on non-performing exposures
with forbearance measuresin millions of euros Performing
forborneOf which
defaultedOf which
impairedOn performing
forborne exposuresOn non-performing
forborne exposures010 Loans and advances 1,473 3,068 3,068 3,068 (49) (937) 2,699 1,633 020 Central banks 4 4 4 (4) 030 General governments 2 2 2 (2) 050 Other financial corporations 10 28 28 28 (1) (23) 060 Non-financial corporations 538 1,654 1,654 1,654 (20) (665) 909 600 070 Households 925 1,380 1,380 1,380 (28) (243) 1,790 1,033 080 Debt Securities 4 4 4 (4) 090 Loan commitments given 18 30 30 30 (2) 25 8 100 TOTAL 1,491 3,102 3,102 3,102 (49) (943) 2,724 1,641 12/31/2025 a b c d e f g h i j k l n o Gross carrying amount/nominal amount Accumulated impairment, accumulated negative changes
in fair value due to credit risk and provisionsCollaterals and
financial guarantees
receivedPerforming exposures Non-performing exposures Performing exposures –
Accumulated impairment
and provisionsNon-performing exposures -
Accumulated impairment,
accumulated negative
changes in fair value due to
credit risk and provisionsOn
performing
exposuresOn non-performing
exposuresin millions of euros of which:
stage 1of which:
stage 2 (1)of which:
stage 2 (1)of which:
stage 3 (1)of which:
stage 1of which:
stage 2 (1)of which:
stage 2 (1)of which:
stage 3 (1)005 Cash balances at central banks and other demand deposits 111,178 111,118 53 010 Loans and advances 455,157 435,889 16,505 6,989 6,460 (690) (324) (365) (2,375) (2,143) 85,357 3,259 020 Central banks 3,119 3,111 7 19 15 (1) (1) (19) (15) 030 General governments 19,636 17,726 1,469 63 62 (8) (3) (5) (37) (36) 2,090 040 Credit institutions 264,206 263,954 252 5 1 (2) (1) (1) (5) (1) 850 050 Other financial corporations 19,431 18,958 474 58 40 (9) (5) (5) (46) (29) 4,300 1 060 Non-financial corporations 115,511 101,551 11,639 4,582 4,080 (429) (188) (239) (1,587) (1,381) 55,380 1,974 070 Of which: SMEs 26,636 23,066 3,552 1,466 1,411 (130) (56) (75) (358) (347) 15,577 785 080 Households 33,254 30,589 2,664 2,262 2,262 (241) (127) (114) (681) (681) 22,737 1,284 090 Debt Securities 28,501 25,193 583 264 260 (21) (10) (11) (236) (232) 651 0 100 Central banks 1,348 1,348 110 General governments 14,271 12,983 107 (4) (1) (3) 512 120 Credit institutions 6,992 6,816 47 (7) (7) 130 Other financial corporations 4,178 2,537 383 229 230 (8) (1) (7) (209) (209) 15 140 Non-financial corporations 1,712 1,509 46 35 30 (2) (1) (1) (27) (23) 124 150 Off-balance sheet exposures 160,319 151,073 4,366 519 505 (342) (112) (230) (129) (128) 27,511 185 160 Central banks 166 166 170 General governments 2,987 2,158 231 (1) (1) 594 180 Credit institutions 16,904 14,408 138 96 96 (2) (2) (58) (58) 114 190 Other financial corporations 29,741 28,250 477 (3) (3) 2,316 200 Non-financial corporations 93,968 89,623 3,456 417 403 (283) (67) (216) (71) (70) 24,369 184 210 Households 16,553 16,468 64 6 6 (53) (40) (13) 118 1 220 Total 755,155 723,273 21,507 7,772 7,225 (1,053) (446) (606) (2,740) (2,503) 113,519 3,444 31/12/2024 a b c d e f g h i j k l n o Gross carrying amount/nominal amount Accumulated impairment, accumulated negative changes in
fair value due to credit risk and provisionsCollaterals and
financial guarantees
receivedPerforming exposures Non-performing exposures Performing exposures –
Accumulated impairment and
provisionsNon-performing exposures -
Accumulated impairment,
accumulated negative
changes in fair value due to
credit risk and provisionsOn
performing
exposuresOn non-performing
exposuresin millions of euros of which:
stage 1of which:
stage 2 (1)of which:
stage 2 (1)of which:
stage 3 (1)of which:
stage 1of which:
stage 2 (1)of which:
stage 2 (1)of which:
stage 3 (1)005 Cash balances at central banks and other demand deposits 124,170 124,123 42 9 010 Loans and advances 422,679 403,079 16,606 6,144 5,595 (674) (267) (406) (2,201) (1,924) 78,211 2,543 020 Central banks 1,561 1,554 7 19 15 (1) (1) (19) (15) 030 General governments 18,722 16,927 1,255 37 36 (7) (3) (3) (36) (35) 2,071 040 Credit institutions 247,572 247,400 171 6 1 (3) (1) (1) (6) (1) 919 050 Other financial corporations 17,843 17,280 374 58 40 (9) (2) (7) (43) (25) 2,498 4 060 Non-financial corporations 106,451 91,888 12,299 3,901 3,380 (431) (158) (274) (1,486) (1,237) 49,023 1,186 070 Of which: SMEs 20,777 16,980 3,782 963 912 (136) (46) (90) (242) (236) 11,573 309 080 Households 30,530 28,030 2,500 2,123 2,123 (223) (103) (120) (611) (611) 23,700 1,353 090 Debt Securities 27,698 23,923 529 303 299 (15) (10) (5) (237) (233) 794 100 Central banks 1,342 1,342 110 General governments 13,691 12,385 61 (2) (1) (1) 573 120 Credit institutions 6,376 6,212 (5) (5) 130 Other financial corporations 4,471 2,411 455 264 264 (7) (3) (4) (206) (206) 18 140 Non-financial corporations 1,818 1,573 13 39 35 (1) (1) (31) (27) 203 150 Off-balance sheet exposures 154,087 141,828 4,709 519 347 (275) (104) (171) (182) (122) 27,043 113 160 Central banks 191 191 170 General governments 4,172 2,270 428 (1) (1) 464 180 Credit institutions 12,071 10,145 161 96 96 (7) (1) (6) (55) (55) 433 190 Other financial corporations 27,008 25,763 647 (2) (1) (1) 1,928 200 Non-financial corporations 94,163 87,075 3,411 420 248 (222) (62) (160) (127) (67) 24,167 113 210 Households 16,482 16,384 62 3 3 (43) (40) (3) 51 220 Total 728,634 692,953 21,886 6,966 6,241 (964) (381) (582) (2,620) (2,279) 106,057 2,656 12/31/2025 a b c d e f g h i j k l Gross carrying amount / Nominal amount Performing exposures Non-performing exposures in millions of euros Not past
due or
Past due
≤ 30 daysPast due
>30 days
≤ 90 daysUnlikely
to pay
that are
not
past-due
or past-
due ≤ 90
daysPast due
> 90 days
≤ 180 daysPast due
> 180 days
≤ 1 yearPast due
> 1 year
≤ 2 yearsPast due
> 2 years
≤ 5 yearsPast due
> 5 years
≤ 7 yearsPast due
> 7 yearsOf which
defaulted005 Cash balances at central banks and other demand deposits 111,178 111,178 010 Loans and advances 455,157 453,474 1,683 6,989 4,465 451 564 644 553 82 230 6,989 020 Central banks 3,119 3,119 19 4 15 19 030 General governments 19,636 19,521 115 63 12 1 9 5 3 33 63 040 Credit institutions 264,206 264,137 69 5 5 5 050 Other financial corporations 19,431 19,323 108 58 25 4 29 58 060 Non-financial corporations 115,511 114,339 1,172 4,582 3,147 226 330 431 308 33 107 4,582 070 Of which SMEs 26,636 26,248 388 1,466 833 83 139 228 138 7 38 1,466 080 Households 33,254 33,035 219 2,262 1,276 220 225 208 242 45 46 2,262 090 Debt Securities 28,501 28,501 264 205 59 264 100 Central banks 1,348 1,348 110 General governments 14,271 14,271 120 Credit institutions 6,992 6,992 130 Other financial corporations 4,178 4,178 229 170 59 229 140 Non-financial corporations 1,712 1,712 35 35 35 150 Off-balance sheet exposures 160,319 519 519 160 Central banks 166 170 General governments 2,987 180 Credit institutions 16,904 96 96 190 Other financial corporations 29,741 200 Non-financial corporations 93,968 417 417 210 Households 16,553 6 6 220 Total 755,155 593,153 1,683 7,772 4,670 451 564 644 553 140 230 7,772 12/31/2024 a b c d e f g h i j k l Gross carrying amount / Nominal amount Performing exposures Non-performing exposures in millions of euros Not past
due or
Past due
≤ 30 days
Past due
> 30 days
≤ 90 days
Unlikely to
pay that
are not
past-due or
past-due
≤ 90 days
Past due
> 90 days
≤ 180 days
Past due
> 180 days
≤ 1 year
Past due
> 1 year
≤ 2 years
Past due
> 2 years
≤ 5 years
Past due
> 5 years
≤ 7 years
Past due
> 7 years
Of
which
defaulted
005 Cash balances at central banks and other demand deposits 124,170 124,170 010 Loans and advances 422,679 421,156 1,523 6,144 3,896 474 540 606 357 86 185 6,134 020 Central banks 1,561 1,561 19 1 4 14 19 030 General governments 18,722 18,568 154 37 2 1 1 3 30 37 040 Credit institutions 247,572 247,506 66 6 6 6 050 Other financial corporations 17,843 17,676 167 58 19 2 1 7 29 58 060 Non-financial corporations 106,451 105,508 943 3,901 2,603 263 356 406 159 40 74 3,891 070 Of which SMEs 20,777 20,446 331 963 500 45 159 173 45 3 38 963 080 Households 30,530 30,337 193 2,123 1,265 209 183 192 197 39 38 2,123 090 Debt securities 27,698 27,698 303 244 59 303 100 Central banks 1,342 1,342 110 General governments 13,691 13,691 120 Credit institutions 6,376 6,376 130 Other financial corporations 4,471 4,471 264 205 59 264 140 Non-financial corporations 1,818 1,818 39 39 39 150 Off-balance sheet exposures 154,087 519 519 160 Central banks 191 170 General governments 4,172 180 Credit institutions 12,071 96 96 190 Other financial corporations 27,008 200 Non-financial corporations 94,163 420 420 210 Households 16,482 3 3 220 Total 728,634 573,025 1,523 6,966 4,140 474 540 606 357 144 186 6,956 12/31/2025 a b c d e f g Gross carrying/Nominal amount Accumulated
impairmentProvisions on off-balance
sheet commitments and
financial guarantees givenAccumulated negative changes
in fair value due to credit risk
on non-performing exposuresof which: non-performing of which: subject to impairment in millions of euros of which: defaulted 010 On balance sheet exposures 602,089 7,253 7,253 596,791 (3,323) 020 France 461,286 4,897 4,897 458,051 (1,988) 030 United States 33,174 522 522 32,617 (177) 040 Japan 15,408 0 0 15,408 (1) 050 Italy 11,511 233 233 11,496 (131) 060 United Kingdom 9,350 138 138 9,347 (31) 070 Other countries 71,360 1,463 1,463 69,872 (995) 080 Off balance sheet exposures 160,838 519 519 471 090 France 73,717 302 302 388 100 United States 34,044 180 180 29 110 Italy 4,920 0 0 6 120 United Kingdom 3,961 0 0 4 130 Luxembourg 3,998 4 4 18 140 Other countries 40,198 33 33 27 150 TOTAL 762,927 7,772 7,772 596,791 (3,323) 471 12/31/2024 a b c d e f g Gross carrying/Nominal amount Accumulated
impairmentProvisions on off-balance
sheet commitments and
financial guarantees givenAccumulated negative changes
in fair value due to credit risk
on non-performing exposuresof which: non-performing of which: subject
to impairmentin millions of euros of which: defaulted 010 On balance sheet exposures 456,824 6,447 6,437 450,839 (3,128) 020 France 363,454 4,553 4,553 359,958 (1,987) 030 United States 21,482 485 485 20,551 (160) 040 Luxembourg 7,613 106 97 7,613 (71) 050 Italy 7,013 121 121 6,597 (122) 060 Spain 6,147 193 193 6,143 (143) 070 Other countries 51,115 989 988 49,977 (645) 080 Off balance sheet exposures 154,606 519 519 457 090 France 74,962 454 454 380 100 United States 33,954 31 31 27 110 Luxembourg 4,410 0 0 2 120 Switzerland 4,393 0 0 3 130 Spain 4,361 0 0 4 140 Other countries 32,526 34 34 41 150 TOTAL 611,430 6,966 6,956 450,839 (3,128) 457 12/31/2025 a b c d e f Gross carrying amount Accumulated negative
changes in fair value due to
credit risk on non-
performing exposuresof which: non-performing of which: loans and
advances subject to
impairmentAccumulated
impairmentin millions of euros of which: defaulted 010 Agriculture, forestry and fishing 748 33 33 748 (15) 020 Mining and quarrying 2,493 54 54 2,493 (54) 030 Manufacturing 11,876 624 624 11,876 (275) 040 Electricity, gas, steam and air conditioning supply 7,108 296 296 7,108 (86) 050 Water supply 1,117 24 24 1,117 (11) 060 Construction 5,705 349 349 5,705 (163) 070 Wholesale and retail trade 17,406 387 387 16,120 (239) 080 Transport and storage 5,936 205 205 5,936 (84) 090 Accommodation and food service activities 2,048 128 128 2,048 (40) 100 Information and communication 7,322 224 224 7,068 (103) 110 Real estate activities 18,812 251 251 18,474 (197) 120 Financial and insurance activities 22,192 1,451 1,451 22,132 (446) 130 Professional, scientific and technical activities 6,033 225 225 5,915 (134) 140 Administrative and support service activities 7,124 239 239 7,124 (81) 150 Public administration and defense, compulsory social security 49 160 Education 190 3 3 190 (2) 170 Human health services and social work activities 1,978 35 35 1,903 (38) 180 Arts, entertainment and recreation 294 8 8 294 (2) 190 Other services 1,662 46 46 1,662 (44) 200 TOTAL 120,093 4,582 4,582 117,962 (2,014) 12/31/2024 a b c d e f Gross carrying amount Accumulated
impairmentAccumulated negative
changes in fair value due
to credit risk on non-
performing exposuresof which: non-performing of which: loans and
advances subject to
impairmentin millions of euros of which: defaulted 010 Agriculture, forestry and fishing 529 13 13 529 (6) 020 Mining and quarrying 2,686 117 117 2,686 (90) 030 Manufacturing 10,072 583 581 10,072 (280) 040 Electricity, gas, steam and air conditioning supply 7,654 244 243 7,654 (65) 050 Water supply 885 10 10 885 (6) 060 Construction 4,547 298 296 4,547 (142) 070 Wholesale and retail trade 15,349 262 260 14,294 (196) 080 Transport and storage 3,863 154 153 3,863 (62) 090 Accommodation and food service activities 1,793 126 126 1,793 (60) 100 Information and communication 6,332 151 151 5,911 (104) 110 Real estate activities 18,185 309 309 17,876 (284) 120 Financial and insurance activities 23,229 1,131 1,131 23,173 (381) 130 Professional, scientific and technical activities 5,735 202 200 5,608 (107) 140 Administrative and support service activities 6,992 197 196 6,992 (74) 150 Public administration and defense, compulsory social security 30 30 160 Education 108 1 1 108 (1) 170 Human health services and social work activities 1,556 66 66 1,517 (29) 180 Arts, entertainment and recreation 200 5 5 200 (2) 190 Other services 607 33 33 606 (29) 200 TOTAL 110,352 3,902 3,891 108,344 (1,918) 12/31/2025 Unsecured
carrying amountSecured
carrying amountOf which
secured by
collateralOf which
secured by
financial
guaranteesOf which
secured
by credit
derivativesin millions of euros a b c d e 1 Loans and advances 481,642 88,617 46,568 42,048 2 Debt securities 27,856 651 651 3 Total 509,498 89,268 46,568 42,699 4 Of which non-performing exposures 1,382 3,259 2,406 853 EU-5 Of which: defaulted 1,619 3,259 12/31/2024 Unsecured
carrying amountSecured
carrying amountOf which
secured by
collateralOf which
secured by
financial
guaranteesOf which
secured
by credit
derivativesin millions of euros a b c d e 1 Loans and advances 469,365 80,754 40,460 40,294 2 Debt securities 26,954 794 794 3 Total 496,319 81,548 40,460 41,088 4 Of which non-performing exposures 1,466 2,543 1,743 800 EU-5 Of which: defaulted 1,737 2,543 -
5.5 Detailed quantitative information
The detailed quantitative information relating to credit risk in the following tables enhances the information in the previous section under Pillar III.
- the exposure: all assets (e.g. loans, advances, accrued income, etc.) related to transactions on the market or with a client and recorded on the bank’s balance sheet and off-balance sheet;
- the Value at Risk (exposure at default, EAD);
- the probability of default (PD);
- the Loss Given Default (LGD);
- the expected loss (EL), i.e. the value of the loss likely to be incurred given the quality of the structure of the transaction and any measures taken to mitigate risk, such as real guarantees. In the IRBA method, the following equation summarizes the relationship between these variables: EL = EAD x PD x LGD (except for loans in default);
- the risk-weighted assets (RWA): calculated on the basis of exposures and the level of risk associated with them, which depends on the credit quality of the counterparties.
The reporting lines show exposures by standardized or IRB approach, by geographic area, by business segment and by maturity. They also present credit quality by standardized or IRB approach, by geographic area and by business segment.
The tables are presented with respect to credit risk after application of risk mitigation techniques and including CVA. The breakdowns are presented without substitution by the guarantor segment.
Credit risk exposure after mitigation effects and the effects of credit derivatives on risk-weighted assets are also presented.
- central banks and other sovereign exposures: centralization of regulated savings with Caisse des Dépôts et Consignations, deferred taxes and reserves;
- central governments: receivables from Sovereign states, central governments and similar, multilateral development banks and international organizations;
- public sector and similar: receivables from national public institutions, local authorities or other public sector entities, including private social housing;
- financial institutions: receivables from regulated credit institutions and similar, including clearing houses;
- companies: other receivables, in particular large corporates, SMEs, mid-sized companies, insurance companies, funds, etc.;
- retail customers: receivables from individual customers, very small businesses, professional customers and self-employed customers;
- exposure to retail customers is further broken down into several categories: exposures guaranteed by a real estate mortgage excluding SMEs, exposures guaranteed by a real estate mortgage including SMEs, revolving exposures, other exposures to retail customers, of which SMEs and other non-SME retail exposures;
- securitization: receivables relating to securitization transactions;
- equities: exposures representing equity securities;
- other assets: this class includes all assets other than those whose risk relates to third parties (fixed assets, goodwill, residual values on finance leases, etc.).
12/31/2025 a b c d e f Net exposure value in millions of euros Demand ≤ 1 year > 1 year ≤ 5 years > 5 years No stated
maturityTotal 1 Loans and advances 12,276 262,837 287,484 419,642 14,647 996,886 2 Debt securities - 8,364 44,239 32,879 7,327 92,809 3 Total 12,276 271,201 331,724 452,521 21,974 1,089,696 12/31/2024 a b c d e f Net exposure value in millions of euros Demand ≤ 1 year > 1 year ≤ 5 years > 5 years No stated
maturityTotal 1 Loans and advances 11,504 257,788 272,621 406,992 14,988 963,894 2 Debt securities - 6,974 37,286 34,301 8,003 86,564 3 Total 11,504 264,762 309,907 441,293 22,991 1,050,458 12/31/2025 a b Collateral obtained by taking possession in millions of euros Value at initial recognition Accumulated negative changes 010 Property, plant and equipment (PP&E) 1 020 Other than PP&E 144 (66) 030 Residential immovable property 4 (1) 040 Commercial Immovable property 060 Equity and debt instruments 139 (65) 070 Other collateral 1 080 TOTAL 145 (66) 12/31/2024 a b Collateral obtained by taking possession in millions of euros Value at initial recognition Accumulated negative changes 010 Property, plant and equipment (PP&E) 1 020 Other than PP&E 164 (50) 030 Residential immovable property 5 (1) 040 Commercial Immovable property 060 Equity and debt instruments 158 (49) 070 Other collateral 1 080 TOTAL 165 (50) 12/31/2025 Exposures before CCF and
before CRMExposures post CCF and post CRM RWAs and RWAs density Exposure classes On-balance-
sheet exposuresOff-balance-
sheet-exposuresOn-balance-
sheet-exposuresOff-balance-
sheet-exposuresRWEA RWEA density
(%)In millions of euros a b c d e f 1 Central governments or central banks 295,899 1,908 307,815 1,146 8,482 3% 2 Non-central government public sector entities 61,211 7,004 69,575 3,148 5,492 8% 2a Regional governments or local authorities 42,820 4,511 52,820 1,937 1,973 4% 2b Public sector entities 18,391 2,493 16,756 1,210 3,519 20% 3 Multilateral development banks 3,802 2 4,456 67 23 1% 3a International organisations 3,360 - 3,360 - - 0% 4 Institutions 3,860 3,428 3,391 3,218 1,824 28% 5 Covered bonds 787 - 787 - 79 10% 6 Corporates 82,946 30,018 70,599 13,411 67,716 81% 6.1 Of which: Specialized Lending 10,564 3,866 6,666 1,219 8,237 104% 7 Subordinated debt exposures and equity 7,821 - 7,705 - 19,096 248% EU 7 a Subordinated debt exposures - - - - - 0% EU 7b Equity 7,821 - 7,705 - 19,096 248% 8 Retail 14,207 2,128 8,560 332 6,010 68% 9 Secured by mortgages on immovable property and ADC exposures 63,126 6,569 61,969 2,708 34,703 54% 9.1 Secured by mortgages on residential immovable property - non-IPRE 24,945 448 24,943 176 8,017 32% 9.2 Secured by mortgages on residential immovable property - IPRE 8,464 74 8,463 30 2,581 30% 9.3 Secured by mortgages on commercial immovable property - Other - non-IPRE 21,781 843 21,777 373 13,456 61% 9.4 Secured by mortgages on commercial immovable property - IPRE 1,403 33 1,401 13 1,074 76% 9.5 Acquisition, Development and Construction (ADC) 6,534 5,172 5,384 2,116 9,576 128% 10 Exposures in default 5,346 414 4,255 218 5,475 122% 10 a Claims on institutions and corporates with a short-term credit assessment 625 39 597 15 485 79% 10 b Collective investment undertakings 6,304 54 6,304 54 8,746 138% 10 c Other items 24,437 - 24,476 - 17,272 71% 12 TOTAL 573,732 51,565 573,849 24,318 175,403 29% Note: the net exposures are presented according to the model recommended by the EBA in its final report of December 14, 2016, i.e. excluding counterparty risk, CVA and risk related to the contribution to the default fund of a CCP. 12/31/2024 Exposures before CCF and before CRM Exposures post CCF and post CRM RWAs and RWAs density Exposure classes On-balance- sheet
exposuresOff-balance-sheet
exposuresOn-balance- sheet
exposuresOff-balance-sheet
exposuresRWEA RWEA density
(%)in millions of euros a b c d e f 1 Central governments or central banks 287,579 1,899 302,960 1,693 8,975 3% 2 Regional governments or local authorities 42,461 4,219 52,496 1,438 2,039 4% 3 Public sector entities 20,235 3,587 17,866 1,634 4,541 23% 4 Multilateral development banks 1,103 4 1,752 7 73 4% 5 International organisations 1,053 - 1,053 - - 0% 6 Institutions 3,122 4,497 2,763 4,315 1,167 16% 7 Corporates 85,444 30,900 72,112 13,244 70,787 83% 8 Retail 12,768 2,083 6,620 343 4,982 72% 9 Secured by mortgages on immovable property 52,198 1,233 52,197 605 20,074 38% 10 EXPOSURES IN DEFAULT 3,834 450 2,816 237 3,571 117% 11 Exposures associated with particularly high risk 6,926 2,109 6,434 782 10,823 150% 12 Covered bonds 115 - 115 - 11 10% 13 Institutions and corporates with a short-term credit assessment 576 10 536 4 240 45% 14 Collective investment undertakings 3,808 7 3,808 7 4,543 119% 15 Equity 0 - 0 - 0 100% 16 Other items 6,640 - 6,676 - 5,712 86% 17 TOTAL 527,863 50,997 530,203 24,309 137,502 25% Note: the net exposures are presented according to the model recommended by the EBA in its final report of December 14, 2016, i.e. excluding counterparty risk, CVA and risk related to the contribution to the default fund of a CCP.
EU CR5 – standardised approach – Exposures by asset class and by risk weighting coefficient, after application of credit risk mitigation techniques
12/31/2025 Risk weight 0% 2% 4% 10% 20% 30% 35% 40% 45% 50% 60% 70% 75% a b c d e f g h i j k l m 1 Central governments or central banks 303,285 - - - 1,066 - - - - 443 - - - 2 Non-central government public sector entities 57,849 - - - 8,536 - - - - 5,093 - - - EU 2a Regional government or local authorities 45,881 - - - 8,202 - - - - 674 - - - EU 2b Public sector entities 11,968 - - - 334 - - - - 4,419 - - - 3 Multilateral development banks 4,500 - - - - - - - - 1 - - - EU 3a International organisations 3,360 - - - - - - - - - - - - 4 Institutions 3,325 477 - - 342 1,197 - 210 - 102 - - 3 5 Covered bonds - - - 787 - - - - - - - - - 6 Corporates 165 66 - - 6,591 - 183 - - 11,847 - 60 8,213 6.1 Of which: Specialised Lending - - - - 0 - - - - 70 - - 51 7 Subordinated debt exposures and equity - - - - - - - - - - - - - EU 7a Subordinated debt exposures - - - - - - - - - - - - - EU 7b Equity - - - - - - - - - - - - - 8 Retail exposures - - - - - - - - 302 - - - 8,585 9 Secured by mortgages on immovable property and ADC exposures - - - - 25,367 466 439 - 403 178 16,438 - 4,203 9.1 Secured by mortgages on residential immovable property - non-IPRE - - - - 19,520 - 250 - - 110 - - 2,756 9.1.1 No loan splitting applied - - - - 184 - - - - - - - 303 9.1.2 Loan splitting applied (secured) - - - - 19,317 - - - - - - - - 9.1.3 Loan splitting applied (unsecured) - - - - 19 - 250 - - 110 - - 2,453 9.2 Secured by mortgages on residential immovable property - IPRE - - - - 5,847 466 189 - 403 68 247 - 1,187 9.3 Secured by mortgages on commercial immovable property - non-IPRE - - - - - - - - - - 16,173 - 259 9.3.1 No loan splitting applied - - - - - - - - - - - - 77 9.3.2 Loan splitting applied (secured) - - - - - - - - - - 16,173 - - 9.3.3 Loan splitting applied (unsecured) - - - - - - - - - - - - 182 9.4 Secured by mortgages on commercial immovable property - IPRE - - - - - - - - - - 18 - 1 9.5 Acquisition, Development and Construction (ADC) - - - - - - - - - - - - - 10 Exposures in default - - - - - - - - - - - - - 10a Claims on institutions and corporates with a short-term credit assessment - - - - 17 - - - - 295 - - - 10b Collective investment undertakings (CIU) - - - - 226 - - - - 2 - - - 10c Other items 5,372 - - 39 576 - 306 0 - 526 - - 55 EU 11c TOTAL 377,855 543 - 826 42,722 1,664 928 210 705 18,488 16,438 60 21,060 12/31/2025 Risk weight Of
which
unrated80% 90% 100% 105% 110% 130% 150% 250% 370% 400% 1250% Others Total n o p q r s t u v w x y z aa 1 Central governments or central banks - - 1,575 - - - 8 2,585 - - - - 308,962 308,788 2 Non-central government public sector entities - - 1,245 - - - - - - - - - 72,723 70,034 EU 2a Regional government or local authorities - - 0 - - - - - - - - - 54,757 53,835 EU 2b Public sector entities - - 1,245 - - - - - - - - - 17,966 16,200 3 Multilateral development banks - - 22 - - - - - - - - - 4,523 4,500 EU 3a International organisations - - - - - - - - - - - - 3,360 3,360 4 Institutions - - 360 - - - 593 - - - - - 6,609 6,158 5 Covered bonds - - - - - - - - - - - - 787 774 6 Corporates 35 - 50,147 - - 1,597 5,107 - - - - - 84,010 60,512 6.1 Of which: Specialised Lending 35 - 3,486 - - 1,597 2,646 - - - - - 7,885 3,513 7 Subordinated debt exposures and equity - - 16 - - - - 7,573 - - - 116 7,705 7,647 EU 7a Subordinated debt exposures - - - - - - - - - - - - - - EU 7b Equity - - 16 - - - - 7,573 - - - 116 7,705 7,647 8 Retail exposures - - 4 - - - - - - - - - 8,891 8,857 9 Secured by mortgages on immovable property and ADC exposures - 409 9,958 8 167 31 5,824 - - - - 786 64,677 61,217 9.1 Secured by mortgages on residential immovable property - non-IPRE - - 2,308 - - 2 173 - - - - - 25,120 24,580 9.1.1 No loan splitting applied - - 29 - - - - - - - - - 516 508 9.1.2 Loan splitting applied (secured) - - - - - - - - - - - - 19,317 19,137 9.1.3 Loan splitting applied (unsecured) - - 2,279 - - 2 173 - - - - - 5,287 4,934 9.2 Secured by mortgages on residential immovable property - IPRE - - 16 8 - - 62 - - - - - 8,493 8,223 9.3 Secured by mortgages on commercial immovable property - non-IPRE - - 5,465 - - 29 224 - - - - - 22,150 20,837 9.3.1 No loan splitting applied - - 209 - - - - - - - - - 285 285 9.3.2 Loan splitting applied (secured) - - - - - - - - - - - - 16,173 15,435 9.3.3 Loan splitting applied (unsecured) - - 5,256 - - 29 224 - - - - - 5,691 5,117 9.4 Secured by mortgages on commercial immovable property - IPRE - 409 0 - 167 - 33 - - - - 786 1,414 1,217 9.5 Acquisition, Development and Construction (ADC) - - 2,169 - - - 5,332 - - - - - 7,501 6,360 10 Exposures in default - - 2,468 - - - 2,005 - - - - - 4,473 3,249 10a Claims on institutions and corporates with a short-term credit assessment - - 229 - - - 70 - - - - - 612 612 10b Collective investment undertakings (CIU) - - 101 - - - - - - - 21 6,010 6,359 6,314 10c Other items - - 14,743 - - - 56 - - - - 2,802 24,476 24,476 EU 11c TOTAL 35 409 80,869 8 167 1,627 13,662 10,158 - - 21 9,714 598,167 566,497 12/31/2024 0% 2% 4% 10% 20% 35% 50% 70% 75% 100% 150% 250% 370% 1250% Others Total Of
which
unratedin millions of euros a b c d e f g h i j k l m n o p q 1 Central governments or central banks 298,741 - - - 996 - 449 - - 1,739 3 2,726 - - - 304,653 2 Regional government or local authorities 44,796 - - - 8,434 - 704 - - - - - - - - 53,934 3 Public sector entities 11,515 - - - 3,387 - 1,543 - - 2,980 74 - - - - 19,500 4 Multilateral development banks 1,654 - - - 87 - - - - 19 - - - - - 1,759 5 International organisations 1,053 - - - - - - - - - - - - - - 1,053 6 Institutions 4,290 299 - - 1,386 - 439 - - 664 - - - - - 7,078 7 Covered bonds - - - 115 - - - - - - - - - - - 115 8 Corporates 162 0 - - 7,276 135 13,289 61 - 59,313 5,119 - - - - 85,356 9 Retail exposures - - - - - - - - 6,963 - - - - - - 6,963 10 Equity exposures - - - - - - - - - 0 - - - - - 0 11 Collective investment undertakings (CIU) - - - - 236 - - - - 57 - - - 8 3,513 3,815 12 Other exposures 185 - - 24 20 - 27 - - 4,832 - - - - 1,589 6,676 13 Claims on institutions and corporates with a short-term credit assessment - - - - 223 - 244 - - 65 8 - - - - 540 14 Secured by mortgages on immovable property - - - - - 32,814 19,721 - - 267 - - - - - 52,802 15 High risk exposures - - - - - - - - - - 7,216 - - - - 7,216 16 Exposures in default - - - - - - - - - 2,014 1,038 - - - - 3,052 17 TOTAL 362,397 299 - 139 22,045 32,949 36,416 61 6,963 71,950 13,458 2,726 - 8 5,101 554,512 12/31/2025 A-IRB
in millions of euros
PD range On-
balance
sheet
exposuresOff-
balance-
sheet
exposures
pre-CCFExposu
re
weight
ed
averag
e CCFExposure
post CCF
and post
CRMExposure
weighted
average
PD (%)Number of
obligorsExposure
weighted
average
LGD (%)Exposure
weighted
average
maturity
(years)Risk
weighted
exposure
amount
after
supporting
factorsDensity of
risk
weighted
exposure
amountExpected
loss
amountValue
adjustments
and
provisionsa b c d e f g h i j k l Central governm ents and central banks 0.00 to <0.15 1 - 0% 1 0.00% 1 45.00% 3 - 0% 0 (0) 0.00 to <0.10 1 - 0% 1 0.00% 1 45.00% 3 - 0% 0 (0) 0.10 to <0.15 - - 0% - 0.00% - 0.00% - - 0% - - 0.15 to <0.25 - - 0% - 0.00% - 0.00% - - 0% - - 0.25 to <0.50 - - 0% - 0.00% - 0.00% - - 0% - - 0.50 to <0.75 - - 0% - 0.00% - 0.00% - - 0% - - 0.75 to <2.50 - - 0% - 0.00% - 0.00% - - 0% - - 0.75 to <1.75 - - 0% - 0.00% - 0.00% - - 0% - - 1.75 to <2.5 - - 0% - 0.00% - 0.00% - - 0% - - 2.50 to <10.00 - - 0% - 0.00% - 0.00% - - 0% - - 2.5 to <5 - - 0% - 0.00% - 0.00% - - 0% - - 5 to <10 - - 0% - 0.00% - 0.00% - - 0% - - 10.00 to <100.00 - - 0% - 0.00% - 0.00% - - 0% - - 10 to <20 - - 0% - 0.00% - 0.00% - - 0% - - 20 to <30 - - 0% - 0.00% - 0.00% - - 0% - - 30.00 to <100.00 - - 0% - 0.00% - 0.00% - - 0% - - 100.00 (Default) - - 0% - 0.00% - 0.00% - - 0% - - Subtotal Central governments and central banks 1 - 0% 1 0.00% 1 45.00% 3 - 0% 0 (0) Regional government or local authorities 0.00 to <0.15 - - 0% - 0.00% - 0.00% - - 0% - - 0.00 to <0.10 - - 0% - 0.00% - 0.00% - - 0% - - 0.10 to <0.15 - - 0% - 0.00% - 0.00% - - 0% - - 0.15 to <0.25 - - 0% - 0.00% - 0.00% - - 0% - - 0.25 to <0.50 - - 0% - 0.00% - 0.00% - - 0% - - 0.50 to <0.75 - - 0% - 0.00% - 0.00% - - 0% - - 0.75 to <2.50 - - 0% - 0.00% - 0.00% - - 0% - - 0.75 to <1.75 - - 0% - 0.00% - 0.00% - - 0% - - 1.75 to <2.5 - - 0% - 0.00% - 0.00% - - 0% - - 2.50 to <10.00 - - 0% - 0.00% - 0.00% - - 0% - - 2.5 to <5 - - 0% - 0.00% - 0.00% - - 0% - - 5 to <10 - - 0% - 0.00% - 0.00% - - 0% - - 10.00 to <100.00 - - 0% - 0.00% - 0.00% - - 0% - - 10 to <20 - - 0% - 0.00% - 0.00% - - 0% - - 20 to <30 - - 0% - 0.00% - 0.00% - - 0% - - 30.00 to <100.00 - - 0% - 0.00% - 0.00% - - 0% - - 100.00 (Default) - - 0% - 0.00% - 0.00% - - 0% - - Subtotal Regional governments or local authorities - - 0% - 0.00% - 0.00% - - 0% - - Public sector entities 0.00 to <0.15 - - 0% - 0.00% - 0.00% - - 0% - - 0.00 to <0.10 - - 0% - 0.00% - 0.00% - - 0% - - 0.10 to <0.15 - - 0% - 0.00% - 0.00% - - 0% - - 0.15 to <0.25 - - 0% - 0.00% - 0.00% - - 0% - - 0.25 to <0.50 - - 0% - 0.00% - 0.00% - - 0% - - 0.50 to <0.75 - - 0% - 0.00% - 0.00% - - 0% - - 0.75 to <2.50 - - 0% - 0.00% - 0.00% - - 0% - - 0.75 to <1.75 - - 0% - 0.00% - 0.00% - - 0% - - 1.75 to <2.5 - - 0% - 0.00% - 0.00% - - 0% - - 2.50 to <10.00 - - 0% - 0.00% - 0.00% - - 0% - - 2.5 to <5 - - 0% - 0.00% - 0.00% - - 0% - - 5 to <10 - - 0% - 0.00% - 0.00% - - 0% - - 10.00 to <100.00 - - 0% - 0.00% - 0.00% - - 0% - - 10 to <20 - - 0% - 0.00% - 0.00% - - 0% - - 20 to <30 - - 0% - 0.00% - 0.00% - - 0% - - 30.00 to <100.00 - - 0% - 0.00% - 0.00% - - 0% - - 100.00 (Default) - - 0% - 0.00% - 0.00% - - 0% - - Subtotal Public sector entities - - 0% - 0.00% - 0.00% - - 0% - - CORPORATES – SPECIALIZED FINANCING 0.00 to <0.15 11,594 12,065 41% 13,688 0.07% 512 20.57% 3 1,552 11.34% 2 (6) 0.00 to <0.10 11,594 12,065 41% 13,688 0.07% 512 20.57% 3 1,552 11.34% 2 (6) 0.10 to <0.15 - - 0% - 0.00% - 0.00% - - 0% - - 0.15 to <0.25 - - 0% - 0.00% - 0.00% - - 0% - - 0.25 to <0.50 3,046 2,760 59% 4,677 0.43% 240 17.44% 2 1,091 23.33% 3 (3) 0.50 to <0.75 3,786 2,160 45% 4,664 0.58% 185 22.50% 3 1,721 36.90% 6 (7) 0.75 to <2.50 5,218 3,967 62% 7,256 1.18% 406 18.31% 3 2,821 38.87% 15 (13) 0.75 to <1.75 5,158 3,903 62% 7,146 1.16% 402 18.41% 3 2,789 39.04% 15 (13) 1.75 to <2.5 60 64 79% 110 2.37% 4 12.00% 1 31 28.35% 0 (0) 2.50 to <10.00 1,018 730 77% 1,524 5.54% 104 18.57% 3 983 64.48% 16 (24) 2.5 to <5 412 496 84% 829 4.56% 49 17.14% 2 451 54.34% 7 (3) 5 to <10 606 234 63% 695 6.71% 55 20.28% 3 532 76.59% 10 (20) 10.00 to <100.00 507 477 65% 612 29.94% 31 23.46% 2 698 114.15% 46 (27) 10 to <20 236 313 54% 199 14.08% 12 18.67% 2 177 88.77% 5 (4) 20 to <30 - - 0% - 0.00% - 0.00% - - 0% - - 30.00 to <100.00 272 164 86% 413 37.58% 19 25.77% 2 522 126.38% 41 (22) 100.00 (Default) 836 20 45% 772 100.00% 39 59.44% 3 554 71.69% 270 (290) Subtotal Corporates – Specialized financing 26,005 22,180 49% 33,193 3.56% 1,517 20.77% 3 9,419 28.38% 359 (369) CORPORATES – OTHER 0.00 to <0.15 1,993 1,563 77% 1,446 0.07% 367 38.15% 4 406 28.07% 0 (17) 0.00 to <0.10 1,884 1,559 77% 1,346 0.06% 146 39.59% 4 392 29.11% 0 (17) 0.10 to <0.15 109 4 40% 100 0.15% 221 18.84% 3 14 14.09% 0 (0) 0.15 to <0.25 4,380 1,822 72% 5,367 0.18% 4,708 31.24% 11 1,790 33.34% 3 (8) 0.25 to <0.50 7,861 3,117 62% 9,480 0.45% 4,436 31.21% 8 4,391 46.32% 13 (25) 0.50 to <0.75 9,135 1,401 69% 9,524 0.59% 25,790 29.21% 8 3,933 41.29% 16 (31) 0.75 to <2.50 28,957 6,370 61% 31,351 1.54% 47,737 29.17% 9 18,769 59.87% 141 (256) 0.75 to <1.75 22,598 4,379 61% 24,026 1.29% 42,004 29.23% 9 13,534 56.33% 91 (170) 1.75 to <2.5 6,359 1,991 63% 7,325 2.33% 5,733 28.97% 8 5,235 71.47% 49 (85) 2.50 to <10.00 19,951 4,690 60% 21,625 4.80% 44,968 28.95% 8 16,142 74.65% 299 (546) 2.5 to <5 12,861 2,603 60% 13,720 3.50% 26,505 29.03% 8 9,719 70.84% 139 (253) 5 to <10 7,090 2,088 59% 7,905 7.05% 18,463 28.81% 7 6,423 81.25% 160 (293) 10.00 to <100.00 4,427 976 64% 4,678 18.11% 10,278 28.29% 7 5,041 107.76% 239 (358) 10 to <20 3,455 806 66% 3,711 13.47% 7,445 28.52% 7 3,941 106.20% 142 (252) 20 to <30 286 50 57% 297 25.61% 960 27.32% 5 300 100.79% 21 (33) 30.00 to <100.00 686 119 56% 670 40.50% 1,873 27.48% 6 801 119.51% 75 (73) 100.00 (Default) 4,164 330 65% 3,426 100.00% 8,229 53.58% 6 2,497 72.88% 1,728 (1,565) Subtotal Corporates – Other 80,868 20,270 66% 86,898 12.96% 146,513 30.53% 8 52,969 60.95% 2,440 (2,805) Corporates – Purchased receivables 0.00 to <0.15 - - 0% - 0.00% - 0.00% - - 0% - - 0.00 to <0.10 - - 0% - 0.00% - 0.00% - - 0% - - 0.10 to <0.15 - - 0% - 0.00% - 0.00% - - 0% - - 0.15 to <0.25 - - 0% - 0.00% - 0.00% - - 0% - - 0.25 to <0.50 - - 0% - 0.00% - 0.00% - - 0% - - 0.50 to <0.75 - - 0% - 0.00% - 0.00% - - 0% - - 0.75 to <2.50 - - 0% - 0.00% - 0.00% - - 0% - - 0.75 to <1.75 - - 0% - 0.00% - 0.00% - - 0% - - 1.75 to <2.5 - - 0% - 0.00% - 0.00% - - 0% - - 2.50 to <10.00 - - 0% - 0.00% - 0.00% - - 0% - - 2.5 to <5 - - 0% - 0.00% - 0.00% - - 0% - - 5 to <10 - - 0% - 0.00% - 0.00% - - 0% - - 10.00 to <100.00 - - 0% - 0.00% - 0.00% - - 0% - - 10 to <20 - - 0% - 0.00% - 0.00% - - 0% - - 20 to <30 - - 0% - 0.00% - 0.00% - - 0% - - 30.00 to <100.00 - - 0% - 0.00% - 0.00% - - 0% - - 100.00 (Default) - - 0% - 0.00% - 0.00% - - 0% - - Subtotal Corporates – Purchased receivables - - 0% - 0.00% - 0.00% - - 0% - - Retail – Exposures secured by a mortgage on residential real estate 0.00 to <0.15 175,577 3,308 40% 176,900 0.07% 1,878,575 10.35% - 3,087 1.74% 12 (8) 0.00 to <0.10 157,903 2,996 40% 159,101 0.06% 1,725,263 10.20% - 2,534 1.59% 9 (3) 0.10 to <0.15 17,674 312 40% 17,799 0.12% 153,312 11.64% - 553 3.11% 2 (5) 0.15 to <0.25 49,616 1,147 40% 50,075 0.19% 453,441 12.61% - 2,346 4.68% 12 (15) 0.25 to <0.50 50,177 871 40% 50,526 0.34% 415,327 12.87% - 3,664 7.25% 22 (36) 0.50 to <0.75 14,224 298 40% 14,343 0.56% 111,689 14.04% - 1,591 11.09% 11 (14) 0.75 to <2.50 43,642 1,313 40% 44,167 1.35% 347,328 14.27% - 8,948 20.26% 86 (169) 0.75 to <1.75 33,590 940 40% 33,966 1.11% 265,793 14.16% - 6,015 17.71% 53 (104) 1.75 to <2.5 10,052 373 40% 10,202 2.17% 81,535 14.65% - 2,932 28.74% 33 (65) 2.50 to <10.00 17,512 434 40% 17,686 4.86% 142,683 15.38% - 8,116 45.89% 134 (268) 2.5 to <5 10,982 222 40% 11,071 3.51% 86,063 15.16% - 4,262 38.50% 60 (103) 5 to <10 6,530 212 40% 6,614 7.13% 56,620 15.77% - 3,854 58.27% 75 (165) 10.00 to <100.00 5,648 65 40% 5,674 22.68% 44,851 16.15% - 4,368 76.99% 206 (310) 10 to <20 3,580 43 40% 3,597 13.80% 28,899 16.24% - 2,725 75.76% 81 (159) 20 to <30 927 10 40% 931 24.80% 7,083 16.41% - 817 87.76% 38 (59) 30.00 to <100.00 1,141 11 40% 1,146 48.82% 8,869 15.65% - 826 72.11% 87 (92) 100.00 (Default) 3,946 14 40% 3,952 100.00% 37,369 37.29% - 1,550 39.22% 1,349 (681) Subtotal Retail – Exposures secured by a mortgage on residential real estate 360,342 7,449 49% 363,322 15.73% 3,431,263 12.26% - 33,670 9.27% 1,833 (1,501) Retail – Eligible revolving exposures 0.00 to <0.15 4,741 14,017 76% 15,359 0.08% 13,715,479 54.71% - 427 2.78% 7 (3) 0.00 to <0.10 4,285 4,126 68% 7,090 0.06% 12,305,461 50.04% - 134 1.89% 2 (0) 0.10 to <0.15 456 9,891 79% 8,269 0.10% 1,410,018 58.72% - 293 3.55% 5 (3) 0.15 to <0.25 977 1,384 76% 2,028 0.19% 2,849,902 51.82% - 109 5.39% 2 (1) 0.25 to <0.50 903 831 83% 1,593 0.34% 3,014,690 52.10% - 136 8.56% 3 (1) 0.50 to <0.75 304 231 78% 485 0.63% 954,180 50.15% - 65 13.40% 2 (0) 0.75 to <2.50 1,453 1,198 78% 2,390 1.53% 2,689,123 53.15% - 654 27.36% 19 (8) 0.75 to <1.75 828 918 78% 1,546 1.11% 1,819,356 53.38% - 338 21.85% 9 (3) 1.75 to <2.5 625 280 78% 844 2.30% 869,767 52.72% - 316 37.47% 10 (4) 2.50 to <10.00 1,435 472 78% 1,802 5.23% 1,704,433 51.57% - 1,145 63.53% 49 (23) 2.5 to <5 781 314 80% 1,033 3.92% 845,445 51.50% - 548 53.07% 21 (11) 5 to <10 654 158 73% 769 6.98% 858,988 51.65% - 597 77.56% 28 (13) 10.00 to <100.00 629 77 75% 686 21.43% 370,052 51.83% - 864 125.89% 76 (62) 10 to <20 391 59 78% 437 13.31% 257,877 52.00% - 490 112.24% 30 (28) 20 to <30 106 11 61% 113 24.42% 47,021 51.75% - 165 145.72% 14 (12) 30.00 to <100.00 132 7 65% 136 45.00% 65,154 51.34% - 209 153.20% 31 (22) 100.00 (Default) 390 12 3% 390 100.00% 164,980 74.53% - 484 124.10% 254 (240) Subtotal Retail – Eligible revolving exposures 10,832 18,224 78% 24,734 10.99% 25,462,839 54.07% - 3,885 15.71% 411 (338) Retail – Other 0.00 to <0.15 27,096 1,072 46% 27,589 0.07% 1,308,505 25.87% - 1,313 4.76% 5 (4) 0.00 to <0.10 25,211 895 46% 25,626 0.06% 1,189,512 25.35% - 1,142 4.46% 4 (3) 0.10 to <0.15 1,885 177 44% 1,962 0.12% 118,993 32.73% - 170 8.67% 1 (1) 0.15 to <0.25 15,392 930 49% 15,845 0.19% 655,535 30.41% - 1,718 10.84% 9 (12) 0.25 to <0.50 20,160 982 44% 20,590 0.34% 693,103 27.82% - 2,964 14.40% 20 (24) 0.50 to <0.75 7,169 511 47% 7,409 0.56% 293,292 33.37% - 1,706 23.03% 14 (13) 0.75 to <2.50 23,559 1,837 43% 24,351 1.45% 960,631 33.70% - 8,512 34.96% 121 (145) 0.75 to <1.75 16,914 1,245 43% 17,450 1.14% 708,481 32.75% - 5,565 31.89% 65 (71) 1.75 to <2.5 6,645 592 43% 6,901 2.24% 252,150 36.12% - 2,947 42.71% 56 (74) 2.50 to <10.00 14,414 1,038 43% 14,860 5.00% 642,926 35.50% - 7,337 49.37% 269 (352) 2.5 to <5 8,934 641 43% 9,210 3.63% 380,072 34.53% - 4,238 46.02% 116 (127) 5 to <10 5,480 397 43% 5,650 7.24% 262,854 37.07% - 3,099 54.85% 153 (224) 10.00 to <100.00 5,973 348 46% 6,127 23.00% 266,343 34.69% - 4,400 71.82% 498 (614) 10 to <20 3,105 188 45% 3,188 13.63% 141,634 34.42% - 2,150 67.44% 151 (256) 20 to <30 1,540 95 45% 1,579 22.47% 58,606 34.78% - 1,183 74.94% 124 (149) 30.00 to <100.00 1,328 66 50% 1,360 45.56% 66,103 35.22% - 1,067 78.46% 222 (210) 100.00 (Default) 6,984 116 66% 7,060 100.00% 281,182 55.34% - 4,931 69.85% 3,552 (3,225) Subtotal Retail – Other 120,747 6,833 52% 123,831 20.62% 5,101,517 32.04% - 32,882 26.55% 4,488 (4,389) Retail – Purchased receivables 0.00 to <0.15 - - 0% - 0.00% - 0.00% - - 0% - - 0.00 to <0.10 - - 0% - 0.00% - 0.00% - - 0% - - 0.10 to <0.15 - - 0% - 0.00% - 0.00% - - 0% - - 0.15 to <0.25 - - 0% - 0.00% - 0.00% - - 0% - - 0.25 to <0.50 - - 0% - 0.00% - 0.00% - - 0% - - 0.50 to <0.75 - - 0% - 0.00% - 0.00% - - 0% - - 0.75 to <2.50 - - 0% - 0.00% - 0.00% - - 0% - - 0.75 to <1.75 - - 0% - 0.00% - 0.00% - - 0% - - 1.75 to <2.5 - - 0% - 0.00% - 0.00% - - 0% - - 2.50 to <10.00 - - 0% - 0.00% - 0.00% - - 0% - - 2.5 to <5 - - 0% - 0.00% - 0.00% - - 0% - - 5 to <10 - - 0% - 0.00% - 0.00% - - 0% - - 10.00 to <100.00 - - 0% - 0.00% - 0.00% - - 0% - - 10 to <20 - - 0% - 0.00% - 0.00% - - 0% - - 20 to <30 - - 0% - 0.00% - 0.00% - - 0% - - 30.00 to <100.00 - - 0% - 0.00% - 0.00% - - 0% - - 100.00 (Default) - - 0% - 0.00% - 0.00% - - 0% - - Subtotal Retail – Purchased receivables - - 0% - 0.00% - 0.00% - - 0% - - Units or shares in collective investment undertakings (CIU) 0.00 to <0.15 99 - 0% 99 0.05% 89 43.82% 3 18 18.49% 0 - 0.00 to <0.10 99 - 0% 99 0.05% 89 43.82% 3 18 18.49% 0 - 0.10 to <0.15 - - 0% - 0.00% - 0.00% - - 0% - - 0.15 to <0.25 1 - 0% 1 0.19% 1 40.00% 3 0 26.13% 0 - 0.25 to <0.50 32 - 0% 32 0.33% 52 42.45% 2 18 56.01% 0 - 0.50 to <0.75 1 - 0% 1 0.70% 3 45.00% 3 2 134.47% 0 - 0.75 to <2.50 5 - 0% 5 1.08% 14 38.97% 2 4 68.90% 0 - 0.75 to <1.75 5 - 0% 5 1.08% 14 38.97% 2 4 68.90% 0 - 1.75 to <2.5 - - 0% - 0.00% - 0.00% - - 0% - - 2.50 to <10.00 11 - 0% 11 5.62% 32 40.49% 2 14 134.76% 0 - 2.5 to <5 2 - 0% 2 4.41% 9 38.82% 2 2 110.78% 0 - 5 to <10 9 - 0% 9 5.92% 23 40.90% 3 12 140.62% 0 - 10.00 to <100.00 10 - 0% 10 30.95% 20 39.83% 3 22 210.82% 1 - 10 to <20 - - 0% - 0.00% - 0.00% - - 0% - - 20 to <30 - - 0% - 0.00% - 0.00% - - 0% - - 30.00 to <100.00 10 - 0% 10 30.95% 20 39.83% 3 22 210.82% 1 - 100.00 (Default) 0 - 0% 0 100.00% 1 40.00% 3 - 0% 0 - Subtotal Units or shares in collective investment undertakings (CIU) 161 - 0% 161 3.13% 212 42.89% 2 79 48.97% 2 - Total 598,956 74,956 295% 632,139 34,143,862 16 132,903 21.02% 9,533 (9,402) 12/31/2025 F-IRB
in millions of euros
PD range On-
balance
sheet
exposuresOff-
balance-
sheet
exposures
pre-CCFExposu
re
weight
ed
averag
e CCFExposure
post CCF
and post
CRMExposure
weighted
average
PD (%)Number of
obligorsExposure
weighted
average
LGD (%)Exposure
weighted
average
maturity
(years)Risk
weighted
exposure
amount
after
supporting
factorDensity of
risk
weighted
exposure
amountExpected
loss
amountValue
adjustments
and
provisionsa b c d e f g h i j k l CENTRAL GOVERNMENTS AND CENTRAL BANKS 0.00 to <0.15 - - 0% - 0.00% - 0.00% - - 0% - - 0.00 to <0.10 - - 0% - 0.00% - 0.00% - - 0% - - 0.10 to <0.15 - - 0% - 0.00% - 0.00% - - 0% - - 0.15 to <0.25 - - 0% - 0.00% - 0.00% - - 0% - - 0.25 to <0.50 - - 0% - 0.00% - 0.00% - - 0% - - 0.50 to <0.75 - - 0% - 0.00% - 0.00% - - 0% - - 0.75 to <2.50 - - 0% - 0.00% - 0.00% - - 0% - - 0.75 to <1.75 - - 0% - 0.00% - 0.00% - - 0% - - 1.75 to <2.5 - - 0% - 0.00% - 0.00% - - 0% - - 2.50 to <10.00 - - 0% - 0.00% - 0.00% - - 0% - - 2.5 to <5 - - 0% - 0.00% - 0.00% - - 0% - - 5 to <10 - - 0% - 0.00% - 0.00% - - 0% - - 10.00 to <100.00 - - 0% - 0.00% - 0.00% - - 0% - - 10 to <20 - - 0% - 0.00% - 0.00% - - 0% - - 20 to <30 - - 0% - 0.00% - 0.00% - - 0% - - 30.00 to <100.00 - - 0% - 0.00% - 0.00% - - 0% - - 100.00
(Default)- - 0% - 0.00% - 0.00% - - 0% - - Subtotal Central governments and central banks - - 0% - 0.00% - 0.00% - - 0% - - Regional governments or local authorities 0.00 to <0.15 - - 0% - 0.00% - 0.00% - - 0% - - 0.00 to <0.10 - - 0% - 0.00% - 0.00% - - 0% - - 0.10 to <0.15 - - 0% - 0.00% - 0.00% - - 0% - - 0.15 to <0.25 - - 0% - 0.00% - 0.00% - - 0% - - 0.25 to <0.50 - - 0% - 0.00% - 0.00% - - 0% - - 0.50 to <0.75 - - 0% - 0.00% - 0.00% - - 0% - - 0.75 to <2.50 - - 0% - 0.00% - 0.00% - - 0% - - 0.75 to <1.75 - - 0% - 0.00% - 0.00% - - 0% - - 1.75 to <2.5 - - 0% - 0.00% - 0.00% - - 0% - - 2.50 to <10.00 - - 0% - 0.00% - 0.00% - - 0% - - 2.5 to <5 - - 0% - 0.00% - 0.00% - - 0% - - 5 to <10 - - 0% - 0.00% - 0.00% - - 0% - - 10.00 to <100.00 - - 0% - 0.00% - 0.00% - - 0% - - 10 to <20 - - 0% - 0.00% - 0.00% - - 0% - - 20 to <30 - - 0% - 0.00% - 0.00% - - 0% - - 30.00 to <100.00 - - 0% - 0.00% - 0.00% - - 0% - - 100.00 (Default) - - 0% - 0.00% - 0.00% - - 0% - - Subtotal Regional governments or local authorities - - 0% - 0.00% - 0.00% - - 0% - - Public sector entities 0.00 to <0.15 0 - 0% 6 0.13% 2 29.26% 3 1 18.70% 0 (0) 0.00 to <0.10 0 - 0% 1 0.05% 1 20.00% 3 0 8.73% 0 (0) 0.10 to <0.15 0 - 0% 5 0.15% 1 31.22% 3 1 20.82% 0 (0) 0.15 to <0.25 30 18 40% 63 0.24% 1 25.95% 3 18 28.04% 0 (0) 0.25 to <0.50 2 1 40% 8 0.39% 3 31.52% 3 3 39.04% 0 (0) 0.50 to <0.75 - - 0% 1 0.64% - 20.00% 3 0 34.45% 0 - 0.75 to <2.50 17 1 100% 19 1.04% 2 37.33% 3 14 77.40% 0 (0) 0.75 to <1.75 17 1 100% 19 1.04% 2 37.33% 3 14 77.40% 0 (0) 1.75 to <2.5 - - 0% - 0.00% - 0.00% - - 0% - - 2.50 to <10.00 - - 0% 1 7.22% - 20.00% 3 1 75.94% 0 - 2.5 to <5 - - 0% - 0.00% - 0.00% - - 0% - - 5 to <10 - - 0% 1 7.22% - 20.00% 3 1 75.94% 0 - 10.00 to <100.00 - - 0% 3 11.73% - 20.00% 3 3 90.91% 0 - 10 to <20 - - 0% 3 11.73% - 20.00% 3 3 90.91% 0 - 20 to <30 - - 0% - 0.00% - 0.00% - - 0% - - 30.00 to <100.00 - - 0% - 0.00% - 0.00% - - 0% - - 100.00 (Default) - - 0% - 0.00% - 0.00% - - 0% - - Subtotal Public sectorentities 50 19 98% 101 63.29% 8 28.34% 2 41 40.20% 0 (0) Institutions 0.00 to <0.15 9,972 959 23% 12,756 0.05% 259 37.70% 3 2,028 15.90% 2 (0) 0.00 to <0.10 9,972 959 23% 12,756 0.05% 259 37.70% 3 2,028 15.90% 2 (0) 0.10 to <0.15 - - 0% - 0.00% - 0.00% - - 0% - - 0.15 to <0.25 - - 0% - 0.00% - 0.00% - - 0% - (0) 0.25 to <0.50 1,064 1,379 32% 1,453 0.25% 117 35.10% 3 626 43.07% 1 (0) 0.50 to <0.75 369 1,592 22% 667 0.70% 66 44.52% 3 563 84.40% 2 (1) 0.75 to <2.50 1 - 0% 1 1.73% 2 45.00% 3 1 116.80% 0 (0) 0.75 to <1.75 0 - 0% 0 1.10% 1 45.00% 3 0 121.53% 0 (0) 1.75 to <2.5 1 - 0% 1 1.84% 1 45.00% 3 1 116.01% 0 - 2.50 to <10.00 48 516 30% 210 4.11% 62 42.18% 3 307 146.26% 3 (1) 2.5 to <5 43 420 32% 176 3.78% 35 44.95% 3 271 153.84% 3 (1) 5 to <10 5 96 21% 34 5.84% 27 27.67% 3 36 106.64% 0 (0) 10.00 to <100.00 3 0 20% 3 10.63% 7 45.00% 3 7 229.48% 0 (0) 10 to <20 3 0 20% 3 10.63% 7 45.00% 3 7 229.48% 0 (0) 20 to <30 - - 0% - 0.00% - 0.00% - - 0% - - 30.00 to <100.00 - - 0% - 0.00% - 0.00% - - 0% - - 100.00 (Default) 5 - 0% 5 100.00% 3 45.00% 3 - 0% 2 (5) Subtotal Institutions 11,464 4,446 26% 15,095 0.19% 516 37.82% 3 3,532 23.40% 12 (8) Corporates – Specialized financing 0.00 to <0.15 4 63 40% 29 0.05% 5 32.10% 3 7 22.40% 0 (0) 0.00 to <0.10 4 63 40% 29 0.05% 5 32.10% 3 7 22.40% 0 (0) 0.10 to <0.15 - - 0% - 0.00% - 0.00% - - 0% - - 0.15 to <0.25 - - 0% - 0.00% - 0.00% - - 0% - - 0.25 to <0.50 - - 0% - 0.00% - 0.00% - - 0% - - 0.50 to <0.75 - - 0% - 0.00% - 0.00% - - 0% - - 0.75 to <2.50 - - 0% - 0.00% - 0.00% - - 0% - - 0.75 to <1.75 - - 0% - 0.00% - 0.00% - - 0% - - 1.75 to <2.5 - - 0% - 0.00% - 0.00% - - 0% - - 2.50 to <10.00 - - 0% - 0.00% - 0.00% - - 0% - - 2.5 to <5 - - 0% - 0.00% - 0.00% - - 0% - - 5 to <10 - - 0% - 0.00% - 0.00% - - 0% - - 10.00 to <100.00 - - 0% - 0.00% - 0.00% - - 0% - - 10 to <20 - - 0% - 0.00% - 0.00% - - 0% - - 20 to <30 - - 0% - 0.00% - 0.00% - - 0% - - 30.00 to <100.00 - - 0% - 0.00% - 0.00% - - 0% - - 100.00 (Default) - - 0% - 0.00% - 0.00% - - 0% - - Subtotal Corporates – Specialized financing 4 63 40% 29 0.05% 5 32.10% 3 7 22.40% 0 (0) CORPORATES – OTHER 0.00 to <0.15 27,753 46,863 35% 46,122 0.06% 1,999 40.38% 3 8,317 18.03% 12 (18) 0.00 to <0.10 27,013 46,747 35% 45,420 0.06% 1,497 40.46% 3 8,129 17.90% 12 (17) 0.10 to <0.15 739 116 49% 702 0.15% 502 35.04% 3 188 26.83% 0 (1) 0.15 to <0.25 761 783 43% 954 0.21% 447 37.72% 3 382 40.06% 1 (3) 0.25 to <0.50 18,469 20,463 37% 25,360 0.38% 2,636 38.12% 3 12,437 49.04% 36 (23) 0.50 to <0.75 1,518 631 43% 1,724 0.63% 1,654 37.44% 3 994 57.67% 4 (4) 0.75 to <2.50 13,620 9,414 38% 16,697 1.27% 6,827 36.49% 3 13,007 77.90% 78 (85) 0.75 to <1.75 11,555 8,775 38% 14,515 1.12% 5,777 36.30% 3 10,849 74.75% 59 (64) 1.75 to <2.5 2,065 639 38% 2,183 2.31% 1,050 37.74% 3 2,158 98.84% 19 (21) 2.50 to <10.00 8,273 4,400 40% 9,810 4.58% 7,943 37.45% 3 11,515 117.38% 169 (180) 2.5 to <5 5,505 3,240 40% 6,727 3.63% 5,331 37.25% 3 7,381 109.72% 91 (89) 5 to <10 2,768 1,160 41% 3,083 6.65% 2,612 37.89% 3 4,134 134.11% 78 (91) 10.00 to <100.00 1,967 703 39% 2,062 17.26% 1,919 38.22% 3 3,759 182.29% 135 (153) 10 to <20 1,613 591 39% 1,682 13.95% 1,093 38.55% 3 3,019 179.49% 90 (128) 20 to <30 36 2 42% 37 24.42% 160 38.71% 3 76 206.49% 3 (5) 30.00 to <100.00 317 110 36% 343 32.72% 666 36.54% 3 664 193.41% 41 (20) 100.00 (Default) 2,612 238 44% 2,415 100.00% 4,006 36.94% 3 - 0% 892 (1,420) Subtotal Corporates – Other 74,973 83,494 37% 105,145 4.30% 27,431 38.75% 3 50,412 47.95% 1,326 (1,887) Corporates – Purchased receivables 0.00 to <0.15 - - 0% - 0.00% - 0.00% - - 0% - - 0.00 to <0.10 - - 0% - 0.00% - 0.00% - - 0% - - 0.10 to <0.15 - - 0% - 0.00% - 0.00% - - 0% - - 0.15 to <0.25 - - 0% - 0.00% - 0.00% - - 0% - - 0.25 to <0.50 0 - 0% 0 0.42% 1 40.00% 3 0 34.52% 0 - 0.50 to <0.75 - - 0% - 0.00% - 0.00% - - 0% - - 0.75 to <2.50 - - 0% - 0.00% - 0.00% - - 0% - - 0.75 to <1.75 - - 0% - 0.00% - 0.00% - - 0% - - 1.75 to <2.5 - - 0% - 0.00% - 0.00% - - 0% - - 2.50 to <10.00 - - 0% - 0.00% - 0.00% - - 0% - - 2.5 to <5 - - 0% - 0.00% - 0.00% - - 0% - - 5 to <10 - - 0% - 0.00% - 0.00% - - 0% - - 10.00 to <100.00 - - 0% - 0.00% - 0.00% - - 0% - - 10 to <20 - - 0% - 0.00% - 0.00% - - 0% - - 20 to <30 - - 0% - 0.00% - 0.00% - - 0% - - 30.00 to <100.00 - - 0% - 0.00% - 0.00% - - 0% - - 100.00 (Default) 0 - 0% 0 100.00% 1 40.00% 3 - 0% 0 (0) Subtotal Corporates – Purchased receivables 1 - 0% 1 65.87% 2 40.00% 3 0 11.83% 0 (0) Total 86,491 88,023 201% 120,371 27,962 13 53,991 44.85% 1,339 (1,896) 12/31/2024 A-IRB
in millions of eurosPD range On-
balance
sheet
exposuresOff-
balance-
sheet
exposures
pre-CCFExposure
weighted
average
CCFExposure
post CCF
and post
CRMExposure
weighted
average
PD (%)Number of
obligorsExposure
weighted
average
LGD (%)Exposure
weighted
average
maturity
(years)Risk
weighted
exposure
amount after
supporting
factorDensity of
risk
weighted
exposure
amountExpected
loss
amountValue
adjustments
and
provisionsa b c d e f g h i j k l m CENTRAL GOVERNMENTS AND CENTRAL BANKS 0.00 to <0.15 2,385 - 0% 2,387 0.00% 12 7.10% 4 - 0.00% - - 0.00 to <0.10 2,385 - 0% 2,387 0.00% 12 7.10% 4 - 0.00% - - 0.10 to <0.15 - - 0% - 0.00% - 0.00% - - 0.00% - - 0.15 to <0.25 - - 0% - 0.00% - 0.00% - - 0.00% - - 0.25 to <0.50 - - 0% 47 0.00% - 20.00% 1 - 0.00% - (0) 0.50 to <0.75 - - 0% - 0.00% - 0.00% - - 0.00% - - 0.75 to <2.50 - - 0% 45 0.00% - 2.70% 0 - 0.00% - (0) 0.75 to <1.75 - - 0% 45 0.00% - 2.70% 0 - 0.00% - (0) 1.75 to <2.5 - - 0% - 0.00% - 0.00% - - 0.00% - - 2.50 to <10.00 - - 0% 44 0.00% - 7.10% 5 - 0.00% - - 2.5 to <5 - - 0% 2 0.00% - 7.10% 0 - 0.00% - - 5 to <10 - - 0% 43 0.00% - 7.10% 5 - 0.00% - - 10.00 to <100.00 - - 0% - 0.00% - 0.00% - - 0.00% - - 10 to <20 - - 0% - 0.00% - 0.00% - - 0.00% - - 20 to <30 - - 0% - 0.00% - 0.00% - - 0.00% - - 30.00 to <100.00 - - 0% - 0.00% - 0.00% - - 0.00% - - 100.00 (Default) - - 0% - 0.00% - 0.00% - - 0.00% - - Subtotal Central governments and central banks 2,385 - 0% 2,523 0.00% 12 7.26% 4 - 0.00% - (0) Institutions 0.00 to <0.15 5,617 1,343 23% 5,941 0.03% 231 38.47% 1 526 8.86% 1 (0) 0.00 to <0.10 5,617 1,343 23% 5,941 0.03% 231 38.47% 1 526 8.86% 1 (0) 0.10 to <0.15 - - 0% - 0.00% - 0.00% - - 0.00% - - 0.15 to <0.25 - - 0% 2 0.04% - 37.85% 1 0 11.72% 0 - 0.25 to <0.50 547 1,190 53% 999 0.22% 88 44.67% 1 476 47.64% 1 (0) 0.50 to <0.75 11 762 30% 227 0.68% 47 58.95% 1 225 98.97% 1 (0) 0.75 to <2.50 - - 0% 750 0.05% - 38.56% 2 158 21.09% 0 (0) 0.75 to <1.75 - - 0% 713 0.05% - 38.39% 2 150 20.97% 0 (0) 1.75 to <2.5 - - 0% 37 0.06% - 41.89% 2 9 23.44% 0 (0) 2.50 to <10.00 29 768 21% 680 1.04% 74 45.83% 3 535 78.78% 5 (7) 2.5 to <5 7 731 21% 639 0.86% 52 44.05% 3 449 70.34% 3 (7) 5 to <10 23 37 20% 41 3.91% 22 73.93% 1 86 212.03% 2 (0) 10.00 to <100.00 2 - 0% 39 0.46% 2 39.50% 1 16 40.26% 0 (0) 10 to <20 2 - 0% 30 0.59% 2 37.90% 2 14 47.64% 0 (0) 20 to <30 - - 0% - 0.00% - 0.00% - - 0.00% - - 30.00 to <100.00 - - 0% 9 0.05% - 44.93% 1 1 15.30% 0 (0) 100.00 (Default) 19 - 0% 38 52.31% 4 63.55% 2 37 96.11% 19 (20) Subtotal Institutions 6,225 4,063 32% 8,677 0.41% 446 40.42% 1 1,974 22.74% 27 (27) CORPORATES – SME 0.00 to <0.15 351 84 83% 421 0.07% 286 28.35% 2 49 11.71% 0 (0) 0.00 to <0.10 268 81 84% 337 0.05% 131 30.40% 2 37 10.95% 0 (0) 0.10 to <0.15 83 2 47% 84 0.15% 155 20.18% 2 12 14.76% 0 (0) 0.15 to <0.25 416 223 63% 507 0.17% 655 28.14% 10 121 23.92% 0 (0) 0.25 to <0.50 2,343 1,017 59% 2,714 0.44% 2,832 27.97% 7 987 36.35% 3 (3) 0.50 to <0.75 723 48 73% 755 0.64% 1,893 21.49% 2 248 32.88% 1 (1) 0.75 to <2.50 7,153 1,924 61% 7,487 1.56% 7,464 26.06% 7 3,894 52.01% 30 (64) 0.75 to <1.75 4,752 1,174 64% 4,990 1.16% 5,091 25.77% 7 2,450 49.10% 15 (25) 1.75 to <2.5 2,401 750 54% 2,498 2.35% 2,373 26.62% 8 1,444 57.81% 16 (39) 2.50 to <10.00 4,265 1,127 49% 4,287 4.83% 7,404 23.67% 6 2,741 63.93% 49 (114) 2.5 to <5 3,002 871 48% 3,090 3.94% 5,564 23.53% 6 1,873 60.62% 29 (55) 5 to <10 1,264 256 52% 1,197 7.11% 1,840 24.03% 6 867 72.48% 20 (59) 10.00 to <100.00 1,318 256 49% 1,353 21.40% 1,922 23.38% 4 1,399 103.38% 65 (54) 10 to <20 716 175 47% 687 12.75% 1,032 25.60% 5 659 96.02% 22 (43) 20 to <30 0 - 0% 0 20.74% 29 25.80% 2 0 132.70% 0 (0) 30.00 to <100.00 602 81 54% 667 30.31% 861 21.10% 3 740 110.96% 43 (12) 100.00 (Default) 1,034 173 47% 834 99.01% 1,473 41.99% 4 800 95.94% 360 (342) Subtotal Corporates –SME 17,604 4,853 59% 18,358 10.69% 23,929 26.23% 6 10,239 55.77% 510 (579) CORPORATES – SPECIALIZED FINANCING 0.00 to <0.15 1,184 685 86% 1,756 0.03% 103 15.24% 3 115 6.55% 0 (0) 0.00 to <0.10 1,184 685 86% 1,756 0.03% 103 15.24% 3 115 6.55% 0 (0) 0.10 to <0.15 - - 0% - 0.00% - 0.00% - - 0.00% - - 0.15 to <0.25 1,032 336 50% 1,148 0.25% 112 16.67% 4 248 21.57% 0 (0) 0.25 to <0.50 10,249 9,622 43% 12,722 0.31% 540 18.79% 3 3,119 24.51% 7 (12) 0.50 to <0.75 - - 0% - 0.00% - 0.00% - - 0.00% - - 0.75 to <2.50 5,133 3,474 57% 5,458 1.32% 260 17.74% 3 2,447 44.84% 13 (14) 0.75 to <1.75 5,133 3,474 57% 5,458 1.32% 260 17.74% 3 2,447 44.84% 13 (14) 1.75 to <2.5 - - 0% - 0.00% - 0.00% - - 0.00% - - 2.50 to <10.00 1,478 1,128 77% 1,830 5.20% 130 19.86% 3 1,289 70.43% 19 (19) 2.5 to <5 592 709 86% 1,144 4.63% 53 18.21% 2 709 61.96% 10 (6) 5 to <10 887 420 61% 686 6.15% 77 22.61% 3 580 84.54% 10 (14) 10.00 to <100.00 901 481 62% 780 23.61% 43 23.24% 2 977 125.22% 42 (35) 10 to <20 380 123 60% 371 13.79% 21 23.23% 2 432 116.57% 12 (11) 20 to <30 168 242 49% 28 22.11% 2 30.51% 5 53 191.70% 2 (2) 30.00 to <100.00 353 116 91% 382 33.25% 20 22.72% 2 492 128.76% 29 (21) 100.00 (Default) 824 34 48% 746 100.00% 35 53.13% 4 704 94.40% 256 (256) Subtotal Corporates –Specialized financing 20,801 15,760 52% 24,440 9.35% 1,223 19.47% 3 8,898 36.41% 338 (337) CORPORATES – OTHER 0.00 to <0.15 22,430 37,399 57% 43,473 0.05% 788 36.00% 2 6,386 14.69% 7 (2) 0.00 to <0.10 22,295 37,395 57% 43,337 0.05% 759 36.01% 2 6,335 14.62% 7 (2) 0.10 to <0.15 135 4 20% 136 0.15% 29 32.43% 4 51 37.84% 0 (0) 0.15 to <0.25 1,977 1,356 75% 2,921 0.17% 595 27.35% 9 902 30.88% 1 (3) 0.25 to <0.50 17,391 23,756 55% 30,905 0.32% 2,349 32.66% 3 12,658 40.96% 32 (24) 0.50 to <0.75 727 705 75% 1,268 0.59% 448 30.61% 3 675 53.24% 2 (2) 0.75 to <2.50 16,346 13,873 52% 22,998 1.22% 4,919 30.41% 5 15,488 67.35% 85 (109) 0.75 to <1.75 11,475 11,781 51% 17,372 0.89% 3,146 30.76% 5 10,666 61.40% 48 (61) 1.75 to <2.5 4,871 2,092 57% 5,626 2.26% 1,773 29.35% 6 4,822 85.72% 37 (49) 2.50 to <10.00 7,003 4,811 61% 9,289 4.40% 4,435 28.84% 5 9,141 98.41% 121 (158) 2.5 to <5 4,010 3,234 59% 5,306 3.54% 3,266 29.32% 4 5,195 97.91% 55 (61) 5 to <10 2,993 1,577 66% 3,984 5.55% 1,169 28.19% 6 3,947 99.07% 67 (97) 10.00 to <100.00 2,354 909 49% 2,592 14.75% 1,280 31.16% 3 3,211 123.86% 116 (109) 10 to <20 1,540 733 51% 1,696 11.87% 563 31.04% 4 2,338 137.85% 64 (79) 20 to <30 0 18 37% 29 5.76% 15 27.87% 4 12 42.89% 0 (0) 30.00 to <100.00 814 158 41% 868 20.68% 702 31.51% 2 861 99.22% 52 (29) 100.00 (Default) 2,745 346 61% 2,549 97.01% 906 46.82% 4 1,615 63.35% 1,551 (1,462) Subtotal Corporates – Other 70,973 83,153 57% 115,996 5.68% 15,720 33.28% 3 50,077 43.17% 1,917 (1,868) RETAIL – SME REAL ESTATE 0.00 to <0.15 9,461 168 128% 9,677 0.14% 52,780 13.37% - 358 3.70% 2 (4) 0.00 to <0.10 - - 0% - 0.00% - 0.00% - - 0.00% - - 0.10 to <0.15 9,461 168 128% 9,677 0.14% 52,780 13.37% - 358 3.70% 2 (4) 0.15 to <0.25 6,687 94 70% 6,753 0.21% 44,149 12.09% - 304 4.50% 2 (3) 0.25 to <0.50 4,353 65 89% 4,411 0.43% 27,772 16.59% - 425 9.65% 3 (3) 0.50 to <0.75 10,068 149 111% 10,234 0.63% 58,846 17.20% - 1,367 13.36% 11 (15) 0.75 to <2.50 19,322 464 116% 19,862 1.43% 94,029 19.62% - 5,092 25.64% 54 (75) 0.75 to <1.75 12,622 285 126% 12,982 1.10% 58,841 21.27% - 3,089 23.79% 30 (36) 1.75 to <2.5 6,700 179 101% 6,880 2.07% 35,188 16.49% - 2,004 29.12% 23 (39) 2.50 to <10.00 11,791 277 98% 12,062 4.70% 64,861 18.10% - 5,869 48.66% 102 (202) 2.5 to <5 6,529 146 106% 6,684 3.12% 37,749 18.52% - 2,763 41.34% 40 (62) 5 to <10 5,261 131 89% 5,378 6.68% 27,112 17.58% - 3,106 57.76% 62 (141) 10.00 to <100.00 5,517 129 111% 5,660 21.05% 29,785 18.99% - 4,935 87.19% 224 (337) 10 to <20 3,480 85 124% 3,586 14.46% 18,396 19.26% - 3,075 85.73% 100 (161) 20 to <30 1,162 28 75% 1,183 23.97% 6,653 18.02% - 1,072 90.64% 52 (83) 30.00 to <100.00 874 16 105% 891 43.73% 4,736 19.21% - 788 88.45% 72 (92) 100.00 (Default) 1,368 5 14% 1,368 100.00% 10,160 43.84% - 592 43.27% 554 (397) Subtotal Retail – SME Real estate 68,567 1,352 110% 70,027 14.65% 382,382 17.65% - 18,942 27.05% 950 (1,035) RETAIL – NON-SME REAL ESTATE 0.00 to <0.15 168,609 2,841 99% 171,408 0.05% 1,819,105 9.50% - 2,542 1.48% 9 (5) 0.00 to <0.10 156,175 2,672 98% 158,792 0.05% 1,693,822 9.35% - 2,129 1.34% 7 (3) 0.10 to <0.15 12,434 169 107% 12,616 0.12% 125,283 11.32% - 413 3.27% 2 (2) 0.15 to <0.25 39,739 853 99% 40,585 0.19% 394,305 10.80% - 1,792 4.41% 8 (14) 0.25 to <0.50 36,668 599 102% 37,280 0.34% 331,266 11.47% - 2,674 7.17% 15 (25) 0.50 to <0.75 9,284 164 106% 9,458 0.59% 82,763 11.98% - 1,048 11.08% 7 (7) 0.75 to <2.50 30,142 787 107% 30,984 1.35% 265,405 12.27% - 6,068 19.58% 52 (110) 0.75 to <1.75 22,942 552 104% 23,518 1.11% 200,890 12.11% - 4,030 17.13% 32 (63) 1.75 to <2.5 7,200 234 114% 7,466 2.10% 64,515 12.78% - 2,038 27.30% 20 (47) 2.50 to <10.00 12,157 259 107% 12,435 4.82% 108,018 13.24% - 5,509 44.30% 81 (158) 2.5 to <5 7,750 124 104% 7,879 3.43% 66,430 12.88% - 2,879 36.54% 35 (70) 5 to <10 4,407 135 110% 4,556 7.23% 41,588 13.86% - 2,630 57.73% 46 (88) 10.00 to <100.00 2,966 26 101% 2,992 22.75% 28,929 14.37% - 2,327 77.77% 98 (107) 10 to <20 2,007 17 102% 2,024 13.89% 19,574 14.36% - 1,568 77.44% 41 (59) 20 to <30 423 4 99% 427 25.87% 4,173 14.56% - 384 89.82% 16 (18) 30.00 to <100.00 536 5 101% 541 53.46% 5,182 14.23% - 376 69.48% 41 (31) 100.00 (Default) 2,609 11 1% 2,609 100.00% 27,677 37.74% - 1,059 40.59% 900 (449) Subtotal Retail – SME Real estate 302,173 5,539 101% 307,749 14.68% 3,057,468 10.70% - 23,018 7.48% 1,169 (875) RETAIL – ELIGIBLE REVOLVING EXPOSURES 0.00 to <0.15 4,460 16,219 71% 15,909 0.07% 15,407,032 36.39% - 320 2.01% 5 (4) 0.00 to <0.10 4,308 14,763 75% 15,318 0.07% 14,232,520 37.45% - 302 1.97% 5 (3) 0.10 to <0.15 152 1,456 30% 591 0.05% 1,174,512 9.12% - 18 3.07% 0 (1) 0.15 to <0.25 940 1,393 77% 2,011 0.19% 2,815,942 30.14% - 69 3.44% 1 (1) 0.25 to <0.50 999 1,261 61% 1,766 0.31% 3,265,318 28.40% - 104 5.90% 2 (3) 0.50 to <0.75 298 646 58% 674 0.45% 1,130,918 17.92% - 61 9.08% 1 (1) 0.75 to <2.50 2,181 1,565 66% 3,213 1.13% 4,031,018 29.88% - 899 27.99% 21 (21) 0.75 to <1.75 1,180 1,148 68% 1,959 0.87% 2,354,018 30.76% - 415 21.18% 9 (11) 1.75 to <2.5 1,001 416 61% 1,254 1.55% 1,677,000 28.49% - 484 38.62% 12 (11) 2.50 to <10.00 1,940 840 51% 2,366 3.90% 2,173,285 31.38% - 1,392 58.84% 56 (40) 2.5 to <5 887 375 70% 1,151 3.48% 918,698 36.89% - 539 46.86% 19 (15) 5 to <10 1,053 465 35% 1,216 4.31% 1,254,587 26.17% - 853 70.17% 37 (25) 10.00 to <100.00 720 126 54% 788 17.02% 513,710 35.94% - 906 114.97% 78 (79) 10 to <20 443 87 61% 495 11.39% 304,641 37.26% - 502 101.27% 30 (38) 20 to <30 110 23 42% 120 21.02% 65,307 38.95% - 164 137.14% 13 (10) 30.00 to <100.00 168 16 33% 173 30.37% 143,762 30.10% - 240 138.83% 34 (31) 100.00 (Default) 581 11 11% 582 57.67% 329,013 41.45% - 406 69.84% 372 (343) Subtotal Retail – Eligible revolving exposures 12,119 22,061 70% 27,309 9.63% 29,666,236 33.85% - 4,159 15.23% 536 (491) RETAIL – OTHER SMES 0.00 to <0.15 1,387 139 83% 1,503 0.14% 129,770 25.31% - 114 7.56% 1 (1) 0.00 to <0.10 - - 0% - 0.00% - 0.00% - - 0.00% - - 0.10 to <0.15 1,387 139 83% 1,503 0.14% 129,770 25.31% - 114 7.56% 1 (1) 0.15 to <0.25 3,071 415 80% 3,402 0.20% 192,754 16.90% - 211 6.21% 1 (2) 0.25 to <0.50 4,032 660 80% 4,559 0.42% 249,498 21.90% - 536 11.76% 4 (4) 0.50 to <0.75 3,219 299 87% 3,480 0.63% 217,343 25.44% - 618 17.77% 5 (6) 0.75 to <2.50 9,483 1,261 86% 10,560 1.43% 545,680 30.45% - 3,122 29.57% 47 (64) 0.75 to <1.75 6,437 801 86% 7,124 1.17% 357,689 30.30% - 1,953 27.42% 25 (35) 1.75 to <2.5 3,045 460 85% 3,436 1.96% 187,991 30.75% - 1,169 34.03% 21 (29) 2.50 to <10.00 8,311 1,239 90% 9,422 4.66% 480,029 28.06% - 3,280 34.82% 122 (192) 2.5 to <5 4,581 690 88% 5,187 3.11% 293,381 28.34% - 1,749 33.71% 46 (65) 5 to <10 3,730 549 92% 4,235 6.55% 186,648 27.72% - 1,532 36.16% 76 (127) 10.00 to <100.00 4,554 391 86% 4,881 21.05% 195,026 27.79% - 2,557 52.38% 281 (362) 10 to <20 2,401 266 89% 2,637 14.65% 104,192 29.21% - 1,284 48.69% 112 (163) 20 to <30 1,588 89 79% 1,651 23.01% 59,025 25.12% - 892 54.04% 95 (100) 30.00 to <100.00 565 36 80% 593 44.03% 31,809 28.90% - 381 64.17% 74 (98) 100.00 (Default) 3,915 126 17% 3,935 100.00% 107,421 50.87% - 1,890 48.04% 1,858 (1,927) Subtotal Retail – Other SMEs 37,972 4,531 85% 41,742 21.55% 2,117,521 28.88% - 12,329 29.54% 2,319 (2,559) RETAIL – OTHER NON-SMES 0.00 to <0.15 27,080 911 95% 27,950 0.06% 1,439,552 19.25% - 951 3.40% 3 (4) 0.00 to <0.10 25,949 858 95% 26,766 0.05% 1,371,973 18.79% - 846 3.16% 3 (4) 0.10 to <0.15 1,131 53 100% 1,184 0.12% 67,579 29.68% - 105 8.86% 0 (1) 0.15 to <0.25 9,376 289 93% 9,646 0.19% 608,830 24.66% - 985 10.21% 5 (7) 0.25 to <0.50 9,606 260 96% 9,855 0.34% 503,121 24.69% - 1,475 14.97% 8 (14) 0.50 to <0.75 3,339 97 100% 3,436 0.59% 272,607 30.25% - 868 25.26% 6 (7) 0.75 to <2.50 9,723 281 101% 10,006 1.30% 1,774,142 31.68% - 4,070 40.68% 48 (62) 0.75 to <1.75 7,179 181 98% 7,357 1.10% 906,924 31.68% - 2,742 37.27% 28 (35) 1.75 to <2.5 2,544 100 106% 2,649 1.84% 867,218 31.71% - 1,328 50.14% 20 (27) 2.50 to <10.00 5,656 113 101% 5,770 4.90% 471,495 36.78% - 3,370 58.41% 111 (138) 2.5 to <5 3,350 63 99% 3,412 3.42% 257,637 36.00% - 1,843 54.03% 43 (48) 5 to <10 2,307 50 105% 2,359 7.04% 213,858 37.92% - 1,527 64.75% 68 (90) 10.00 to <100.00 1,374 19 101% 1,394 21.90% 208,217 35.08% - 1,147 82.29% 123 (126) 10 to <20 893 13 100% 905 13.76% 102,499 34.21% - 651 71.93% 46 (65) 20 to <30 214 4 105% 218 25.88% 19,861 39.23% - 221 101.54% 22 (21) 30.00 to <100.00 267 3 100% 270 45.93% 85,857 34.69% - 274 101.46% 55 (40) 100.00 (Default) 2,160 9 18% 2,162 96.37% 216,093 60.42% - 1,990 92.06% 1,198 (1,033) Subtotal Retail – Other non-SMEs 68,314 1,980 97% 70,219 17.83% 5,494,057 26.09% - 14,857 21.16% 1,501 (1,391) Total 607,134 143,292 61% 687,042 40,758,994 1 144,494 21.03% 9,268 (9,163) 12/31/2024 F-IRB
in millions of eurosPD range On-
balance
sheet
exposuresOff-
balance-
sheet
exposures
pre-CCFExposure
weighted
average
CCFExposure
post CCF
and post
CRMExposure
weighted
average
PD (%)Number of
obligorsExposure
weighted
average
LGD (%)Exposure
weighted
average
maturity
(years)Risk
weighted
exposure
amount after
supporting
factorDensity of
risk
weighted
exposure
amountExpected
loss amountValue
adjustments
and
provisionsa b c d e f g h i j k l m CENTRAL GOVERNMENTS AND CENTRAL BANKS 0.00 to <0.15 - - 0% - 0.00% - 0.00% - - 0.00% - - 0.00 to <0.10 - - 0% - 0.00% - 0.00% - - 0.00% - - 0.10 to <0.15 - - 0% - 0.00% - 0.00% - - 0.00% - - 0.15 to <0.25 39 0 100% 39 0.21% 4 41.62% 3 17 43.21% 0 (0) 0.25 to <0.50 0 - 0% 0 0.39% 3 35.31% 3 0 51.55% 0 (0) 0.50 to <0.75 - - 0% - 0.00% - 0.00% - - 0.00% - - 0.75 to <2.50 17 1 100% 18 1.04% 2 40.31% 3 16 88.89% 0 (0) 0.75 to <1.75 17 1 100% 18 1.04% 2 40.31% 3 16 88.89% 0 (0) 1.75 to <2.5 - - 0% - 0.00% - 0.00% - - 0.00% - - 2.50 to <10.00 - - 0% - 0.00% - 0.00% - - 0.00% - - 2.5 to <5 - - 0% - 0.00% - 0.00% - - 0.00% - - 5 to <10 - - 0% - 0.00% - 0.00% - - 0.00% - - 10.00 to <100.00 9 1 75% 10 19.06% 1 26.92% 3 15 149.53% 1 (1) 10 to <20 9 1 75% 10 19.06% 1 26.92% 3 15 149.53% 1 (1) 20 to <30 - - 0% - 0.00% - 0.00% - - 0.00% - - 30.00 to <100.00 - - 0% - 0.00% - 0.00% - - 0.00% - - 100.00 (Default) - - 0% - 0.00% - 0.00% - - 0.00% - - Subtotal Central governments and central banks 65 2 85% 67 61.27% 10 39.03% 3 48 71.41% 1 (1) Institutions 0.00 to <0.15 4,353 97 55% 4,407 0.04% 124 27.99% 3 584 13.24% 0 (2) 0.00 to <0.10 4,353 97 55% 4,407 0.04% 124 27.99% 3 584 13.24% 0 (2) 0.10 to <0.15 - - 0% - 0.00% - 0.00% - - 0.00% - - 0.15 to <0.25 - - 0% 34 0.04% - 45.00% 3 6 17.86% 0 (0) 0.25 to <0.50 468 249 75% 684 0.24% 53 26.55% 3 261 38.10% 0 (1) 0.50 to <0.75 96 123 68% 332 0.40% 30 44.05% 3 223 67.27% 1 (1) 0.75 to <2.50 - - 0% 346 0.03% - 45.00% 3 70 20.29% 0 (0) 0.75 to <1.75 - - 0% 316 0.03% - 45.00% 3 66 20.75% 0 (0) 1.75 to <2.5 - - 0% 29 0.03% - 45.00% 3 5 15.31% 0 (0) 2.50 to <10.00 6 47 90% 463 0.42% 20 45.00% 3 170 36.64% 1 (1) 2.5 to <5 6 47 90% 347 0.54% 17 45.00% 3 145 41.93% 1 (1) 5 to <10 0 - 0% 116 0.04% 3 45.00% 3 24 20.81% 0 (0) 10.00 to <100.00 5 2 100% 124 0.56% 3 45.00% 3 40 32.11% 0 (2) 10 to <20 5 2 100% 60 1.14% 3 45.00% 3 27 44.44% 0 (2) 20 to <30 - - 0% 11 0.03% - 45.00% 3 2 20.84% 0 (0) 30.00 to <100.00 - - 0% 53 0.03% - 45.00% 3 11 20.69% 0 (0) 100.00 (Default) 0 - 0% 168 0.03% 1 44.99% 3 36 21.56% 1 (44) Subtotal Institutions 4,928 517 71% 6,557 0.63% 231 31.59% 3 1,389 21.19% 4 (51) CORPORATES – SME 0.00 to <0.15 178 294 64% 367 0.04% 175 44.61% 3 46 12.58% 0 (0) 0.00 to <0.10 178 294 64% 367 0.04% 43 44.61% 3 46 12.58% 0 (0) 0.10 to <0.15 0 - 0% 0 0.15% 132 35.00% 3 0 29.09% 0 (0) 0.15 to <0.25 578 128 82% 607 0.18% 2,383 42.04% 3 159 26.17% 0 (1) 0.25 to <0.50 422 96 63% 473 0.37% 581 41.92% 3 186 39.37% 1 (0) 0.50 to <0.75 6,082 1,244 77% 6,262 0.59% 19,738 41.03% 3 2,869 45.82% 15 (17) 0.75 to <2.50 10,525 1,997 60% 10,820 1.44% 29,804 40.81% 3 6,768 62.55% 63 (83) 0.75 to <1.75 10,257 1,684 66% 10,439 1.41% 29,012 40.73% 3 6,477 62.04% 60 (79) 1.75 to <2.5 269 313 31% 381 2.09% 792 43.12% 3 291 76.37% 3 (4) 2.50 to <10.00 9,645 1,534 67% 9,906 4.29% 28,681 41.33% 3 8,359 84.38% 175 (238) 2.5 to <5 6,291 899 71% 6,519 3.13% 18,003 41.09% 3 5,064 77.69% 83 (119) 5 to <10 3,354 635 61% 3,387 6.52% 10,678 41.79% 3 3,294 97.26% 92 (119) 10.00 to <100.00 1,634 321 51% 1,559 20.28% 5,868 41.35% 3 2,056 131.88% 130 (134) 10 to <20 1,173 260 51% 1,127 13.94% 4,137 41.42% 3 1,447 128.38% 65 (86) 20 to <30 124 24 43% 112 24.30% 465 41.60% 3 168 150.27% 11 (13) 30.00 to <100.00 337 38 57% 320 41.18% 1,266 41.02% 3 441 137.75% 54 (35) 100.00 (Default) 1,695 142 58% 1,288 95.63% 4,752 42.35% 3 60 4.63% 520 (683) Subtotal Corporates – SME 30,760 5,758 66% 31,282 8.87% 91,982 41.20% 3 20,503 65.54% 905 (1,156) CORPORATES – SPECIALIZED FINANCING 0.00 to <0.15 - - 0% - 0.00% - 0.00% - - 0.00% - - 0.00 to <0.10 - - 0% - 0.00% - 0.00% - - 0.00% - - 0.10 to <0.15 - - 0% - 0.00% - 0.00% - - 0.00% - - 0.15 to <0.25 - - 0% - 0.00% - 0.00% - - 0.00% - - 0.25 to <0.50 - - 0% - 0.00% - 0.00% - - 0.00% - - 0.50 to <0.75 - - 0% - 0.00% - 0.00% - - 0.00% - - 0.75 to <2.50 - - 0% - 0.00% - 0.00% - - 0.00% - - 0.75 to <1.75 - - 0% - 0.00% - 0.00% - - 0.00% - - 1.75 to <2.5 - - 0% - 0.00% - 0.00% - - 0.00% - - 2.50 to <10.00 - - 0% - 0.00% - 0.00% - - 0.00% - - 2.5 to <5 - - 0% - 0.00% - 0.00% - - 0.00% - - 5 to <10 - - 0% - 0.00% - 0.00% - - 0.00% - - 10.00 to <100.00 - - 0% - 0.00% - 0.00% - - 0.00% - - 10 to <20 - - 0% - 0.00% - 0.00% - - 0.00% - - 20 to <30 - - 0% - 0.00% - 0.00% - - 0.00% - - 30.00 to <100.00 - - 0% - 0.00% - 0.00% - - 0.00% - - 100.00 (Default) - - 0% - 0.00% - 0.00% - - 0.00% - - Subtotal Corporates – Specialized financing - - 0% - 0.00% - 0.00% - - 0.00% - - CORPORATES – OTHER 0.00 to <0.15 3,928 3,095 65% 5,976 0.06% 765 44.51% 3 1,338 22.39% 1 (1) 0.00 to <0.10 3,926 3,095 65% 5,974 0.06% 753 44.52% 3 1,338 22.40% 1 (1) 0.10 to <0.15 2 - 0% 2 0.15% 12 20.00% 3 0 17.56% 0 (0) 0.15 to <0.25 1,667 292 81% 1,583 0.18% 800 42.47% 3 632 39.94% 1 (3) 0.25 to <0.50 3,853 2,064 73% 5,277 0.38% 1,485 43.64% 3 3,338 63.27% 9 (4) 0.50 to <0.75 1,410 435 77% 1,687 0.55% 2,094 42.49% 3 1,232 73.05% 4 (4) 0.75 to <2.50 6,154 1,961 67% 7,387 1.26% 5,751 43.10% 3 7,194 97.39% 40 (39) 0.75 to <1.75 5,475 1,747 67% 6,535 1.14% 5,256 43.19% 3 6,230 95.33% 32 (33) 1.75 to <2.5 679 214 66% 852 2.18% 495 42.41% 3 965 113.24% 8 (6) 2.50 to <10.00 4,706 977 73% 5,620 3.96% 6,198 42.73% 3 7,464 132.81% 94 (105) 2.5 to <5 3,140 591 76% 3,809 2.99% 4,023 42.84% 3 4,665 122.48% 48 (50) 5 to <10 1,565 386 69% 1,811 5.99% 2,175 42.50% 3 2,799 154.55% 46 (55) 10.00 to <100.00 1,053 276 67% 1,114 18.15% 1,489 43.01% 3 2,328 208.89% 86 (85) 10 to <20 834 212 71% 846 13.79% 807 43.56% 3 1,801 212.81% 51 (65) 20 to <30 16 3 37% 17 19.22% 171 39.44% 3 34 193.88% 1 (1) 30.00 to <100.00 203 61 55% 251 32.82% 511 41.38% 3 493 196.70% 34 (19) 100.00 (Default) 1,175 158 43% 985 97.35% 3,540 42.75% 3 27 2.75% 409 (624) Subtotal Corporates – Other 23,946 9,259 70% 29,629 10.44% 22,122 43.33% 3 23,555 79.50% 645 (864) Total 59,698 15,536 89% 67,535 114,345 3 45,494 67.36% 1,554 (2,072) 12/31/2025 Total exposure
value as defined in
Article 166 CRR for
exposures subject to
IRB approachTotal exposure value
for exposures
subject to the
Standardised
approach and to the
IRB approachPercentage of total
exposure value subject
to the permanent partial
use of the SA (%)Percentage of total
exposure value
subject to IRB
approach (%)Percentage of total
exposure value
subject to a roll-out
plan (%)in millions of euros a b c d e 1 Central governments or central banks 11 308,032 100% 0% 0% 2 Regional government or local authorities - 47,586 39% 0% 61% 3 Public sector entities 70 22,144 58% 0% 42% 4 Institutions 55,112 19% 66% 15% 5 Corporates 327,257 441,808 7% 74% 19% 5.1 Of which Corporates – General 375,959 7% 6% 87% 5.2 Of which Corporates – Specialised lending 65,849 4% 75% 21% 5.2.1 Of which Corporates – Specialised lending, excluding slotting approach 65,849 4% 75% 21% 5.2.2 Of which Corporates – Specialised lending under slotting approach - 4% 75% 21% 5.3 Of which Corporates – Purchased Receivables 1 0% 100% 0% 6 Retail 529,870 546,342 2% 97% 1% 6.1 of which Retail – Qualifying revolving 33,855 0% 100% 0% 6.2 of which Retail – Secured by residential immovable property 379,833 3% 96% 1% 6.3 Of which Retail - Purchased receivables - - 0% 0% 0% 6.4 Of which Retail - Other retail exposures 126,002 138,502 6% 91% 3% 7 Equity 1,734 9,554 82% 18% (0%) EU 7a Collective investment undertakings (CIU) 161 6,520 98% 2% 0% 8 Other non-credit obligation assets - 24,438 100% 0% 0% 9 Total 895,254 1,461,536 30% 61% 9% 12/31/2024 Total exposure value
as defined in Article
166 CRR for
exposures subject to
IRB approachTotal exposure value
for exposures
subject to the
Standardised
approach and to the
IRB approachPercentage of total
exposure value subject
to the permanent partial
use of the SA (%)Percentage of total
exposure value
subject to IRB
approach (%)Percentage of total
exposure value
subject to a roll-out
plan (%)in millions of euros a b c d e 1 Central governments or central banks 6,422 376,365 87% 12% 2% 1.1 Regional governments or local authorities 46,999 37% 63% 0% 1.2 Public sector entities 24,506 52% 47% 0% 2 Institutions 35,824 58,032 20% 18% 62% 3 Corporates 305,291 423,853 7% 21% 72% 3.1 Of which Corporates – Specialised lending, excluding slotting approach 85,851 0% 56% 44% 3.2 Of which Corporates – Specialised lending under slotting approach 192 0% 50% 50% 4 Retail 523,869 546,279 3% 2% 96% 4.1 of which Retail – Secured by real estate SMEs 71,454 0% 2% 98% 4.2 of which Retail – Secured by real estate non- SMEs 326,271 0% 6% 94% 4.3 of which Retail – Qualifying revolving 33,476 0% 0% 100% 4.4 of which Retail – Other SMEs 43,463 0% 2% 98% 4.5 of which Retail – Other non-SMEs 71,615 0% 2% 98% 5 Equity 12,366 12,366 0% 0% 100% 6 Other non-credit obligation assets 15,203 21,843 30% 0% 70% 7 Total 898,973 1,438,739 27% 11% 62% 12/31/2025 Pre-credit derivatives risk
weighted exposure amountActual risk weighted
exposure amountin millions of euros a b 1 Central governments and central banks - F-IRB - - EU 1a Regional governments and local authorities - F-IRB - - EU 1b Public sector entities - F-IRB 41 41 2 Central governments and central banks - A-IRB - - EU 2a Regional governments and local authorities - A-IRB - - EU 2b Public sector entities - A-IRB - - 3 Institutions – F-IRB 3,532 3,532 5 Corporates – F-IRB 50,418 50,418 EU 5a Corporates - General 50,412 50,412 EU 5b Corporates - Specialised lending 7 7 EU 5c Corporates - Purchased receivables 0 0 6 Corporate – A-IRB 62,388 62,388 EU 6a Corporates - General 52,969 52,969 EU 6b Corporates - Specialised lending 9,419 9,419 EU 6c Corporates - Purchased receivables - - EU 8a Retail - A-IRB 70,436 71,522 9 Retail – Qualifying revolving (QRRE) 3,885 4,599 10 Retail – Secured by residential immovable property 33,670 33,670 EU10a Retail - Purchased receivables - - EU10b Retail - Other retail exposures 32,882 33,254 17 Exposures under F-IRB 53,991 53,991 18 Exposures under A-IRB 132,824 133,910 19 Total Exposures 186,816 187,902 12/31/2024 Pre-credit derivatives risk-
weighted exposure amountActual risk-weighted
exposure amountin millions of euros a b 1 Exposures under F-IRB 45,560 45,570 2 Central governments and central banks 48 48 3 Institutions 1,392 1,392 4 Corporates 44,121 44,131 4.1 of which Corporates - SME 20,506 20,506 4.2 of which Corporates - Specialised lending 62 62 5 Exposures under advanced IRB approach 143,064 144,104 6 Central governments and central banks - - 7 Institutions 1,974 1,974 8 Corporates 69,214 69,214 8.1 of which Corporates - SME 10,239 10,239 8.2 of which Corporates - Specialised lending 8,898 8,898 9 Retail 71,876 72,916 9.1 of which Retail - SMEs - Secured by immovable property collateral 18,942 18,942 9.2 of which Retail - non-SMEs - Secured by immovable property collateral 23,018 23,018 9.3 of which Retail – Qualifying revolving (QRRE) 3,119 3,769 9.4 of which Retail – SMEs - Other 12,329 12,329 9.5 of which Retail – Non-SMEs - Other 14,467 14,857 10 Total (including foundation and advanced IRB exposure approaches) 188,624 189,675 12/31/2025 Credit risk Mitigation techniques Funded credit Protection (FCP) Unfunded credit
Protection (UFCP)A-IRB Total
exposuresPart of
exposures
covered by
Financial
Collaterals
(%)Part of
exposures
covered by
Other
eligible
collaterals
(%)Part of
exposures
covered by
Immovable
property
Collaterals
(%)Part of
exposures
covered by
Receivables
(%)Part of
exposures
covered by
Other
physical
collateral
(%)Part of
exposures
covered by
Other
funded
credit
protection
(%)Part of
exposures
covered by
Cash on
deposit (%)Part of
exposures
covered by
Life
insurance
policies (%)Part of
exposures
covered by
Instruments
held by a
third party
(%)Part of
exposures
covered by
Guarantees
(%)Part of
exposures
covered by
Credit
Derivatives
(%)RWEA with
substitution
effects (both
reduction
and
substitution
effects)in millions of euros a b c d e f g h i j k l n 1 Central governments and central banks 1 0.00% 0.00% 0.00% 0.00% 0.00% 0.00% 0.00% 0.00% 0.00% 0.00% 0.00% - 2 Regional government and local authorities - 0.00% 0.00% 0.00% 0.00% 0.00% 0.00% 0.00% 0.00% 0.00% 0.00% 0.00% - 3 Public sector entities - 0.00% 0.00% 0.00% 0.00% 0.00% 0.00% 0.00% 0.00% 0.00% 0.00% 0.00% - 5 Corporates 120,091 0.00% 43.41% 19.58% 13.82% 10.01% 1.65% 1.65% 0.00% 0.00% 0.00% 0.00% 62,388 5.1 Corporates – General 86,898 0.00% 31.53% 20.49% 2.47% 8.58% 1.98% 1.98% 0.00% 0.00% 0.00% 0.00% 52,969 5.2 Corporates – Specialised lending 33,193 0.00% 74.52% 17.22% 43.55% 13.75% 0.80% 0.80% 0.00% 0.00% 0.00% 0.00% 9,419 5.3 Corporates - Purchased Receivables - 0.00% 0.00% 0.00% 0.00% 0.00% 0.00% 0.00% 0.00% 0.00% 0.00% 0.00% - 6 Retail 514,687 0.10% 72.93% 71.86% 0.01% 1.06% 0.04% 0.04% 0.00% 0.00% 3.23% 0.00% 71,522 6.1 Retail - Qualifying revolving 26,836 0.00% 0.00% 0.00% 0.00% 0.00% 0.00% 0.00% 0.00% 0.00% 0.00% 0.00% 4,599 6.2 Retail - secured by residential immovable property 363,322 0.00% 97.70% 97.70% 0.00% 0.00% 0.00% 0.00% 0.00% 0.00% 0.00% 0.00% 33,670 6.3 Retail - Purchased Receivables - 0.00% 0.00% 0.00% 0.00% 0.00% 0.00% 0.00% 0.00% 0.00% 0.00% 0.00% - 6.4 Retail - Other retail exposures 124,529 0.39% 16.38% 11.95% 0.06% 4.37% 0.15% 0.15% 0.00% 0.00% 13.33% 0.00% 33,254 7 Total 634,779 0.08% 67.35% 61.97% 2.63% 2.75% 0.34% 0.34% 0.00% 0.00% 2.62% 0.00% 133,910 12/31/2025 Credit risk Mitigation techniques Funded credit Protection (FCP) Unfunded credit
Protection (UFCP)F-IRB Total
exposuresPart of
exposures
covered by
Financial
Collaterals
(%)Part of
exposures
covered by
Other
eligible
collaterals
(%)Part of
exposures
covered by
Immovable
property
Collaterals
(%)Part of
exposures
covered by
Receivables (%)Part of
exposures
covered by
Other
physical
collateral
(%)Part of
exposures
covered by
Other
funded
credit
protection
(%)Part of
exposures
covered by
Cash on
deposit (%)Part of
exposures
covered by
Life
insurance
policies (%)Part of
exposures
covered by
Instruments
held by a
third party
(%)Part of
exposures
covered by
Guarantees
(%)Part of
exposures
covered by
Credit
Derivatives
(%)RWEA with
substitution
effects (both
reduction and
substitution
effects)in millions of euros a b c d e f g h i j k l n 1 Central governments and central banks - 0.00% 0.00% 0.00% 0.00% 0.00% 0.00% 0.00% 0.00% 0.00% 0.00% 0.00% - 2 Regional government and local authorities - 0.00% 0.00% 0.00% 0.00% 0.00% 0.00% 0.00% 0.00% 0.00% 0.00% 0.00% - 3 Public sector entities 101 0.00% 66.60% 66.60% 0.00% 0.00% 0.02% 0.02% 0.00% 0.00% 0.00% 0.00% 41 4 Institutions 15,095 0.00% 0.01% 0.00% 0.00% 0.00% 0.10% 0.10% 0.00% 0.00% 0.00% 0.00% 3,532 5 Corporates 105,175 0.00% 5.52% 3.15% 0.65% 1.72% 2.13% 2.13% 0.00% 0.00% 0.00% 0.00% 50,418 5.1 Corporates – General 105,145 0.00% 5.50% 3.15% 0.65% 1.71% 2.13% 2.13% 0.00% 0.00% 0.00% 0.00% 50,412 5.2 Corporates – Specialised lending 29 0.00% 52.61% 0.00% 0.00% 52.61% 0.00% 0.00% 0.00% 0.00% 0.00% 0.00% 7 5.3 Corporates – Purchased Receivables 1 0.00% 0.00% 0.00% 0.00% 0.00% 0.00% 0.00% 0.00% 0.00% 0.00% 0.00% 0 6 Total 120,371 0.00% 4.88% 2.81% 0.56% 1.51% 1.87% 1.87% 0.00% 0.00% 0.00% 0.00% 53,991 12/31/2024 Credit risk Mitigation techniques Funded credit Protection (FCP) Unfunded credit
Protection (UFCP)A-IRB Total
exposuresPart of
exposures
covered by
Financial
Collaterals
(%)Part of
exposures
covered by
Other
eligible
collaterals
(%)Part of
exposures
covered by
Immovable
property
Collaterals
(%)Part of
exposures
covered by
Receivables (%)Part of
exposures
covered by
Other
physical
collateral
(%)Part of
exposures
covered by
Other
funded
credit
protection
(%)Part of
exposures
covered by
Cash on
deposit (%)Part of
Exposures
covered by
Life
insurance
policies (%)Part of
exposures
covered by
Instruments
held by a
third party
(%)Part of
exposures
covered by
Guarantees
(%)Part of
exposures
covered by
Credit
Derivatives
(%)RWEA with
substitution
effects (both
reduction and
substitution
effects)in millions of euros a b c d e f g h i j k l n 1 Central governments and central banks 70,124 0% 0% 0% 0% 0% 0% 0% 0% 0% 0% 0% 475 2 Institutions 6,968 0% 0% 0% 0% 0% 3% 3% 0% 0% 0% 0% 1,598 3 Corporates 113,043 2% 24% 8% 10% 7% 1% 1% 0% 0% 0% 0% 43,486 3.1 Of which Corporates – SMEs 6,735 0% 40% 11% 2% 27% 0% 0% 0% 0% 0% 0% 3,767 3.2 Of which Corporates – Specialised lending 20,758 0% 92% 30% 50% 12% 1% 1% 0% 0% 0% 0% 7,628 3.3 Of which Corporates – Other 85,550 3% 7% 2% 1% 4% 1% 1% 0% 0% 0% 0% 32,091 4 Retail 520,493 0% 16% 13% 0% 3% 0% 0% 0% 0% 51% 0% 72,196 4.1 Of which Retail – Immovable property SMEs 67,847 0% 40% 36% 0% 4% 0% 0% 0% 0% 45% 0% 18,541 4.2 Of which Retail – Immovable property non-SMEs 308,983 0% 13% 13% 0% 0% 0% 0% 0% 0% 69% 0% 22,819 4.3 Of which Retail – Qualifying revolving 23,933 0% 46% 0% 0% 46% 0% 0% 0% 0% 0% 0% 3,513 4.4 Of which Retail – Other SMEs 45,191 1% 7% 0% 0% 7% 1% 0% 0% 0% 33% 0% 12,866 4.5 Of which Retail – Other non-SMEs 74,539 1% 1% 0% 0% 1% 1% 0% 0% 0% 10% 0% 14,457 5 Total 710,629 0.41% 15.74% 10.52% 1.58% 3.64% 0.34% 0.14% 0.00% 0.00% 37.54% 0.00% 117,756 12/31/2024 Credit risk Mitigation techniques Funded credit Protection (FCP) Unfunded credit
protection (UFCP)F-IRB Total
exposuresPart of
exposures
covered by
Financial
Collaterals
(%)Part of
exposures
covered by
Other
eligible
collaterals
(%)Part of
exposures
covered by
Immovable
property
Collaterals
(%)Part of
exposures
covered by
Receivables (%)Part of
exposures
covered by
Other
physical
collateral
(%)Part of
exposures
covered by
Other
funded
credit
protection
(%)Part of
exposures
covered by
Cash on
deposit (%)Part of
exposures
covered by
Life
insurance
policies (%)Part of
exposures
covered by
Instruments
held by a
third party
(%)Part of
exposures
covered by
Guarantees
(%)Part of
exposures
covered by
credit
derivatives
(%)RWEA with
substitution
effects (both
reduction and
substitution
effects)in millions of euros a b c d e f g h i j k l n 1 Central governments and central banks 135,437 0.00% 0.05% 0.02% 0.00% 0.03% 0.00% 0.00% 0.00% 0.00% 0.00% 0.00% 281 2 Institutions 4,040 0.00% 4.06% 1.03% 0.10% 2.92% 0.02% 0.02% 0.00% 0.00% 0.00% 0.00% 1,142 3 Corporates 74,324 0.00% 23.84% 15.18% 2.05% 6.61% 0.90% 0.90% 0.00% 0.00% 0.00% 0.00% 57,875 3.1 Of which Corporates – SMEs 38,448 0.00% 32.40% 21.00% 2.42% 8.98% 1.35% 1.35% 0.00% 0.00% 0.00% 0.00% 26,282 3.2 Of which Corporates – Specialised lending 113 0.00% 4.90% 0.00% 4.90% 0.00% 0.00% 0.00% 0.00% 0.00% 0.00% 0.00% 80 3.3 Of which Corporates – Other 35,764 0.00% 14.71% 8.98% 1.65% 4.08% 0.43% 0.43% 0.00% 0.00% 0.00% 0.00% 31,513 4 Total 213,802 0.00% 8.40% 5.31% 0.72% 2.37% 0.32% 0.32% 0.00% 0.00% 0.00% 0.00% 59,298 Risk weighted
exposure amountin millions of euros a 1 09/30/2025 188,946 2 Asset size (+/-) 4,214 3 Asset quality (+/-) (1,645) 4 Model updates (+/-) (3,284) 5 Methodology and policy (+/-) - 6 Acquisitions and disposals (+/-) - 7 Foreign exchange movements (+/-) 9 8 Other (+/-) (338) 9 12/31/2025 187,902 A-IRB 12/31/2025 Number of obligors at the end of the
previous yearExposure class
in millions of eurosPD range of which: number
of obligors which
defaulted during
the yearObserved average
default rate (%)Exposures
weighted average
PD (%)Average PD (%) Average historical
annual default
rate (%)a b c d e f g h CENTRAL GOVERNMENTS
AND CENTRAL BANKS0.00 to <0.15 12 - 0% 0% 0% 0% 0.00 to <0.10 12 - 0% 0% 0% 0% 0.10 to <0.15 - - 0% 0% 0% 0% 0.15 to <0.25 - - 0% 0% 0% 0% 0.25 to <0.50 - - 0% 0% 0% 0% 0.50 to <0.75 - - 0% 0% 0% 0% 0.75 to <2.50 - - 0% 0% 0% 0% 0.75 to <1.75 - - 0% 0% 0% 0% 1.75 to <2.5 - - 0% 0% 0% 0% 2.50 to <10.00 - - 0% 0% 0% 0% 2.5 to <5 - - 0% 0% 0% 0% 5 to <10 - - 0% 0% 0% 0% 10.00 to <100.00 - - 0% 0% 0% 0% 10 to <20 - - 0% 0% 0% 0% 20 to <30 - - 0% 0% 0% 0% 30.00 to <100.00 - - 0% 0% 0% 0% 100.00 (Default) - - 0% 0% 0% 0% Regional government or
local authorities0.00 to <0.15 - - 0% 0% 0% 0% 0.00 to <0.10 - - 0% 0% 0% 0% 0.10 to <0.15 - - 0% 0% 0% 0% 0.15 to <0.25 - - 0% 0% 0% 0% 0.25 to <0.50 - - 0% 0% 0% 0% 0.50 to <0.75 - - 0% 0% 0% 0% 0.75 to <2.50 - - 0% 0% 0% 0% 0.75 to <1.75 - - 0% 0% 0% 0% 1.75 to <2.5 - - 0% 0% 0% 0% 2.50 to <10.00 - - 0% 0% 0% 0% 2.5 to <5 - - 0% 0% 0% 0% 5 to <10 - - 0% 0% 0% 0% 10.00 to <100.00 - - 0% 0% 0% 0% 10 to <20 - - 0% 0% 0% 0% 20 to <30 - - 0% 0% 0% 0% 30.00 to <100.00 - - 0% 0% 0% 0% 100.00 (Default) - - 0% 0% 0% 0% Public sector entities 0.00 to <0.15 - - 0% 0% 0% 0% 0.00 to <0.10 - - 0% 0% 0% 0% 0.10 to <0.15 - - 0% 0% 0% 0% 0.15 to <0.25 - - 0% 0% 0% 0% 0.25 to <0.50 - - 0% 0% 0% 0% 0.50 to <0.75 - - 0% 0% 0% 0% 0.75 to <2.50 - - 0% 0% 0% 0% 0.75 to <1.75 - - 0% 0% 0% 0% 1.75 to <2.5 - - 0% 0% 0% 0% 2.50 to <10.00 - - 0% 0% 0% 0% 2.5 to <5 - - 0% 0% 0% 0% 5 to <10 - - 0% 0% 0% 0% 10.00 to <100.00 - - 0% 0% 0% 0% 10 to <20 - - 0% 0% 0% 0% 20 to <30 - - 0% 0% 0% 0% 30.00 to <100.00 - - 0% 0% 0% 0% 100.00 (Default) - - 0% 0% 0% 0% CORPORATES –
SPECIALISED LENDING0.00 to <0.15 103 - 0% 0% 0% 0% 0.00 to <0.10 103 - 0% 0% 0% 0% 0.10 to <0.15 - - 0% 0% 0% 0% 0.15 to <0.25 112 - 0% 0% 0% 0% 0.25 to <0.50 540 - 0% 0% 0% 0% 0.50 to <0.75 - - 0% 1% 0% 0% 0.75 to <2.50 261 - 0% 1% 1% 0% 0.75 to <1.75 261 - 0% 1% 1% 0% 1.75 to <2.5 - - 0% 2% 0% 0% 2.50 to <10.00 130 3 2% 6% 6% 4% 2.5 to <5 53 - 0% 5% 5% 4% 5 to <10 77 3 4% 7% 6% 4% 10.00 to <100.00 43 6 14% 30% 24% 16% 10 to <20 21 2 10% 14% 14% 12% 20 to <30 2 - 0% 0% 22% 20% 30.00 to <100.00 20 4 20% 38% 35% 20% 100.00 (Default) 35 - 0% 100% 100% 100% CORPORATES – OTHER 0.00 to <0.15 791 - 0% 0% 0% 0% 0.00 to <0.10 762 - 0% 0% 0% 0% 0.10 to <0.15 29 - 0% 0% 0% 0% 0.15 to <0.25 673 - 0% 0% 0% 0% 0.25 to <0.50 2,521 1 0% 0% 0% 0% 0.50 to <0.75 452 - 0% 1% 1% 0% 0.75 to <2.50 5,295 25 0% 2% 2% 1% 0.75 to <1.75 3,336 15 0% 1% 1% 1% 1.75 to <2.5 1,959 10 1% 2% 2% 1% 2.50 to <10.00 4,577 96 2% 5% 5% 2% 2.5 to <5 3,365 49 1% 3% 4% 2% 5 to <10 1,212 47 4% 7% 7% 4% 10.00 to <100.00 1,350 103 8% 18% 23% 6% 10 to <20 605 58 10% 13% 13% 6% 20 to <30 15 4 27% 26% 25% 19% 30.00 to <100.00 730 41 6% 40% 32% 5% 100.00 (Default) 954 - 0% 100% 100% 100% Corporates – Purchased
receivables0.00 to <0.15 - - 0% 0% 0% 0% 0.00 to <0.10 - - 0% 0% 0% 0% 0.10 to <0.15 - - 0% 0% 0% 0% 0.15 to <0.25 - - 0% 0% 0% 0% 0.25 to <0.50 - - 0% 0% 0% 0% 0.50 to <0.75 - - 0% 0% 0% 0% 0.75 to <2.50 - - 0% 0% 0% 0% 0.75 to <1.75 - - 0% 0% 0% 0% 1.75 to <2.5 - - 0% 0% 0% 0% 2.50 to <10.00 - - 0% 0% 0% 0% 2.5 to <5 - - 0% 0% 0% 0% 5 to <10 - - 0% 0% 0% 0% 10.00 to <100.00 - - 0% 0% 0% 0% 10 to <20 - - 0% 0% 0% 0% 20 to <30 - - 0% 0% 0% 0% 30.00 to <100.00 - - 0% 0% 0% 0% 100.00 (Default) - - 0% 0% 0% 0% Retail – Eligible revolving
exposures0.00 to <0.15 13,352,326 1,237 0% 0% 0% 0% 0.00 to <0.10 12,909,034 1,114 0% 0% 0% 0% 0.10 to <0.15 443,292 123 0% 0% 0% 0% 0.15 to <0.25 2,815,942 1,235 0% 0% 0% 0% 0.25 to <0.50 3,067,316 2,007 0% 0% 0% 0% 0.50 to <0.75 954,862 1,370 0% 1% 1% 0% 0.75 to <2.50 2,696,316 8,772 0% 2% 1% 0% 0.75 to <1.75 1,808,041 5,063 0% 1% 1% 0% 1.75 to <2.5 888,275 3,709 0% 2% 2% 1% 2.50 to <10.00 1,726,538 25,865 2% 5% 5% 1% 2.5 to <5 856,135 8,650 1% 4% 4% 1% 5 to <10 870,403 17,215 2% 7% 7% 2% 10.00 to <100.00 359,689 34,738 10% 21% 21% 5% 10 to <20 254,875 13,289 5% 13% 14% 3% 20 to <30 44,942 6,013 13% 24% 25% 4% 30.00 to <100.00 59,872 15,436 26% 45% 52% 24% 100.00 (Default) 150,602 - 0% 100% 100% 100% Retail – Other 0.00 to <0.15 - - 0% 0% 0% 0% 0.00 to <0.10 - - 0% 0% 0% 0% 0.10 to <0.15 - - 0% 0% 0% 0% 0.15 to <0.25 - - 0% 0% 0% 0% 0.25 to <0.50 - - 0% 0% 0% 0% 0.50 to <0.75 - - 0% 1% 0% 0% 0.75 to <2.50 - - 0% 1% 0% 0% 0.75 to <1.75 - - 0% 1% 0% 0% 1.75 to <2.5 - - 0% 2% 0% 0% 2.50 to <10.00 - - 0% 5% 0% 0% 2.5 to <5 - - 0% 4% 0% 0% 5 to <10 - - 0% 7% 0% 0% 10.00 to <100.00 - - 0% 23% 0% 0% 10 to <20 - - 0% 14% 0% 0% 20 to <30 - - 0% 22% 0% 0% 30.00 to <100.00 - - 0% 46% 0% 0% 100.00 (Default) - - 0% 100% 0% 0% Retail – Purchased
receivables0.00 to <0.15 - - 0% 0% 0% 0% 0.00 to <0.10 - - 0% 0% 0% 0% 0.10 to <0.15 - - 0% 0% 0% 0% 0.15 to <0.25 - - 0% 0% 0% 0% 0.25 to <0.50 - - 0% 0% 0% 0% 0.50 to <0.75 - - 0% 0% 0% 0% 0.75 to <2.50 - - 0% 0% 0% 0% 0.75 to <1.75 - - 0% 0% 0% 0% 1.75 to <2.5 - - 0% 0% 0% 0% 2.50 to <10.00 - - 0% 0% 0% 0% 2.5 to <5 - - 0% 0% 0% 0% 5 to <10 - - 0% 0% 0% 0% 10.00 to <100.00 - - 0% 0% 0% 0% 10 to <20 - - 0% 0% 0% 0% 20 to <30 - - 0% 0% 0% 0% 30.00 to <100.00 - - 0% 0% 0% 0% 100.00 (Default) - - 0% 0% 0% 0% Equity 0.00 to <0.15 - - 0% 0% 0% 0% 0.00 to <0.10 - - 0% 0% 0% 0% 0.10 to <0.15 - - 0% 0% 0% 0% 0.15 to <0.25 - - 0% 0% 0% 0% 0.25 to <0.50 - - 0% 0% 0% 0% 0.50 to <0.75 - - 0% 1% 0% 0% 0.75 to <2.50 - - 0% 1% 0% 0% 0.75 to <1.75 - - 0% 1% 0% 0% 1.75 to <2.5 - - 0% 2% 0% 0% 2.50 to <10.00 - - 0% 5% 0% 0% 2.5 to <5 - - 0% 4% 0% 0% 5 to <10 - - 0% 7% 0% 0% 10.00 to <100.00 - - 0% 23% 0% 0% 10 to <20 - - 0% 14% 0% 0% 20 to <30 - - 0% 25% 0% 0% 30.00 to <100.00 - - 0% 49% 0% 0% 100.00 (Default) - - 0% 100% 0% 0% Units or shares in
collective investment
undertakings (CIU)0.00 to <0.15 - - 0% 0% 0% 0% 0.00 to <0.10 - - 0% 0% 0% 0% 0.10 to <0.15 - - 0% 0% 0% 0% 0.15 to <0.25 - - 0% 0% 0% 0% 0.25 to <0.50 - - 0% 0% 0% 0% 0.50 to <0.75 - - 0% 1% 0% 0% 0.75 to <2.50 - - 0% 1% 0% 0% 0.75 to <1.75 - - 0% 1% 0% 0% 1.75 to <2.5 - - 0% 0% 0% 0% 2.50 to <10.00 - - 0% 6% 0% 0% 2.5 to <5 - - 0% 4% 0% 0% 5 to <10 - - 0% 6% 0% 0% 10.00 to <100.00 - - 0% 31% 0% 0% 10 to <20 - - 0% 0% 0% 0% 20 to <30 - - 0% 0% 0% 0% 30.00 to <100.00 - - 0% 31% 0% 0% 100.00 (Default) - - 0% 100% 0% 0% F-IRB 12/31/2025 Number of obligors at the end of the
previous yearExposure class
in millions of eurosPD range of which: number
of obligors which
defaulted during
the yearObserved average
default rate (%)Exposure weighted
average PD (%)Average PD (%) Average historical
annual default
rate (%)a b c d e f g h Central governments and
central banks0.00 to <0.15 - - 0% 0% 0% 0% 0.00 to <0.10 - - 0% 0% 0% 0% 0.10 to <0.15 - - 0% 0% 0% 0% 0.15 to <0.25 4 - 0% 0% 0% 0% 0.25 to <0.50 3 - 0% 0% 0% 0% 0.50 to <0.75 - - 0% 0% 0% 0% 0.75 to <2.50 2 - 0% 0% 1% 0% 0.75 to <1.75 2 - 0% 0% 1% 0% 1.75 to <2.5 - - 0% 0% 0% 0% 2.50 to <10.00 - - 0% 0% 0% 0% 2.5 to <5 - - 0% 0% 0% 0% 5 to <10 - - 0% 0% 0% 0% 10.00 to <100.00 1 - 0% 0% 19% 0% 10 to <20 1 - 0% 0% 19% 0% 20 to <30 - - 0% 0% 0% 0% 30.00 to <100.00 - - 0% 0% 0% 0% 100.00 (Default) - - 0% 0% 0% 0% Regional government or
local authorities0.00 to <0.15 - - 0% 0% 0% 0% 0.00 to <0.10 - - 0% 0% 0% 0% 0.10 to <0.15 - - 0% 0% 0% 0% 0.15 to <0.25 - - 0% 0% 0% 0% 0.25 to <0.50 - - 0% 0% 0% 0% 0.50 to <0.75 - - 0% 0% 0% 0% 0.75 to <2.50 - - 0% 0% 0% 0% 0.75 to <1.75 - - 0% 0% 0% 0% 1.75 to <2.5 - - 0% 0% 0% 0% 2.50 to <10.00 - - 0% 0% 0% 0% 2.5 to <5 - - 0% 0% 0% 0% 5 to <10 - - 0% 0% 0% 0% 10.00 to <100.00 - - 0% 0% 0% 0% 10 to <20 - - 0% 0% 0% 0% 20 to <30 - - 0% 0% 0% 0% 30.00 to <100.00 - - 0% 0% 0% 0% 100.00 (Default) - - 0% 0% 0% 0% Public sector entities 0.00 to <0.15 - - 0% 0% 0% 0% 0.00 to <0.10 - - 0% 0% 0% 0% 0.10 to <0.15 - - 0% 0% 0% 0% 0.15 to <0.25 - - 0% 0% 0% 0% 0.25 to <0.50 - - 0% 0% 0% 0% 0.50 to <0.75 - - 0% 1% 0% 0% 0.75 to <2.50 - - 0% 1% 0% 0% 0.75 to <1.75 - - 0% 1% 0% 0% 1.75 to <2.5 - - 0% 0% 0% 0% 2.50 to <10.00 - - 0% 7% 0% 0% 2.5 to <5 - - 0% 0% 0% 0% 5 to <10 - - 0% 7% 0% 0% 10.00 to <100.00 - - 0% 12% 0% 0% 10 to <20 - - 0% 12% 0% 0% 20 to <30 - - 0% 0% 0% 0% 30.00 to <100.00 - - 0% 0% 0% 0% 100.00 (Default) - - 0% 0% 0% 0% Institutions 0.00 to <0.15 124 - 0% 0% 0% 0% 0.00 to <0.10 124 - 0% 0% 0% 0% 0.10 to <0.15 - - 0% 0% 0% 0% 0.15 to <0.25 - - 0% 0% 0% 0% 0.25 to <0.50 53 - 0% 0% 0% 0% 0.50 to <0.75 30 - 0% 1% 1% 0% 0.75 to <2.50 - - 0% 2% 0% 0% 0.75 to <1.75 - - 0% 1% 0% 0% 1.75 to <2.5 - - 0% 2% 0% 0% 2.50 to <10.00 20 - 0% 4% 4% 1% 2.5 to <5 17 - 0% 4% 4% 1% 5 to <10 3 - 0% 6% 6% 2% 10.00 to <100.00 3 - 0% 11% 10% 0% 10 to <20 3 - 0% 11% 10% 0% 20 to <30 - - 0% 0% 0% 0% 30.00 to <100.00 - - 0% 0% 0% 0% 100.00 (Default) 1 - 0% 100% 100% 100% Corporates – Specialized
lending0.00 to <0.15 1 - 0% 0% 0% 0% 0.00 to <0.10 1 - 0% 0% 0% 0% 0.10 to <0.15 - - 0% 0% 0% 0% 0.15 to <0.25 - - 0% 0% 0% 0% 0.25 to <0.50 9 - 0% 0% 0% 0% 0.50 to <0.75 - - 0% 0% 0% 0% 0.75 to <2.50 2 - 0% 0% 1% 0% 0.75 to <1.75 2 - 0% 0% 1% 0% 1.75 to <2.5 - - 0% 0% 0% 0% 2.50 to <10.00 - - 0% 0% 0% 0% 2.5 to <5 - - 0% 0% 0% 0% 5 to <10 - - 0% 0% 0% 0% 10.00 to <100.00 - - 0% 0% 0% 0% 10 to <20 - - 0% 0% 0% 0% 20 to <30 - - 0% 0% 0% 0% 30.00 to <100.00 - - 0% 0% 0% 0% 100.00 (Default) - - 0% 0% 0% 0% CORPORATES – OTHER 0.00 to <0.15 765 2 0% 0% 0% 0% 0.00 to <0.10 753 2 0% 0% 0% 0% 0.10 to <0.15 12 - 0% 0% 0% 1% 0.15 to <0.25 800 1 0% 0% 0% 0% 0.25 to <0.50 1,485 3 0% 0% 0% 0% 0.50 to <0.75 2,094 6 0% 1% 1% 0% 0.75 to <2.50 5,752 26 0% 1% 1% 0% 0.75 to <1.75 5,257 19 0% 1% 1% 0% 1.75 to <2.5 495 7 1% 2% 2% 1% 2.50 to <10.00 6,198 56 1% 5% 4% 2% 2.5 to <5 4,023 27 1% 4% 3% 1% 5 to <10 2,175 29 1% 7% 7% 3% 10.00 to <100.00 1,489 60 4% 17% 23% 3% 10 to <20 807 22 3% 14% 14% 2% 20 to <30 171 4 2% 24% 22% 8% 30.00 to <100.00 511 34 7% 33% 37% 6% 100.00 (Default) 3,542 - 0% 100% 100% 100% 0.00 to <0.15 765 2 0% 0% 0% 0% 0.00 to <0.10 - - 0% 0% 0% 0% 0.10 to <0.15 - - 0% 0% 0% 0% 0.15 to <0.25 - - 0% 0% 0% 0% 0.25 to <0.50 - - 0% 0% 0% 0% 0.50 to <0.75 - - 0% 0% 0% 0% 0.75 to <2.50 - - 0% 0% 0% 0% 0.75 to <1.75 - - 0% 0% 0% 0% 1.75 to <2.5 - - 0% 0% 0% 0% 2.50 to <10.00 - - 0% 0% 0% 0% 2.5 to <5 - - 0% 0% 0% 0% 5 to <10 - - 0% 0% 0% 0% 10.00 to <100.00 - - 0% 0% 0% 0% 10 to <20 - - 0% 0% 0% 0% 20 to <30 - - 0% 0% 0% 0% 30.00 to <100.00 - - 0% 0% 0% 0% 100.00 (Default) - - 0% 100% 0% 0% A-IRB 12/31/2024 Number of obligors at the end of the
previous yearExposure class
in millions of euros
PD range of which: number
of obligors which
defaulted during
the yearObserved average
default rate (%)Exposure weighted
average PD (%)Average PD (%) Average historical
annual default
rate (%)a b c d e f g h CENTRAL GOVERNMENTS AND CENTRAL BANKS 0.00 to <0.15 69 - 0% 0% 0% 0% 0.00 to <0.10 69 - 0% 0% 0% 0% 0.10 to <0.15 - - 0% 0% 0% 0% 0.15 to <0.25 5 - 0% 0% 0% 0% 0.25 to <0.50 8 - 0% 0% 0% 0% 0.50 to <0.75 - - 0% 0% 0% 0% 0.75 to <2.50 - - 0% 0% 0% 0% 0.75 to <1.75 - - 0% 0% 0% 0% 1.75 to <2.5 - - 0% 0% 0% 0% 2.50 to <10.00 6 - 0% 0% 3% 0% 2.5 to <5 6 - 0% 0% 3% 0% 5 to <10 - - 0% 0% 0% 0% 10.00 to <100.00 7 - 0% 0% 25% 3% 10 to <20 - - 0% 0% 0% 0% 20 to <30 7 - 0% 0% 25% 3% 30.00 to <100.00 - - 0% 0% 0% 0% 100.00 (Default) 8 - 0% 0% 100% 100% INSTITUTIONS 0.00 to <0.15 232 - 0% 0% 0% 0% 0.00 to <0.10 232 - 0% 0% 0% 0% 0.10 to <0.15 - - 0% 0% 0% 0% 0.15 to <0.25 - - 0% 0% 0% 0% 0.25 to <0.50 94 - 0% 0% 0% 0% 0.50 to <0.75 47 - 0% 1% 1% 1% 0.75 to <2.50 - - 0% 0% 0% 0% 0.75 to <1.75 - - 0% 0% 0% 0% 1.75 to <2.5 - - 0% 0% 0% 0% 2.50 to <10.00 80 - 0% 1% 5% 0% 2.5 to <5 43 - 0% 1% 4% 0% 5 to <10 37 - 0% 4% 6% 0% 10.00 to <100.00 5 - 0% 0% 11% 0% 10 to <20 5 - 0% 1% 11% 0% 20 to <30 - - 0% 0% 0% 0% 30.00 to <100.00 - - 0% 0% 0% 0% 100.00 (Default) 5 - 0% 52% 100% 100% CORPORATES – SME 0.00 to <0.15 291 - 0% 0% 0% 1% 0.00 to <0.10 78 - 0% 0% 0% 1% 0.10 to <0.15 213 - 0% 0% 0% 0% 0.15 to <0.25 65 1 2% 0% 0% 0% 0.25 to <0.50 197 1 1% 0% 0% 1% 0.50 to <0.75 2,324 7 0% 1% 1% 0% 0.75 to <2.50 3,426 36 1% 2% 1% 1% 0.75 to <1.75 3,401 36 1% 1% 1% 1% 1.75 to <2.5 25 - 0% 2% 2% 1% 2.50 to <10.00 5,242 188 4% 5% 4% 3% 2.5 to <5 4,608 147 3% 4% 4% 2% 5 to <10 634 41 7% 7% 7% 6% 10.00 to <100.00 1,206 103 9% 21% 25% 7% 10 to <20 468 68 15% 13% 15% 6% 20 to <30 2 - 0% 21% 25% 16% 30.00 to <100.00 736 35 5% 30% 31% 8% 100.00 (Default) 731 - 0% 99% 100% 100% CORPORATES – SPECIALISED LENDING 0.00 to <0.15 95 - 0% 0% 0% 0% 0.00 to <0.10 95 - 0% 0% 0% 0% 0.10 to <0.15 - - 0% 0% 0% 0% 0.15 to <0.25 98 - 0% 0% 0% 0% 0.25 to <0.50 481 - 0% 0% 0% 0% 0.50 to <0.75 - - 0% 0% 0% 0% 0.75 to <2.50 298 - 0% 1% 1% 1% 0.75 to <1.75 298 - 0% 1% 1% 1% 1.75 to <2.5 - - 0% 0% 0% 0% 2.50 to <10.00 96 3 3% 5% 6% 5% 2.5 to <5 31 2 7% 5% 5% 5% 5 to <10 65 1 2% 6% 6% 5% 10.00 to <100.00 50 10 20% 24% 22% 16% 10 to <20 27 5 19% 14% 14% 13% 20 to <30 3 1 33% 22% 22% 33% 30.00 to <100.00 20 4 20% 33% 33% 20% 100.00 (Default) 43 - 0% 100% 100% 100% CORPORATES – OTHER 0.00 to <0.15 778 - 0% 0% 0% 0% 0.00 to <0.10 737 - 0% 0% 0% 0% 0.10 to <0.15 41 - 0% 0% 0% 0% 0.15 to <0.25 48 - 0% 0% 0% 0% 0.25 to <0.50 551 1 0% 0% 0% 0% 0.50 to <0.75 527 3 1% 1% 1% 1% 0.75 to <2.50 1,263 13 1% 1% 1% 1% 0.75 to <1.75 1,217 13 1% 1% 1% 1% 1.75 to <2.5 46 - 0% 2% 2% 2% 2.50 to <10.00 3,223 85 3% 4% 5% 2% 2.5 to <5 2,625 76 3% 4% 4% 2% 5 to <10 598 9 2% 6% 7% 5% 10.00 to <100.00 830 47 6% 15% 27% 5% 10 to <20 217 31 14% 12% 15% 4% 20 to <30 3 1 33% 6% 25% 18% 30.00 to <100.00 610 15 3% 21% 31% 5% 100.00 (Default) 426 - 0% 97% 100% 100% RETAIL – SME REAL ESTATE 0.00 to <0.15 52,640 56 0% 0% 0% 0% 0.00 to <0.10 - - 0% 0% 0% 0% 0.10 to <0.15 52,640 56 0% 0% 0% 0% 0.15 to <0.25 41,696 39 0% 0% 0% 0% 0.25 to <0.50 25,898 56 0% 0% 0% 0% 0.50 to <0.75 57,951 170 0% 1% 1% 0% 0.75 to <2.50 92,120 400 0% 1% 1% 0% 0.75 to <1.75 58,646 210 0% 1% 1% 0% 1.75 to <2.5 33,474 190 1% 2% 2% 1% 2.50 to <10.00 60,354 909 2% 5% 5% 1% 2.5 to <5 34,662 312 1% 3% 3% 1% 5 to <10 25,692 597 2% 7% 7% 2% 10.00 to <100.00 29,510 3,079 10% 21% 21% 9% 10 to <20 17,998 981 6% 14% 15% 4% 20 to <30 7,026 711 10% 24% 24% 7% 30.00 to <100.00 4,486 1,387 31% 44% 44% 26% 100.00 (Default) 11,231 - 0% 100% 100% 100% RETAIL – NON-SME REAL ESTATE 0.00 to <0.15 1,847,838 703 0% 0% 0% 0% 0.00 to <0.10 1,716,191 579 0% 0% 0% 0% 0.10 to <0.15 131,647 124 0% 0% 0% 0% 0.15 to <0.25 394,096 494 0% 0% 0% 0% 0.25 to <0.50 342,101 777 0% 0% 0% 0% 0.50 to <0.75 84,539 303 0% 1% 1% 0% 0.75 to <2.50 273,864 2,429 1% 1% 1% 1% 0.75 to <1.75 206,296 1,456 1% 1% 1% 1% 1.75 to <2.5 67,568 973 1% 2% 2% 1% 2.50 to <10.00 113,056 3,896 3% 5% 5% 2% 2.5 to <5 69,275 1,599 2% 3% 3% 1% 5 to <10 43,781 2,297 5% 7% 7% 3% 10.00 to <100.00 29,723 5,499 19% 23% 23% 10% 10 to <20 20,077 2,197 11% 14% 14% 6% 20 to <30 4,224 1,052 25% 26% 26% 8% 30.00 to <100.00 5,422 2,250 42% 53% 53% 34% 100.00 (Default) 29,862 - 0% 100% 100% 100% RETAIL – ELIGIBLE REVOLVING EXPOSURES 0.00 to <0.15 11,812,323 2,025 0% 0% 0% 0% 0.00 to <0.10 11,414,573 1,798 0% 0% 0% 0% 0.10 to <0.15 397,750 227 0% 0% 0% 0% 0.15 to <0.25 2,594,979 1,812 0% 0% 0% 0% 0.25 to <0.50 2,965,294 3,257 0% 0% 0% 0% 0.50 to <0.75 926,739 2,342 0% 0% 1% 0% 0.75 to <2.50 2,584,533 14,285 1% 1% 2% 0% 0.75 to <1.75 1,718,857 7,924 1% 1% 1% 0% 1.75 to <2.5 865,676 6,361 1% 2% 2% 1% 2.50 to <10.00 1,719,278 39,508 2% 4% 5% 1% 2.5 to <5 842,986 13,638 2% 3% 4% 1% 5 to <10 876,292 25,870 3% 4% 7% 2% 10.00 to <100.00 355,425 41,797 12% 17% 21% 5% 10 to <20 251,958 16,867 7% 11% 14% 4% 20 to <30 44,322 7,480 17% 21% 25% 4% 30.00 to <100.00 59,145 17,450 30% 30% 51% 26% 100.00 (Default) 135,618 - 0% 58% 100% 100% RETAIL – OTHER SMES 0.00 to <0.15 127,779 136 0% 0% 0% 0% 0.00 to <0.10 - - 0% 0% 0% 0% 0.10 to <0.15 127,779 136 0% 0% 0% 0% 0.15 to <0.25 181,951 259 0% 0% 0% 0% 0.25 to <0.50 245,575 641 0% 0% 0% 0% 0.50 to <0.75 217,513 981 1% 1% 1% 0% 0.75 to <2.50 553,168 4,722 1% 1% 1% 1% 0.75 to <1.75 363,652 2,597 1% 1% 1% 1% 1.75 to <2.5 189,516 2,125 1% 2% 2% 1% 2.50 to <10.00 471,577 11,245 2% 5% 5% 2% 2.5 to <5 287,889 4,105 1% 3% 3% 1% 5 to <10 183,688 7,140 4% 7% 7% 4% 10.00 to <100.00 195,179 27,274 14% 21% 22% 12% 10 to <20 110,426 9,497 9% 15% 15% 7% 20 to <30 55,344 7,568 14% 23% 25% 10% 30.00 to <100.00 29,409 10,209 35% 44% 45% 30% 100.00 (Default) 103,585 - 0% 100% 100% 100% RETAIL – OTHER NON-SMES 0.00 to <0.15 2,815,256 889 0% 0% 0% 0% 0.00 to <0.10 2,695,880 792 0% 0% 0% 0% 0.10 to <0.15 119,376 97 0% 0% 0% 0% 0.15 to <0.25 813,051 1,002 0% 0% 0% 0% 0.25 to <0.50 666,124 1,524 0% 0% 0% 0% 0.50 to <0.75 332,913 1,209 0% 1% 1% 0% 0.75 to <2.50 838,743 7,505 1% 1% 1% 1% 0.75 to <1.75 617,753 4,607 1% 1% 1% 1% 1.75 to <2.5 220,990 2,898 1% 2% 2% 1% 2.50 to <10.00 560,630 20,111 4% 5% 5% 2% 2.5 to <5 302,736 7,341 2% 3% 4% 2% 5 to <10 257,894 12,770 5% 7% 8% 4% 10.00 to <100.00 142,130 25,580 18% 22% 21% 11% 10 to <20 99,058 9,814 10% 14% 14% 6% 20 to <30 21,042 4,871 23% 26% 26% 13% 30.00 to <100.00 22,030 10,895 50% 46% 51% 43% 100.00 (Default) 140,922 - 0% 96% 100% 100% F-IRB 12/31/2024 Number of obligors at the end of the
previous yearExposure classes
in millions of euros
PD range of which: number
of obligors which
defaulted during
the yearObserved average
default rate (%)Exposure weighted
average PD (%)Average PD (%) Average historical
annual default
rate (%)a b c d e f g h CENTRAL GOVERNMENTS AND CENTRAL BANKS 0.00 to <0.15 47 - 0% 0% 0% 0% 0.00 to <0.10 44 - 0% 0% 0% 0% 0.10 to <0.15 3 - 0% 0% 0% 0% 0.15 to <0.25 2 - 0% 0% 0% 0% 0.25 to <0.50 2 - 0% 0% 0% 0% 0.50 to <0.75 - - 0% 0% 0% 0% 0.75 to <2.50 2 - 0% 1% 1% 0% 0.75 to <1.75 2 - 0% 1% 1% 0% 1.75 to <2.5 - - 0% 0% 0% 0% 2.50 to <10.00 9 - 0% 0% 4% 0% 2.5 to <5 7 - 0% 0% 3% 0% 5 to <10 2 - 0% 0% 6% 0% 10.00 to <100.00 1 - 0% 19% 19% 0% 10 to <20 1 - 0% 19% 19% 0% 20 to <30 - - 0% 0% 0% 0% 30.00 to <100.00 - - 0% 0% 0% 0% 100.00 (Default) 1 - 0% 0% 100% 100% INSTITUTIONS 0.00 to <0.15 97 - 0% 0% 0% 0% 0.00 to <0.10 97 - 0% 0% 0% 0% 0.10 to <0.15 - - 0% 0% 0% 0% 0.15 to <0.25 - - 0% 0% 0% 0% 0.25 to <0.50 45 - 0% 0% 0% 1% 0.50 to <0.75 22 - 0% 0% 1% 0% 0.75 to <2.50 - - 0% 0% 0% 0% 0.75 to <1.75 - - 0% 0% 0% 0% 1.75 to <2.5 - - 0% 0% 0% 0% 2.50 to <10.00 65 - 0% 0% 5% 1% 2.5 to <5 24 - 0% 1% 4% 1% 5 to <10 41 - 0% 0% 6% 2% 10.00 to <100.00 5 - 0% 1% 10% 0% 10 to <20 5 - 0% 1% 10% 0% 20 to <30 - - 0% 0% 0% 0% 30.00 to <100.00 - - 0% 0% 0% 0% 100.00 (Default) 4 - 0% 0% 100% 100% CORPORATES – SME 0.00 to <0.15 117 - 0% 0% 0% 1% 0.00 to <0.10 73 - 0% 0% 0% 1% 0.10 to <0.15 44 - 0% 0% 0% 0% 0.15 to <0.25 2,454 1 0% 0% 0% 0% 0.25 to <0.50 1,009 - 0% 0% 0% 0% 0.50 to <0.75 21,219 60 0% 1% 1% 0% 0.75 to <2.50 31,321 319 1% 1% 1% 1% 0.75 to <1.75 31,193 318 1% 1% 1% 1% 1.75 to <2.5 128 1 1% 2% 2% 1% 2.50 to <10.00 30,764 1,106 4% 4% 4% 3% 2.5 to <5 19,932 487 2% 3% 3% 2% 5 to <10 10,832 619 6% 7% 7% 4% 10.00 to <100.00 6,943 831 12% 20% 24% 9% 10 to <20 3,760 469 13% 14% 14% 7% 20 to <30 647 114 18% 24% 24% 14% 30.00 to <100.00 2,536 248 10% 41% 38% 13% 100.00 (Default) 4,208 - 0% 96% 100% 100% CORPORATES – SPECIALISED LENDING 0.00 to <0.15 - - 0% 0% 0% 0% 0.00 to <0.10 - - 0% 0% 0% 0% 0.10 to <0.15 - - 0% 0% 0% 0% 0.15 to <0.25 - - 0% 0% 0% 0% 0.25 to <0.50 - - 0% 0% 0% 0% 0.50 to <0.75 - - 0% 0% 0% 0% 0.75 to <2.50 - - 0% 0% 0% 0% 0.75 to <1.75 - - 0% 0% 0% 0% 1.75 to <2.5 - - 0% 0% 0% 0% 2.50 to <10.00 - - 0% 0% 0% 0% 2.5 to <5 - - 0% 0% 0% 0% 5 to <10 - - 0% 0% 0% 0% 10.00 to <100.00 - - 0% 0% 0% 0% 10 to <20 - - 0% 0% 0% 0% 20 to <30 - - 0% 0% 0% 0% 30.00 to <100.00 - - 0% 0% 0% 0% 100.00 (Default) - - 0% 0% 0% 0% CORPORATES – OTHER 0.00 to <0.15 919 7 1% 0% 0% 1% 0.00 to <0.10 740 5 1% 0% 0% 0% 0.10 to <0.15 179 2 1% 0% 0% 1% 0.15 to <0.25 671 1 0% 0% 0% 0% 0.25 to <0.50 1,510 3 0% 0% 0% 0% 0.50 to <0.75 2,708 7 0% 1% 1% 0% 0.75 to <2.50 7,433 43 1% 1% 1% 1% 0.75 to <1.75 7,008 41 1% 1% 1% 1% 1.75 to <2.5 425 2 1% 2% 2% 1% 2.50 to <10.00 7,522 129 2% 4% 4% 2% 2.5 to <5 5,414 59 1% 3% 3% 1% 5 to <10 2,108 70 3% 6% 7% 3% 10.00 to <100.00 2,926 89 3% 18% 28% 4% 10 to <20 593 34 6% 14% 14% 2% 20 to <30 121 10 8% 19% 25% 11% 30.00 to <100.00 2,212 45 2% 33% 32% 7% 100.00 (Default) 4,093 - 0% 97% 100% 100% 12/31/2025 in millions of euros Performing exposures Average PD Average LGD France 598,926 1.5% 19.9% European Institutions Europe excluding France 33,838 2.2% 26.5% North & South America 20,446 1.5% 20.3% Asia and Oceania 6,361 0.8% 24.0% Africa & the Middle East 1,383 2.3% 29.1% Oceania IRBA 660,955 1.7% 24.0% France 84,487 1.6% European Institutions Europe excluding France 39,781 1.2% North & South America 29,131 0.8% Asia and Oceania 18,390 0.4% Africa & the Middle East 1,595 1.6% Oceania IRBF 173,384 1.1% Total 834,339 12/31/2024 in millions of euros Performing exposures Average PD Average LGD France 605,988 1.5% 17.5% European Institutions 0 Europe excluding France 53,539 1.1% 29.6% North & South America 46,649 1.3% 28.7% Asia 14,645 1.0% 40.4% Africa & the Middle East 6,460 0.9% 40.8% Oceania 3,205 0.5% 37.9% IRBA 730,485 1.0% 32.5% France 75,947 2.6% European Institutions 0 Europe excluding France 6,204 1.2% North & South America 1,774 0.1% Asia 139 0.6% Africa & the Middle East 317 1.4% Oceania 138 0.2% IRBF 84,519 1.0% Total 815,005 12/31/2025 Portfolio Actual default
rateEstimated
probability of
defaultEstimated LGD Actual LGD Actual EAD/
Estimated EADActual CCF/
Estimated CCFFinancial Entities 0.10% 0.40% N/A N/A N/A Very large corporates 0.72% 1.20% N/A N/A N/A Corporates – Specialized financing 1.37% 2.33% 24.60% 20.96% N/A Small and medium-sized companies 2.79% 3.62% 29.33% 24.32% N/A Retail Professional 4.83% 5.76% 23.34% 13.33% 79.38% 45.72% Retail Individual 1.41% 1.37% 14.29% 8.17% 83.23% 56.09% This table provides an overall summary of the system’s performance but differs from the Group’s annual backtesting exercises, which are carried out on a model-by-model basis and not globally by portfolio. The table nevertheless allows a comparison between the estimates and the actual results for each internal parameter over a long-term period and on a significant and representative part of each exposure class. The results are derived from the data warehouses used for modeling from the set of performing customers for the default rate and PD, and from the set of defaulting customers for the LGD and EAD concepts.
12/31/2025 CR10.1 Specialised lending: Project finance (Slotting approach) On-balance
sheet
exposureOff-balance
sheet
exposureRisk weight Exposure
valueRisk
weighted
exposure
amountExpected
loss amountRegulatory categories
in millions of euros
Remaining maturity a b c d e f Category 1 Less than 2.5 years - - 50% - - - Equal to or more than 2.5 years - - 70% - - - Category 2 Less than 2.5 years - - 70% - - - Equal to or more than 2.5 years - - 90% - - - Category 3 Less than 2.5 years - - 115% - - - Equal to or more than 2.5 years - - 115% - - - Category 4 Less than 2.5 years - - 250% - - - Equal to or more than 2.5 years - - 250% - - - Category 5 Less than 2.5 years - - - - - - Equal to or more than 2.5 years - - - - - - Total Less than 2.5 years - - - - - Equal to or more than 2.5 years - - - - - 12/31/2024 CR10.1 Specialised lending: Project finance (Slotting approach) Remaining maturity On-balance
sheet
exposureOff-balance
sheet
exposureRisk weight Exposure
valueRisk
weighted
exposure
amountExpected loss
amountRegulatory categories
in millions of euros
a b c d e f Category 1 Less than 2.5 years - - 50% - - - Equal to or more than 2.5 years 18 - 70% 18 12 0 Category 2 Less than 2.5 years - - 70% - - - Equal to or more than 2.5 years 18 1 90% 18 16 0 Category 3 Less than 2.5 years - - 115% - - - Equal to or more than 2.5 years - - 115% - - - Category 4 Less than 2.5 years - - 250% - - - Equal to or more than 2.5 years - - 250% - - - Category 5 Less than 2.5 years - - - - - Equal to or more than 2.5 years - - - - - Total Less than 2.5 years - - - - - Equal to or more than 2.5 years 35 1 36 29 0 12/31/2025 CR10.2 Specialised lending: Income-producing real estate and high volatility commercial real estate (Slotting approach) Remaining maturity On-balance
sheet
exposureOff-balance
sheet
exposureRisk weight Exposure
valueRisk
weighted
exposure
amountExpected
loss amountRegulatory categories
in millions of euros
a b c d e f Category 1 Less than 2.5 years 50% Equal to or more than 2.5 years 70% Category 2 Less than 2.5 years 70% Equal to or more than 2.5 years 90% Category 3 Less than 2.5 years 115% Equal to or more than 2.5 years 115% Category 4 Less than 2.5 years 250% Equal to or more than 2.5 years 250% Category 5 Less than 2.5 years Equal to or more than 2.5 years Total Less than 2.5 years Equal to or more than 2.5 years 12/31/2024 CR10.2 Specialised lending: Income-producing real estate and high volatility commercial real estate (Slotting approach) Remaining maturity On-balance
sheet
exposureOff-balance
sheet
exposureRisk weight Exposure
valueRisk
weighted
exposure
amountExpected loss
amountRegulatory categories
in millions of euros
a b c d e f Category 1 Less than 2.5 years 43 1 50% 44 22 - Equal to or more than 2.5 years 16 - 70% 16 11 0 Category 2 Less than 2.5 years - - 70% - - - Equal to or more than 2.5 years - - 90% - - - Category 3 Less than 2.5 years - - 115% - - - Equal to or more than 2.5 years - - 115% - - - Category 4 Less than 2.5 years - - 250% - - - Equal to or more than 2.5 years - - 250% - - - Category 5 Less than 2.5 years - - - - - Equal to or more than 2.5 years - - - - - Total Less than 2.5 years 43 1 44 22 - Equal to or more than 2.5 years 16 - 16 11 0 12/31/2025 CR10.5 Equity exposures under Articles 133 (3) to (6) and 495a(3) CRR On-balance
sheet exposureOff-balance
sheet
exposureRisk weight Exposure value Risk weighted
exposure
amountExpected loss
amountCategories
in millions of euros
a b c d e f Private equity exposures 1,516 155 190% 1,670 3,173 13 Exchange-traded equity exposures - - 290% - - - Other equity exposures 63 - 370% 63 234 2 Total 1,579 155 1,734 3,408 15 12/31/2024 CR10.5 Equity exposures under Articles 133 (3) to (6) and 495a(3) CRR On-balance
sheet exposureOff-balance
sheet exposureRisk weight Exposure value Risk weighted
exposure amountExpected loss
amountCategories
in millions of euros
a b c d e f Private equity exposures 3,444 169 190% 3,613 6,864 29 Exchange-traded equity exposures 1,604 - 290% 1,604 4,652 13 Other equity exposures 7,028 - 370% 7,028 26,004 169 Total 12,076 169 12,245 37,521 210 -
6.1 Counterparty risk management
In terms of capital requirements, Groupe BPCE and its subsidiaries measure counterparty risk for derivative instruments (swaps or structured products, for instance) using the internal model method for the Natixis scope, or the mark-to-market method for the other institutions. In order to perfect the economic measurement of the current and potential risk inherent in derivatives, a tracking mechanism based on a standardized economic measurement is currently being instituted throughout Groupe BPCE.
Natixis mainly uses an internal model to calculate its counterparty risk-related capital requirements. Using Monte Carlo simulations for the main risk factors, this model measures the positions on each counterparty and for the entire lifespan of the exposure, taking netting and collateralization criteria into account.
The model thus determines the Expected Positive Exposure (EPE) profile and the Potential Future Exposure (PFE) profile, the latter being the main indicator used by Natixis for assessing counterparty risk exposure. This indicator is calculated as the 97.7% percentile of the distribution of exposures for each counterparty.
Other metrics such as the PFE and stress tests are used to manage the counterparty risk of Group entities at counterparty level. Harmonization work between Natixis and the rest of the Group is underway.
Group ceilings and limits regulate counterparty risk. These are validated by the Group Credit and Counterparty Committee.
Use of clearing houses and forward financial instruments (daily margin calls under ISDA agreements, for example) govern relations with the main clients (mainly Natixis and BRED). Accordingly, the Group has implemented the EMIR requirements.
The principles of counterparty
risk management are based
on:- a risk measurement determined according to the type of instrument in question, the term of the transactions, and whether or not any netting and collateralization agreements are in place;
- counterparty risk limits and allocation procedures;
- a value adjustment in respect of counterparty risk: the Credit Value Adjustment (CVA) represents the market value of a counterparty’s default risk (see paragraph below);
- incorporation of wrong-way risk: wrong-way risk refers to the risk that a given counterparty exposure is heavily correlated with the counterparty’s probability of default.
From a regulatory standpoint,
counterparty risk is
represented by:- specific wrong-way risk, i.e. the risk generated when, due to the nature of the transactions entered into with a counterparty, there is a direct link between its credit quality and the amount of the exposure;
- general wrong-way risk, i.e. the risk generated when there is a correlation between the counterparty’s credit quality and general market factors.
The goal is to enable the bank to better understand the exposure to counterparty credit risk and thus improve the management of such exposure. Specific wrong-way risk is subject to a specific capital requirement, while general wrong-way risk is assessed using the WWR stress scenarios defined for each asset class.
In the event the Bank’s external credit rating is downgraded, it may be required to provide additional cash or collateral to investors under agreements that include rating triggers. In particular, in calculating the liquidity coverage ratio (LCR), the amounts of these additional cash outflows and additional collateral requirements are measured. These amounts comprise the payment the bank would have to make within 30 calendar days in the event its credit rating were downgraded by as much as three notches.
The valuation of financial instruments traded over the counter by Groupe BPCE with external counterparties in its capital markets businesses (mainly Natixis and BRED) and ALM activities includes credit valuation adjustments. The CVA is an adjustment to the valuation of the trading book aimed at factoring in counterparty credit risks. It thus reflects the expectation of loss in fair value terms on the existing exposure to a counterparty due to the potential positive value of the contract, the counterparty’s probability of default and the estimated collection rate.
-
6.2 Quantitative information
BPCE18 – Breakdown of gross counterparty risk exposures by asset class (excluding other assets) and method
12/31/2025 12/31/2024 Standard IRB Total Total in millions of euros Exposure EAD RWA Exposure EAD RWA Exposure Exposure EAD RWA Central banks and other sovereign exposures 1,474 1,474 130 - - - 1,474 3,014 3,014 40 Central administrations 12,111 12,111 536 9 9 4 12,120 9,898 9,898 342 Public sector and similar entities 1,325 1,325 88 49 49 7 1,373 1,246 1,246 62 Financial institutions 11,824 11,824 893 20,295 20,295 5,671 32,119 34,201 34,201 6,086 Corporate customers 920 920 686 20,242 19,296 6,730 21,163 24,841 24,841 6,404 Retail 12 12 12 3 3 1 15 37 37 27 Equities - - - - - - - - - - Securitization 1,174 - - Total 27,667 27,666 2,345 40,598 39,652 12,414 68,265 73,238 73,238 12,962 BPCE19 – Breakdown by exposure class of risk-weighted assets for the credit valuation adjustment (CVA)
in millions of euros 12/31/2025 12/31/2024 Central banks and other sovereign exposures - - Central administrations 2 0 Public sector and similar entities - - Financial institutions 2,744 1,532 Corporate customers 1,400 120 Retail - - Equities - - Securitization - - Other assets - - Total 4,145 1,652 BPCE20 – Securities exposed to counterparty risk on derivative transactions and repurchase agreements
12/31/2025 12/31/2024 in millions of euros Standard IRB Total Standard IRB Total Derivatives Central banks and other sovereign exposures 915 - 915 555 - 555 Central administrations 7,642 9 7,651 2,400 3,869 6,269 Public sector and similar entities 806 3 810 700 - 700 Financial institutions 8,008 9,875 17,883 10,656 9,001 19,658 Corporate customers 671 15,074 15,745 728 13,814 14,541 Retail 12 3 15 35 2 37 Securitization - - - - 1,174 TOTAL 18,055 24,964 43,019 15,075 26,685 41,760 Repurchase agreements Central banks and other sovereign exposures 559 - 559 2,460 - 2,460 Central administrations 4,470 - 4,470 3,527 102 3,629 Public sector and similar entities 518 46 564 546 - 546 Financial institutions 3,816 10,420 14,236 3,708 10,835 14,543 Corporate customers 249 5,169 5,418 535 9,765 10,300 Retail - - - - - - Securitization - - - - - - TOTAL 9,611 15,634 25,245 10,775 20,703 31,478 in millions of euros 12/31/2025 12/31/2024 TOTAL notional amount of outstanding derivatives 22,980,199 18,494,997 – o/w notional amount of derivatives traded with central counterparties 19,708,137 16,578,645 Notional amount of OTC derivatives 3,272,062 1,916,352 – o/w interest rate derivatives 1,334,172 826,634 – o/w equity derivatives 180,644 95,187 – o/w currency derivatives 1,594,145 902,666 – o/w credit derivatives 78,510 44,327 Notional amount of cleared derivatives 19,708,137 16,578,645 – o/w interest rate derivatives 19,317,050 16,276,324 – o/w equity derivatives 142,934 133,112 – o/w currency derivatives 50,868 35,997 – o/w credit derivatives 181,794 122,637 -
6.3 Detailed quantitative information
The detailed quantitative information on counterparty risk in the following tables enhances the information in the previous section, in respect of Pillar III.
12/31/2025 a b c d e f g h in millions of euros Replacement
cost (RC)Potential
future
exposure
(PFE)EEPE Alpha used for
computing the
regulatory
exposure valueExposure
value pre-
CRMExposure
value post-
CRMExposure
valueRWEA EU-1 EU - Original Exposure Method (for derivatives) - - 1.4 - - - - EU-2 EU - Simplified SA-CCR (for derivatives) - - 1.4 - - - - 1 SA-CCR (for derivatives) 1,143 3,435 1.4 27,335 7,406 7,406 2,496 2 IMM (for derivatives and SFTs) 23,198 1.6 39,382 36,421 36,421 6,276 2a Of which securities financing transactions netting sets 5,000 8,291 8,291 8,291 1,126 2b Of which derivatives and long settlement transactions netting sets 18,198 31,091 28,130 28,130 5,150 2c Of which from contractual cross-product netting sets - - - - - 3 Financial collateral simple method (for SFTs) - - - - 4 Financial collateral comprehensive method (for SFTs) 13,212 13,212 13,212 1,842 5 VaR for SFTs - - - - 6 Total 79,928 57,038 57,038 10,614 12/31/2024 a b c d e f g h in millions of euros Replacement
cost (RC)Potential
future
exposure
(PFE)EEPE Alpha used for
computing the
regulatory
exposure valueExposure
value pre-
CRMExposure
value post-
CRMExposure
valueRWEA EU-1 EU - Original Exposure Method (for derivatives) - - 1.4 - - - - EU-2 EU - Simplified SA-CCR (for derivatives) - - 1.4 - - - - 1 SA-CCR (for derivatives) 1,610 2,970 1.4 13,080 6,477 6,477 2,554 2 IMM (for derivatives and SFTs) 22,254 1.5 40,884 34,272 34,272 5,967 2a Of which securities financing transactions netting sets 6,296 9,759 9,759 9,759 847 2b Of which derivatives and long settlement transactions netting sets 15,958 31,125 24,513 24,513 5,120 2c Of which from contractual cross-product netting sets - - - - - 3 Financial collateral simple method (for SFTs) - - - - 4 Financial collateral comprehensive method (for SFTs) 18,246 18,246 18,246 2,115 5 VaR for SFTs - - - - 6 Total 72,211 58,995 58,995 10,636 12/31/2025 Risk weight a b c d e f g h i j k l Exposure classes
in millions of euros0% 2% 4% 10% 20% 50% 70% 75% 100% 150% Others Total
exposure
value1 Central governments or central banks 7,377 - - - 2,480 320 - - 25 - - 10,203 2 Regional government or local authorities 240 - - - 4 - - - - - - 244 3 Public sector entities 1,024 - - - 52 85 - - 9 - - 1,170 4 Multilateral development banks 3,063 - - - - 0 - - - - - 3,063 5 International organisations 449 - - - - - - - - - - 449 6 Institutions 232 8,768 2,113 - 217 41 - - 37 4 257 11,669 7 Corporates 8 72 - - 8 172 - 18 450 58 - 786 8 Retail - - - - - - - 2 10 - - 12 9 Institutions and corporates with a short-term credit assessment - - - - 29 19 - - 6 0 - 54 10 Other items - - - - - - - - - 16 - 16 11 Total exposure value 12,394 8,841 2,113 - 2,790 637 - 19 537 78 257 27,666 12/31/2024 Risk weight a b c d e f g h i j k l Exposure classes
in millions of euros0% 2% 4% 10% 20% 50% 70% 75% 100% 150% Others Total
exposure
value1 Central governments or central banks 7,522 - - - 1,279 189 - - 31 - - 9,022 2 Regional government or local authorities 306 - - - 6 - - - - - - 311 3 Public sector entities 439 - - - 122 16 - - 18 - - 596 4 Multilateral development banks - - - - - 0 - - 6 - - 6 5 International organisations - - - - - - - - - - - - 6 Institutions 645 11,140 2,242 - 262 294 - - 1 - - 14,584 7 Corporates 263 35 - - 12 102 - - 616 41 - 1,069 8 Retail - - - - - - - 35 - - - 35 9 Institutions and corporates with a short-term credit assessment - - - - 180 21 - - 10 - - 212 10 Other items - - - - - - - - - 14 - 14 11 Total exposure value 9,176 11,175 2,242 - 1,862 622 - 35 682 56 - 25,849 12/31/2025 a b c d e f g A-IRB
in millions of eurosPD scale Exposure
valueExposure
weighted
average PD
(%)Number of
obligorsExposure
weighted
average LGD
(%)Exposure
weighted
average
maturity
(years)RWEA Density of risk
weighted
exposure
amount1 Central governments and central banks 0.00 to <0.15 - 0.00% - 0.00% - - 0.00% 2 0.15 to <0.25 - 0.00% - 0.00% - - 0.00% 3 0.25 to <0.50 - 0.00% - 0.00% - - 0.00% 4 0.50 to <0.75 - 0.00% - 0.00% - - 0.00% 5 0.75 to <2.50 - 0.00% - 0.00% - - 0.00% 6 2.50 to <10.00 - 0.00% - 0.00% - - 0.00% 7 10.00 to <100.00 - 0.00% - 0.00% - - 0.00% 8 100.00 (Default) - 0.00% - 0.00% - - 0.00% Sub-total - 0.00% - 0.00% - - 0.00% 1 Regional or local authorities and public sector entities 0.00 to <0.15 - 0.00% - 0.00% - - 0.00% 2 0.15 to <0.25 - 0.00% - 0.00% - - 0.00% 3 0.25 to <0.50 - 0.00% - 0.00% - - 0.00% 4 0.50 to <0.75 - 0.00% - 0.00% - - 0.00% 5 0.75 to <2.50 - 0.00% - 0.00% - - 0.00% 6 2.50 to <10.00 - 0.00% - 0.00% - - 0.00% 7 10.00 to <100.00 - 0.00% - 0.00% - - 0.00% 8 100.00 (Default) - 0.00% - 0.00% - - 0.00% Sub-total - 0.00% - 0.00% - - 0.00% 1 Corporate customers 0.00 to <0.15 522 0.12% 295 38.90% 6 92 36.96% 2 0.15 to <0.25 10 0.15% 21 22.28% 3 3 28.83% 3 0.25 to <0.50 52 0.84% 125 39.17% 4 14 54.99% 4 0.50 to <0.75 230 1.09% 147 60.15% 4 137 112.16% 5 0.75 to <2.50 269 2.09% 303 52.72% 3 147 105.12% 6 2.50 to <10.00 241 8.93% 246 30.39% 3 117 136.15% 7 10.00 to <100.00 37 21.90% 264 19.94% 4 77 311.90% 8 100.00 (Default) 7 197.12% 35 129.13% 5 11 349.70% Sub-total 1,368 6.75% 1,436 43.21% 4 598 124.62% 1 Retail 0.00 to <0.15 - 0.00% - 0.00% - - 0.00% 2 0.15 to <0.25 1 0.18% 45 45.00% - 0 16.91% 3 0.25 to <0.50 0 0.34% 14 45.00% - 0 25.46% 4 0.50 to <0.75 0 0.55% 25 45.00% - 0 34.12% 5 0.75 to <2.50 1 1.41% 31 45.00% - 0 51.26% 6 2.50 to <10.00 1 4.18% 21 45.00% - 0 64.70% 7 10.00 to <100.00 0 17.44% 5 45.00% - 0 93.59% 8 100.00 (Default) 0 100.00% 4 45.00% - - 0.00% Sub-total 3 4.87% 145 45.00% - 1 42.76% Total 1,371 1,581 600 12/31/2024 a b c d e f g A-IRB
in millions of eurosPD scale Exposure
valueExposure
weighted
average PD
(%)Number of
obligorsExposure
weighted
average LGD
(%)Exposure
weighted
average
maturity
(years)RWEA Density of risk
weighted
exposure
amount1 Central governments and central banks 0.00 to <0.15 3,945 0.00% 11 13.89% 4 - 0.00% 2 0.15 to <0.25 - 0.00% - 0.00% - - 0.00% 3 0.25 to <0.50 - 0.00% - 0.00% - - 0.00% 4 0.50 to <0.75 - 0.00% - 0.00% - - 0.00% 5 0.75 to <2.50 - 0.00% - 0.00% - - 0.00% 6 2.50 to <10.00 - 0.00% - 0.00% - - 0.00% 7 10.00 to <100.00 - 0.00% - 0.00% - - 0.00% 8 100.00 (Default) - 0.00% - 0.00% - - 0.00% Sub-total 3,945 0.00% 11 13.89% 4 - 0.00% 1 Institutions 0.00 to <0.15 13,904 0.00% 0 32.36% 0 1,625 11.69% 2 0.15 to <0.25 - 0.00% - 0.00% - - 0.00% 3 0.25 to <0.50 2,159 0.00% 0 46.41% 0 1,222 56.61% 4 0.50 to <0.75 212 0.00% 0 54.75% 0 188 88.78% 5 0.75 to <2.50 - 0.00% - 0.00% - - 0.00% 6 2.50 to <10.00 81 0.00% 0 86.81% 0 213 262.49% 7 10.00 to <100.00 - 0.00% - 0.00% - - 0.00% 8 100.00 (Default) - 0.00% - 0.00% - - 0.00% Sub-total 16,356 0.00% 1 34.78% 0 3,248 19.86% 1 Corporate customers 0.00 to <0.15 15,710 0.04% 854 29.30% 1 1,372 8.73% 2 0.15 to <0.25 140 0.23% 122 18.62% 4 49 35.06% 3 0.25 to <0.50 3,487 0.29% 793 33.02% 1 1,250 35.83% 4 0.50 to <0.75 1,304 0.69% 269 36.43% 1 661 50.66% 5 0.75 to <2.50 1,005 1.14% 687 34.62% 2 752 74.80% 6 2.50 to <10.00 497 4.66% 716 34.73% 1 602 121.18% 7 10.00 to <100.00 121 20.20% 296 24.35% 1 248 203.95% 8 100.00 (Default) 13 90.65% 65 36.78% 1 16 121.56% Sub-total 22,278 0.43% 3,802 30.57% 1 4,949 22.22% 1 Retail 0.00 to <0.15 - 0.00% - 0.00% - - 0.00% 2 0.15 to <0.25 0 0.21% 14 45.00% - 0 19.97% 3 0.25 to <0.50 0 0.43% 18 45.00% - 0 31.52% 4 0.50 to <0.75 0 0.68% 7 45.00% - 0 40.34% 5 0.75 to <2.50 1 1.49% 35 45.00% - 0 55.82% 6 2.50 to <10.00 0 4.73% 28 45.00% - 0 69.48% 7 10.00 to <100.00 0 26.44% 9 45.00% - 0 113.67% 8 100.00 (Default) - 0.00% - 0.00% - - 0.00% Sub-total 2 2.84% 111 45.00% - 1 56.11% Total 42,581 3,925 8,199 12/31/2025 a b c d e f g F-IRB
in millions of eurosPD scale Exposure
valueExposure
weighted
average PD
(%)Number of
obligorsExposure
weighted
average LGD
(%)Exposure
weighted
average
maturity
(years)RWEA Density of risk
weighted
exposure
amount1 Central governments and central banks 0.00 to <0.15 11 0.03% 1 45.00% 3 2 19.66% 2 0.15 to <0.25 - 0.00% - 0.00% 0 - 0.00% 3 0.25 to <0.50 - 0.00% - 0.00% 0 - 0.00% 4 0.50 to <0.75 - 0.00% - 0.00% 0 - 0.00% 5 0.75 to <2.50 - 0.00% - 0.00% 0 - 0.00% 6 2.50 to <10.00 - 0.00% - 0.00% 0 - 0.00% 7 10.00 to <100.00 - 0.00% - 0.00% 0 - 0.00% 8 100.00 (Default) - 0.00% - 0.00% 0 - 0.00% Sub-total 11 0.03% 1 45.00% 3 2 19.66% 1 Regional or local authorities and public sector entities 0.00 to <0.15 - 0.00% - 0.00% 0 - 0.00% 2 0.15 to <0.25 - 0.00% - 0.00% 0 - 0.00% 3 0.25 to <0.50 - 0.00% - 0.00% 0 - 0.00% 4 0.50 to <0.75 - 0.00% - 0.00% 0 - 0.00% 5 0.75 to <2.50 0 1.07% 1 45.00% 3 0 94.70% 6 2.50 to <10.00 - 0.00% - 0.00% 0 - 0.00% 7 10.00 to <100.00 - 0.00% - 0.00% 0 - 0.00% 8 100.00 (Default) - 0.00% - 0.00% 0 - 0.00% Sub-total 0 1.07% 1 45.00% 3 0 94.70% 1 Institutions 0.00 to <0.15 17,672 0.04% 384 38.42% 1 2,264 12.81% 2 0.15 to <0.25 - 0.00% - 0.00% 0 - 0.00% 3 0.25 to <0.50 2,164 0.25% 203 44.22% 2 840 38.81% 4 0.50 to <0.75 296 0.70% 43 45.00% 2 207 69.92% 5 0.75 to <2.50 0 1.00% 1 45.00% 1 0 61.71% 6 2.50 to <10.00 9 4.98% 11 45.00% 2 14 153.21% 7 10.00 to <100.00 - 0.00% - 0.00% 0 - 0.00% 8 100.00 (Default) - 0.00% - 0.00% 0 - 0.00% Sub-total 20,141 0.08% 642 39.14% 1 3,326 16.51% 1 Corporate customers 0.00 to <0.15 13,070 0.05% 821 34.35% 2 1,595 12.20% 2 0.15 to <0.25 10 0.19% 90 39.90% 3 3 33.23% 3 0.25 to <0.50 3,135 0.30% 574 39.19% 2 1,236 39.44% 4 0.50 to <0.75 1,314 0.65% 400 40.60% 2 644 49.01% 5 0.75 to <2.50 757 1.08% 710 40.25% 3 578 76.40% 6 2.50 to <10.00 670 5.48% 878 40.47% 2 845 126.15% 7 10.00 to <100.00 89 21.36% 199 35.20% 3 181 204.05% 8 100.00 (Default) 26 98.40% 63 39.36% 3 - 0.00% Sub-total 19,070 0.60% 3,735 36.04% 2 5,083 26.65% Total 39,223 4,379 8,411 12/31/2024 a b c d e f g F-IRB
in millions of eurosPD scale Exposure
valueExposure
weighted
average PD
(%)Number of
obligorsExposure
weighted
average LGD
(%)Exposure
weighted
average
maturity
(years)RWEA Density of
risk weighted
exposure
amount1 Central governments and central banks 0.00 to <0.15 24 0.00% 0 45.00% 3 - 0.00% 2 0.15 to <0.25 - 0.00% - 0.00% 0 - 0.00% 3 0.25 to <0.50 - 0.00% - 0.00% 0 - 0.00% 4 0.50 to <0.75 - 0.00% - 0.00% 0 - 0.00% 5 0.75 to <2.50 - 0.00% - 0.00% 0 - 0.00% 6 2.50 to <10.00 - 0.00% - 0.00% 0 - 0.00% 7 10.00 to <100.00 - 0.00% - 0.00% 0 - 0.00% 8 100.00 (Default) - 0.00% - 0.00% 0 - 0.00% Sub-total 24 0.00% 0 45.00% 3 - 0.00% 1 Institutions 0.00 to <0.15 2,878 0.04% 0 45.00% 0 426 14.81% 2 0.15 to <0.25 - 0.00% - 0.00% 0 - 0.00% 3 0.25 to <0.50 787 0.25% 0 45.00% 0 334 42.44% 4 0.50 to <0.75 69 0.70% 0 45.00% 0 53 76.78% 5 0.75 to <2.50 - 0.00% - 0.00% 0 - 0.00% 6 2.50 to <10.00 - 0.00% - 0.00% 0 - 0.00% 7 10.00 to <100.00 - 0.00% - 0.00% 0 - 0.00% 8 100.00 (Default) - 0.00% - 0.00% 0 - 0.00% Sub-total 3,734 0.10% 0 45.00% 0 813 21.78% 1 Corporate customers 0.00 to <0.15 831 0.03% 0 17.85% 0 133 15.98% 2 0.15 to <0.25 1 0.21% 0 45.00% 0 1 43.86% 3 0.25 to <0.50 84 0.29% 0 45.00% 0 44 52.31% 4 0.50 to <0.75 33 0.68% 0 45.00% 0 21 62.55% 5 0.75 to <2.50 52 1.38% 0 45.00% 0 53 100.84% 6 2.50 to <10.00 44 5.62% 0 43.96% 0 68 154.70% 7 10.00 to <100.00 4 20.27% 0 45.00% 0 8 228.68% 8 100.00 (Default) 0 100.00% 0 45.00% 0 - 0.00% Sub-total 1,049 0.48% 1 23.45% 0 327 31.14% Total 4,808 1 1,140 12/31/2025 a b c d e f g h Collateral used in derivative transactions Collateral used in SFTs Collateral type
in millions of eurosFair value of collateral received Fair value of posted collateral Fair value of collateral received Fair value of posted collateral Segregated Unsegregated Segregated Unsegregated Segregated Unsegregated Segregated Unsegregated 1 Cash – domestic currency - 6,797 313 9,445 - 8,830 - 21,848 2 Cash – other currencies - 4,188 373 4,085 - 5,411 - 4,132 3 Domestic sovereign debt - - - - - 5,976 - 6,764 4 Other sovereign debt 3,331 796 - 222 - 226,145 - 288,128 5 Government agency debt 1,204 784 - 273 - 76,715 - 48,723 6 Corporate bonds 1,143 1,353 - - - 63,559 - 49,493 7 Equity securities 1,405 14 - 351 - 35,013 - 63,809 8 Other collateral 531 25 - - - 1,559 - 285 9 Total 7,614 13,957 686 14,376 - 423,209 - 483,183 12/31/2024 a b c d e f g h Collateral used in derivative transactions Collateral used in SFTs Collateral type
in millions of eurosFair value of collateral received Fair value of posted collateral Fair value of collateral received Fair value of posted collateral Segregated Unsegregated Segregated Unsegregated Segregated Unsegregated Segregated Unsegregated 1 Cash – domestic currency - 7,494 277 10,302 - 3,742 - 14,350 2 Cash – other currencies - 5,107 220 3,933 - 4,978 - 4,431 3 Domestic sovereign debt 0 - - - - 3,021 - 6,378 4 Other sovereign debt 2,638 523 - 188 - 93,318 - 142,862 5 Government agency debt 1,232 688 - 253 - 39,152 - 29,538 6 Corporate bonds 1,141 144 - 324 - 36,226 - 26,475 7 Equity securities 1,635 7 - - - 175,492 - 37,167 8 Other collateral 201 25 - - - 1,013 - 286 9 Total 6,848 13,988 496 15,000 - 356,941 - 261,485 12/31/2025 a b in millions of euros Protection bought Protection sold Notionals 1 Single-name credit default swaps 56,372 58,340 2 Index credit default swaps 69,486 67,404 3 Total return swaps 7,075 684 4 Credit options - - 5 Other credit derivatives - - 6 Total notionals 132,933 126,429 Fair values 7 Positive fair value (asset) 775 3,743 8 Negative fair value (liability) (3,814) (346) 12/31/2024 a b in millions of euros Protection bought Protection sold Notionals 1 Single-name credit default swaps 34,061 39,426 2 Index credit default swaps 47,699 41,676 3 Total return swaps 3,224 123 4 Credit options - - 5 Other credit derivatives - - 6 Total notionals 84,984 81,225 Fair values 7 Positive fair value (asset) 436 1,954 8 Negative fair value (liability) (1,951) (233) 12/31/2025 a b in millions of euros Exposure value RWEA 1 Exposures to QCCPs (total) 1,036 2 Exposures for trades at QCCPs (excluding initial margin and default fund contributions); of which 9,053 220 3 (i) OTC derivatives 5,325 146 4 (ii) Exchange-traded derivatives - - 5 (iii) SFTs 3,728 75 6 (iv) Netting sets where cross-product netting has been approved - - 7 Segregated initial margin 180 8 Non-segregated initial margin 9,439 506 9 Prefunded default fund contributions 770 310 10 Unfunded default fund contributions - - 11 Exposures to non-QCCPs (total) - 12 Exposures for trades at non-QCCPs (excluding initial margin and default fund contributions); of which - - 13 I. (i) OTC derivatives - - 14 II. (ii) Exchange-traded derivatives - - 15 III. (iii) SFTs - - 16 IV. (iv) Netting sets where cross-product netting has been approved - - 17 Segregated initial margin - 18 Non-segregated initial margin - - 19 Prefunded default fund contributions - - 20 Unfunded default fund contributions - - 12/31/2024 a b Exposure in millions of euros value RWEA 1 Exposures to QCCPs (total) 1,100 2 Exposures for trades at QCCPs (excluding initial margin and default fund contributions); of which 8,829 219 3 I. (i) OTC derivatives 5,356 150 4 II. (ii) Exchange-traded derivatives - - 5 III. (iii) SFTs 3,473 69 6 IV. (iv) Netting sets where cross-product netting has been approved - - 7 Segregated initial margin 177 8 Non-segregated initial margin 9,165 535 9 Prefunded default fund contributions 909 346 10 Unfunded default fund contributions - - 11 Exposures to non-QCCPs (total) - 12 Exposures for trades at non-QCCPs (excluding initial margin and default fund contributions); of which - - 13 I. (i) OTC derivatives - - 14 II. (ii) Exchange-traded derivatives - - 15 III. (iii) SFTs - - 16 IV. (iv) Netting sets where cross-product netting has been approved - - 17 Segregated initial margin - 18 Non-segregated initial margin - - 19 Prefunded default fund contributions - - 20 Unfunded default fund contributions - - -
7.1 Regulatory framework and accounting methods
Two European regulations aimed at facilitating the development of the securitization market, preventing risks and ensuring the stability of the financial system, were published in the Official Journal of the European Union on December 28, 2017. The aim of these two regulations is to provide a framework for securitization transactions in the European Union, and to establish a new framework for calculating prudential requirements (hierarchy of approaches for calculating RWA, STS criterion, etc.): Regulation (EU) 2017/2402 and Regulation (EU) 2017/240. These two regulations entered into force on January 1, 2019.
Securitization transactions in which Groupe BPCE is an investor (i.e. the Group invests directly in some securitization positions, provides liquidity, and is a counterparty for derivatives exposures or guarantees) are recognized in accordance with the Group’s accounting principles, as referred to in the notes to the consolidated financial statements, and mainly under “Securities at amortized cost” and “Financial assets at fair value through other comprehensive income”
-
7.2 Securitization management at Groupe BPCE
The banking book EAD in the prudential sense (final securitization) amounted to €21.1 billion at December 31, 2025 (-€0.6 billion year-on-year). It should be noted that the banking book EAD under initial securitization (before taking into account guarantees) amounted to €22.1 billion at December 31, 2025.
The positions were mainly carried by Natixis (€16.7 billion, acting as investor, sponsor and originator), BRED (€3.2 billion, acting as investor) and BPCE SA (€1.2 billion, run-off positions arising from the transfer of a portfolio of home loan and public asset securitizations from Crédit Foncier in September 2014, acting as investor).
The trading book EAD amounted to €573 million at December 31, 2025, and were mainly carried by Natixis (€325 million) and BRED (€248 million).
• Natixis’ sustainable management activities (-€0.7 billion), particularly in origination (-€1.1 billion), sponsorship (-€0.1 billion via the Magenta and Versailles conduits) and investment (+€0.5 billion);
• the workout portfolio exposures of the Corporate & Investment Banking division (formerly GAPC) and BPCE are managed under a run-off method, whereby positions are gradually amortized but still managed (including disposals) in order to safeguard the Group’s interests by actively reducing positions under acceptable pricing conditions.
The RWAs of Groupe BPCE amount to €4.2 billion (€4.0 billion in the banking book and €0.2 billion in the trading book) and are mainly calculated according to the SEC-SA approach (€2.5 billion), SEC-ERBA (€1.5 billion), then by the SEC-IRBA (€0.2 billion), NPE (€88 million) and default (€5 million) approaches.
The transactions originated by BPCE SA and BRED, as part of their liquidity management activity, are described in the dedicated section (Liquidity risk management policy).
The various relevant portfolios are specially monitored by the entities and subsidiaries, and by the central institution. Depending on the scope involved, special management or steering committees regularly review the main positions and management strategies.
At the central institution, the Group Risk division regularly reviews the securitization exposures (quarterly mapping considered an essential report and governed in accordance with BCBS 239 principles), changes in portfolio structure, risk-weighted assets and potential losses.
At the same time, special purpose surveys are conducted by the teams on potential losses and changes in risk-weighted assets through internal stress scenarios (risk-weighted assets and loss on completion).
Lastly, the Group Risk division supervises the risks associated with sensitive securitization positions by identifying rating downgrades and monitoring the evolution of exposures (valuation, detailed analysis). Major exposures are systematically submitted to the Group Watchlist and Provisions Committee, which meets quarterly to determine the appropriate level of provisioning.
-
7.3 Quantitative information
12/31/2025 12/31/2024 Change in millions of euros EAD Risk-Weighted
AssetsEAD Risk-Weighted
AssetsEAD Risk-Weighted
AssetsBanking book 21,015 3,928 21,663 4,694 (647) (766) Investor 8,661 1,997 8,109 2,145 552 (147) Originator 976 242 2,109 869 (1,134) (627) Sponsor 11,379 1,689 11,445 1,681 (66) 8 Trading book 573 195 610 350 (36) (155) Investor 573 195 610 350 (36) (155) Sponsor 0 0 0 0 0 0 TOTAL 21,589 4,123 22,273 5,044 (684) (921) 12/31/2025 12/31/2024 as a % Standard & Poor’s
equivalent ratingBanking book Standard & Poor’s
equivalent ratingBanking book Investment grade AAA 40% AAA 35% AA+ 2% AA+ 13% AA 4% AA 3% AA- 0% AA- 2% A+ 1% A+ 1% A 0% A 0% A- 0% A- 0% BBB+ 0% BBB+ 0% BBB 1% BBB 3% BBB- 0% BBB- 0% Non-investment grade BB+ 2% BB+ 2% BB 0% BB 0% BB- 1% BB- 0% B+ 0% B+ 0% B 0% B 0% B- 0% B- 0% CCC+ 0% CCC+ 0% CCC 0% CCC 0% CCC- 0% CCC- 0% CC 0% CC 0% C 0% C 0% Not rated Not Rated 49% Not Rated 41% Default D 0% D 0% Total 100% 100% 12/31/2025 12/31/2024 as a % Standard & Poor’s
equivalent ratingTrading portfolio Standard & Poor’s
equivalent ratingTrading portfolio Investment grade AAA 85% AAA 70% AA+ 5% AA+ 4% AA 4% AA 11% AA- 0% AA- 1% A+ 1% A+ 0% A 3% A 4% A- 0% A- 0% BBB+ 0% BBB+ 0% BBB 0% BBB 1% BBB- 1% BBB- 2% Non-investment grade BB+ 0% BB+ 0% BB 0% BB 0% BB- 1% BB- 2% B+ 0% B+ 0% B 0% B 0% B- 0% B- 0% CCC+ 0% CCC+ 0% CCC 0% CCC 0% CCC- 0% CCC- 0% CC 0% CC 0% C 0% C 1% Not rated Not Rated 0% Not Rated 4% Default D 0% D 0% Total 100% 100% -
7.4 Detailed quantitative information
12/31/2025 a c e g h i j k l m n o Institution acts as originator Institution acts as sponsor Institution acts as investor Traditional Synthetic Sub-total Traditional Synthetic Sub-total Traditional Synthetic Sub-total in millions of euros STS Non-STS STS Non-STS STS Non-STS 1 Total exposures 790 186 976 1,570 9,809 - 11,379 2,658 6,091 - 8,749 2 Retail (total) - - - 602 2,054 - 2,656 2,645 3,123 - 5,768 3 residential mortgage - - - 194 1,400 - 1,594 2,616 644 - 3,260 4 credit card - - - - 408 - 408 - 2,032 - 2,032 5 other retail exposures - - - 408 245 - 653 29 447 - 477 6 re-securitisation - - - - - - - - - - - 7 Wholesale (total) 790 186 976 968 7,755 - 8,723 13 2,967 - 2,980 8 loans to corporates 556 186 742 - 6,874 - 6,874 - 1,634 - 1,634 9 commercial mortgage 234 - 234 - - - - - 610 - 610 10 lease and receivables - - - 968 455 - 1,423 6 537 - 543 11 other wholesale - - - - 427 - 427 7 187 - 194 12 re-securitisation - - - - - - - - - - - 12/31/2024 a c e g h i j k l m n o Institution acts as originator Institution acts as sponsor Institution acts as investor Traditional Synthetic Sub-total Traditional Synthetic Sub-total Traditional Synthetic Sub-total in millions of euros STS Non-STS STS Non-STS STS Non-STS 1 Total exposures 302 1,807 2,109 1,692 9,752 - 11,445 2,425 5,683 0 8,109 2 Retail (total) - - - 255 2,006 - 2,261 2,411 2,941 0 5,352 3 residential mortgage - - - - 1,217 - 1,217 2,313 174 0 2,487 4 credit card - - - 255 449 - 704 - 2,395 - 2,395 5 other retail exposures - - - - 340 - 340 99 371 - 469 6 re-securitisation - - - - - - - - - - - 7 Wholesale (total) 302 1,807 2,109 1,437 7,747 - 9,184 14 2,743 - 2,757 8 loans to corporates 39 1,807 1,846 - 6,797 - 6,797 - 1,281 - 1,281 9 commercial mortgage 264 - 264 - - - - - 309 - 309 10 lease and receivables - - - 1,437 562 - 1,999 - 825 - 825 11 other wholesale - - - - 388 - 388 14 314 - 328 12 re-securitisation - - - - - - - - 13 - 13 EU SEC3 - Securitisation exposures in the non-trading book and associated regulatory capital requirements -institution acting as originator or as sponsor
12/31/2025 a b c d e f g h i j k l m n o EU-p EU-q Exposure values (by RW bands/deductions)
Exposure values (by regulatory
approach)RWEA (by regulatory approach) Capital charge after cap in millions of euros ≤20%
RW>20%
to
≤50%
RW>50% to
≤100%
RW>100%
to
<1250
% RW1250%
RW /
deduct
ionsSEC-
IRBASEC-
ERBA
(includin
g IAA)SEC-SA 1250%
RW /
deduct
ionsSEC-
IRBASEC-
ERBA
(includin
g IAA)SEC-SA 1250%
RW /
deduct
ionsSEC-
IRBASEC-
ERBA
(includin
g IAA)SEC-SA 1250%
RW /
deduct
ions1 Total exposures 11,670 533 117 35 - 880 275 11,200 0 145 89 1,696 0 12 7 136 0 2 Traditional transactions 11,484 533 117 35 - 694 275 11,200 0 117 89 1,696 0 9 7 136 0 3 Securitisation 11,484 533 117 35 - 694 275 11,200 0 117 89 1,696 0 9 7 136 0 4 Retail 2,028 526 102 - - - - 2,656 - - - 472 - - - 38 - 5 Of which STS 602 - - - - - - 602 - - - 59 - - - 5 - 6 Wholesale 9,456 7 15 35 - 694 275 8,544 0 117 89 1,225 0 9 7 98 0 7 Of which STS 968 - - - - - - 968 - - - 95 - - - 8 - 8 Re-securitisation - - - - - - - - - - - - - - - - - 9 Synthetic transactions 186 - - - - 186 - - 0 28 - - 0 2 - - 0 10 Securitisation 186 - - - - 186 - - 0 28 - - 0 2 - - 0 11 Retail underlying - - - - - - - - - - - - - - - - - 12 Wholesale 186 - - - - 186 - - 0 28 - - 0 2 - - 0 13 Re-securitisation - - - - - - - - - - - - - - - - - 12/31/2024 a b c d e f g h i j k l m n o EU-p EU-q Exposure values (by RW bands/deductions)
Exposure values (by regulatory
approach)Risk-weighted assets
(by regulatory approach)Capital charge after cap in millions of euros ≤20%
RW>20%
to
≤50%
RW>50% to
≤100%
RW>100%
to
<1250
% RW1250%
RW /
deduct
ionsSEC-
IRBASEC-
ERBA
(includin
g IAA)SEC-SA 1250%
RW /
deduct
ionsSEC-
IRBASEC-
ERBA
(includin
g IAA)SEC-SA 1250%
RW /
deduct
ionsSEC-
IRBASEC-
ERBA
(includin
g IAA)SEC-SA 1250%
RW /
deduct
ions1 Total exposures 12,332 1,135 13 34 39 1,965 301 11,250 39 321 85 1,655 488 26 7 132 39 2 Traditional transactions 10,525 1,135 13 34 39 158 301 11,250 39 50 85 1,655 488 4 7 132 39 3 Securitisation 10,525 1,135 13 34 39 158 301 11,250 39 50 85 1,655 488 4 7 132 39 4 Retail 1,438 823 - - - - - 2,261 - - - 345 - - - 28 - 5 Of which STS 255 - - - - - - 255 - - - 25 - - - 2 - 6 Wholesale 9,087 312 13 34 39 158 301 8,989 39 50 85 1,310 488 4 7 105 39 7 Of which STS 1,437 - - - - - - 1,437 - - - 141 - - - 11 - 8 Re-securitisation - - - - - - - - - - - - - - - - - 9 Synthetic transactions 1,807 - - 0 - 1,807 - - - 271 - - - 22 - - - 10 Securitisation 1,807 - - 0 - 1,807 - - - 271 - - - 22 - - - 11 Retail underlying - - - - - - - - - - - - - - - - - 12 Wholesale 1,807 - - 0 - 1,807 - - - 271 - - - 22 - - - 13 Re-securitisation - - - - - - - - - - - - - - - - - EU-SEC4 - Securitisation exposures in the non-trading book and associated regulatory capital requirements -institution acting as investor
12/31/2025 a b c d e f g h i j k l m n o EU-p EU-q Exposure values (by RW bands/
deductions)Exposure values (by regulatory
approach)RWEA
(by regulatory approach)Capital charge after cap in millions of euros ≤20%
RW>20% to
50%
RW>50% to
100%
RW>100%
to
<1250%
RW1250%
RWSEC-
IRBASEC-
ERBA
(including
IAA)SEC-
SA1250% SEC-
IRBASEC-
ERBA
(including
IAA)SEC-
SA1250% SEC-
IRBASEC-
ERBA
(including
IAA)SEC-
SA1250% 1 Total exposures 6,294 1,903 269 282 - - 4,538 4,122 - - 1,227 771 - - 98 62 - 2 Traditional securitisation 6,294 1,903 269 282 - - 4,538 4,122 - - 1,227 771 - - 98 62 - 3 Securitisation 6,294 1,903 269 282 - - 4,538 4,122 - - 1,227 771 - - 98 62 - 4 Retail underlying 3,742 1,599 146 282 - - 4,202 1,509 - - 1,146 294 - - 92 24 - 5 Of which STS 2,645 - - - - - 2,621 24 - - 272 3 - - 22 0 - 6 Wholesale 2,553 304 124 0 - - 336 2,614 - - 80 477 - - 6 38 - 7 Of which STS 13 - - - - - - 13 - - - 1 - - - 0 - 8 Re-securitisation - - - - - - - - - - - - - - - - - 9 Synthetic securitisation - - - - - - - - - - - - - - - - - 10 Securitisation - - - - - - - - - - - - - - - - - 11 Retail underlying - - - - - - - - - - - - - - - - - 12 Wholesale - - - - - - - - - - - - - - - - - 13 Re-securitisation - - - - - - - - - - - - - - - - - 12/31/2024 a b c d e f g h i j k l m n o EU-p EU-q Exposure values (by RW bands/
deductions)Exposure values (by regulatory
approach)RWEA
(by regulatory approach)Capital charge after cap in millions of euros ≤20%
RW>20% to
50%
RW>50% to
100%
RW>100%
to
<1250%
RW1250%
RWSEC-
IRBASEC-
ERBA
(including
IAA)SEC-
SA1250% SEC-
IRBASEC-
ERBA
(including
IAA)SEC-
SA1250% SEC-
IRBASEC-
ERBA
(including
IAA)SEC-
SA1250% 1 Total exposures 5,750 1,726 275 357 0 - 4,610 3,385 0 - 1,499 646 0 - 120 52 0 2 Traditional securitisation 5,750 1,726 275 357 0 - 4,610 3,385 0 - 1,499 646 0 - 120 52 0 3 Securitisation 5,750 1,726 262 357 0 - 4,610 3 372 - - 1,499 633 - - 120 51 - 4 Retail underlying 3,437 1,444 139 332 - - 4,419 933 - - 1,406 145 - - 112 12 - 5 Of which STS 2,411 0 - - - - 2,313 99 - - 278 10 - - 22 1 - 6 Wholesale 2,314 282 123 25 0 - 191 2,439 - - 93 488 - - 7 39 - 7 Of which STS 14 - - - - - - 14 - - - 1 - - - 0 - 8 Re-securitisation - - 13 - 0 - - 13 0 - - 13 0 - - 1 0 9 Synthetic securitisation - - - - 0 - - - 0 - - - 0 - - - 0 10 Securitisation - - - - 0 - - - 0 - - - 0 - - - 0 11 Retail underlying - - - - 0 - - - 0 - - - 0 - - - 0 12 Wholesale - - - - - - - - - - - - - - - - - 13 Re-securitisation - - - - - - - - - - - - - - - - - 12/31/2025 12/31/2024 Securitization Re-
securitizationSecuritization Re-
securitizationSecuritization Re-
securitizationSecuritization Re-
securitizationin millions of euros EAD EAD Risk-
Weighted
AssetsRisk-
Weighted
AssetsEAD EAD Risk-
Weighted
AssetsRisk-
Weighted
AssetsInvestor positions 8,661 - 1,997 - 8,096 13 2,132 13 On-balance sheet exposure 7,593 - 1,739 - 6,936 13 1,837 13 Off-balance sheet exposure and derivatives 1,068 - 258 - 1,160 - 295 - Originator positions 976 - 242 - 2,109 - 869 - On-balance sheet exposure 976 - 242 - 2,109 - 868 - Off-balance sheet exposure and derivatives - - - - 0 - 1 - Sponsor positions 11,379 - 1,689 - 11,445 - 1,681 - On-balance sheet exposure - - - - 68 - 7 - Off-balance sheet exposure and derivatives 11,379 - 1,689 - 11,376 - 1,674 - TOTAL 21,015 - 3,928 - 21,650 13 4,681 13 12/31/2025 a c d e g h i k l Institution acts as originator Institution acts as sponsor Institution acts as investor Traditional Synthetic Sub-total Traditional Synthetic Sub-total Traditional Synthetic Sub-total in millions of euros STS STS STS 1 Total exposures 573 - 573 2 Retail (total) 352 - 352 3 residential mortgage 147 - 147 4 credit card 148 - 148 5 other retail exposures 57 - 57 6 re-securitisation - - - 7 Wholesale (total) 222 - 222 8 loans to corporates 153 - 153 9 commercial mortgage - - - 10 lease and receivables 69 - 69 11 other wholesale - - - 12 re-securitisation - - - 12/31/2024 a c d e g h i k l Institution acts as originator Institution acts as sponsor Institution acts as investor Traditional Synthetic Sub-total Traditional Synthetic Sub-total Traditional Synthetic Sub-total in millions of euros STS STS STS 1 Total exposures 610 610 2 Retail (total) 287 - 287 3 residential mortgage 89 - 89 4 credit card 120 - 120 5 other retail exposures 78 - 78 6 re-securitisation - - - 7 Wholesale (total) 322 - 322 8 loans to corporates 265 - 265 9 commercial mortgage - - - 10 lease and receivables 40 - 40 11 other wholesale - - - 12 re-securitisation 18 - 18 EU SEC5 – Exposures securitised by the institution - Exposures in default and specific credit risk adjustments
12/31/2025 a b c Exposures securitised by the institution - Institution acts as originator or as sponsor Total outstanding nominal amount Total amount of specific
credit risk adjustments made
during the periodin millions of euros Of which exposures in
default1 Total exposures 16,121 60 2 Retail (total) 1,908 30 3 residential mortgage 998 0 4 credit card 670 - 5 other retail exposures 241 30 6 re-securitisation - - 7 Wholesale (total) 14,213 31 8 loans to corporates 5,513 7 9 commercial mortgage 7,000 - 10 lease and receivables 1,463 14 11 other wholesale 238 10 12 re-securitisation - - 12/31/2024 a b c Exposures securitised by the institution - Institution acts as originator or as sponsor Total outstanding nominal amount Total amount of specific
credit risk adjustments made
during the periodin millions of euros Of which exposures in
default1 Total exposures 17,578 85 - 2 Retail (total) 1,952 25 - 3 residential mortgage 1,087 2 - 4 credit card 569 - - 5 other retail exposures 296 23 - 6 re-securitisation - - - 7 Wholesale (total) 15,626 59 - 8 loans to corporates 6,889 12 - 9 commercial mortgage 6,837 - - 10 lease and receivables 1,533 15 - 11 other wholesale 367 33 - 12 re-securitisation - - - -
8.2 Market risk management
The Risk division works in the areas of risk measurement, definition and oversight of limits, and supervision of market risks. It is tasked with the following duties:
From a prudential standpoint, Groupe BPCE uses the standardized approach to measure market risk. The risk monitoring system relies on three types of indicators used to manage activity, on an overall basis and by similar activity, by focusing on directly observable criteria, including:
- sensitivity to variations in the underlying instrument, variations in volatility or to correlation, nominal amounts, and diversification indicators. The limits corresponding to these qualitative and quantitative operational indicators thus complement the VaR limits and stress tests;
- daily assessment of global market risk measurement through a 99% one-day VaR;
- stress tests to measure potential losses on portfolios in extreme market conditions. The Group system relies on comprehensive stress tests and specific stress tests for each activity.
Special reports on each business line are sent daily to the relevant operational staff and managers. BPCE’s Group Risk division also provides a weekly report summarizing all of the Group’s market risk, with a detailed breakdown for Natixis and BRED Banque Populaire.
In addition, for Natixis, global market risk reports are sent to the central institution on a daily basis. The latter produces a weekly summary of market risk indicators and results for the Group’s executive management.
Finally, a global review of Groupe BPCE’s consolidated market risks (covering VaR measures and hypothetical/historic stress scenarios) is presented to the Group Market Risk Committee, in addition to risk reports prepared for the entities.
In response to the Revised Pillar III Disclosure Requirements (MRB Table: Qualitative disclosures for banks using the Internal Models Approach), the main characteristics of the various models used for market risk are presented in the Natixis Registration Document.
The internal market risk and valuation models used by Natixis are validated by the Model Risk Management and Wholesale Banking Validation team of Groupe BPCE’s Risk division. This independent validation of the models is part of the broader model risk management framework described in Section 15.
- theoretical and mathematical validation of the model, analysis of the assumptions and their justification in the model documentation;
- algorithmic validation and comparison with alternative models (benchmarking);
- analysis of the stability, the convergence of the numerical method, the stability of the model in the event of stressed scenarios;
- study of implicit risk factors and calibration, analysis of input data, and identification of upstream models;
- measurement of the model risk and validation of the associated reserve methodology.
Each institution’s Risk division monitors and verifies compliance with sensitivity limits on a daily basis. If a limit is breached, an alert procedure is triggered in order to define the measures required to return within operational limits.
Market risk is also monitored and assessed via synthetic VaR calculations, which determine potential losses generated by each business line at a given confidence level (99%) and over a given holding period (one day). For calculation purposes, changes in market inputs used to determine portfolio values are modeled using statistical data.
All decisions relating to risk factors using the internal calculation tool are revised regularly by committees involving all of the relevant participants (Risk division, Front Office and Results department). Quantitative and objective tools are also used to measure the relevance of risk factors.
VaR is based on numerical simulations, using a Monte-Carlo method which takes into account possible non-linear portfolio returns based on the different risk factors. It is calculated and monitored daily for all Group trading books, and a VaR limit is defined on a global level and per business line. The calculation tool generates 10,000 scenarios, which provides satisfactory precision levels. For certain complex products, which account for a minor share of the trading books, their inclusion in the VaR calculation is obtained by using sensitivities. VaR backtesting is carried out on approved scopes and confirms the overall robustness of the model used. Extreme risks, which are not included in VaR, are accounted for using stress tests throughout the Group.
This internal VaR model used by Natixis was approved by the Autorité de contrôle prudentiel et de résolution (ACPR), the French prudential supervisory authority for the banking and insurance sector, in January 2009. Natixis thus uses VaR to calculate the capital requirements for market risks in the approved scopes.
Stress tests are calibrated according to severity and occurrence levels, which are consistent with portfolio management objectives:
Trading book stress tests are calibrated over a 10-day period and a 10-year probability of occurrence.
- historical scenarios, which reproduce changes in market conditions observed during past crises, their impacts on current positions and P&Ls. They can be used to assess the exposure of the Group’s activities to known scenarios. 12 historical stress tests have been in place since 2010;
- hypothetical scenarios, which involve simulating changes in market conditions in all activities based on plausible assumptions concerning the dissemination of an initial shock. These shocks are based on scenarios defined according to economic criteria (real estate crisis, economic crisis, etc.), geopolitical considerations (terrorist attacks in Europe, toppling of a regime in the Middle East, etc.) or other factors (bird flu, etc.). The group has had seven theoretical stress tests since 2010.
Banking book stress tests are calibrated over a longer period in line with the banking book’s management periods:
- a bond stress test calibrated using a mixed hypothetical-historical approach that reproduces a stress on European sovereigns (similar to the 2011 crisis);
- a bond stress test calibrated using a mixed hypothetical-historical approach that reproduces a stress on corporates (similar to the 2008 crisis);
- an equity stress test calibrated over the 2011 historical period, applied to equity investments for the purpose of the liquidity reserve;
- a private equity and real estate stress test, calibrated over the 2008 historical period, applied to the private equity and real estate portfolios.
The different stress tests are subject to limits set by institution and for the Group. These are monitored as part of the recurring control system and through regular reporting.
The Group has established an organizational structure tasked with independent price verification (IPV) through:
- creation of a Group valuation team in the Market Risk division;
- Group governance to ensure compliance.
The Group Risk division is responsible for monitoring the risks associated with all Groupe BPCE capital market activities, subject to regular review by the Group Market Risk Committee.
Within the scope of the trading book, market risk is monitored daily by measuring Group Value at Risk (VaR) and performing global and historical stress tests. The proprietary VaR calculation system developed by Natixis is used by the Group. This system provides a tool for the measurement, monitoring and control of market risk at the consolidated level and for each institution, on a daily basis and taking account of correlations between the various portfolios. There are certain distinctive characteristics of Groupe BPCE that must be considered, in particular:
- for Natixis: given the size of its capital markets business, Natixis’ risk management framework is specifically tailored to this entity;
- for the Banque Populaire network: only BRED Banque Populaire has a capital markets business. It monitors the financial transactions carried out by the Banque Populaire network trading floor and Finance division daily, using 99% one-day Value at Risk, sensitivity, volume and stress scenario indicators;
- for Banque Palatine: daily monitoring of trading book activities is based on the Risk division’s supervision of 99% one-day Value at Risk, stress tests and compliance with regulatory limits.
All limits (operational indicators, VaR, and stress tests) are monitored daily by each institution’s Risk division. Any limit breaches must be reported and, where applicable, are subject to a Management decision concerning the position in question (close, hedge, hold, etc.).
These supervisory mechanisms also have operational limits and resilience thresholds that determine the Group’s risk appetite for trading operations.
Banking book risk is supervised and monitored by activity: liquidity reserves, illiquid assets (private equity, non-operational real estate), securitizations and liquid assets excluding liquidity reserves. Liquidity reserves and liquid assets excluding liquidity reserves are monitored monthly, mainly via stress test indicators. Illiquid assets and securitizations are monitored quarterly.
The Group’s single treasury and central bank collateral management pool is subject to daily monitoring of risks and economic results for all of its activities, which are mainly related to the banking book.
The Group has complied with the requirements set out in Article 2 of the order of September 9, 2014, implementing Title I of act No. 2013-672 of July 26, 2013, on the separation and regulation of banking activities (SRAB act), amended by the order of March 18, 2019.
Groupe BPCE also falls within the scope of application of the American Volcker Rule. However, only the institutions of the “Small Group” - composed of BPCE SA and its subsidiaries held at more than 25% including Natixis SA and its subsidiaries (Asset Management division and Wealth Management division), Groupe Crédit Foncier, Banque Palatine, BPCE International, the subsidiaries of the FSE division, Oney, Insurance, Payments - are affected by the requirements of the Volcker rule.
-
8.3 Quantitative information
Group VaR (Monte Carlo, 99%, for one day) amounted to €7.3 million at December 31, 2025 compared to €7.9 million at December 31, 2024.
The Group VaR RAF threshold was respected throughout the year and remained at relatively low levels, despite a maximum reached at the end of April at 49% of the threshold, after the Liberation Day announcements. The average consumption was 32%, with variations linked mainly to the equity and fixed income activities.
Monte-Carlo VaR 99% in millions of euros 12/31/2025 average min. max. 12/31/2024 Equity risk 5.6 5.9 3.5 10.6 6.1 Exchange rate risk 3.0 2.5 0.9 5.7 1.9 Commodity risk 1.7 1.0 0.4 2.0 0.6 Credit risk 1.5 1.2 0.4 2.4 0.5 Interest rate risk 4.2 4.2 2.0 7.4 4.8 Total 16.1 13.8 Compensation effect 8.8 6.0 Consolidated VaR 7.3 8.0 5.9 12.2 7.9 12/31/2025 12/31/2024 in millions of euros Risk-Weighted Assets Capital
requirementsRisk-Weighted Assets Capital
requirements
Interest rate risk 3,899 312 2,195 176 Equity risk 1,893 151 945 76 UCI position risk 114 9 66 5 Exchange rate risk 5,309 425 4,613 369 Commodity risk 1,314 105 680 54 Settlement-delivery risk 17 1 0 0 Major trading book risk - - - 0 Specific risk on securitization positions 195 16 350 28 Internal model approach risk 4,793 383 6,351 508 TOTAL 17,534 1,403 15,201 1,216 -
8.4 Detailed quantitative information
The detailed quantitative information relating to market risk in the following tables enhances the information in the previous section in respect of Pillar III.
12/31/2025 12/31/2024 in millions of euros RWEAs RWEAs OUTRIGHT PRODUCTS 1 Interest rate risk (general and specific) 3,609 2,088 2 Equity risk (general and specific) 1,747 874 3 Foreign exchange risk 4,353 4,563 4 Commodity risk 1,261 646 OPTIONS 5 Simplified approach 0 0 6 Delta-plus approach 299 138 7 Scenario approach 1,253 191 8 Securitisation (specific risk) 202 350 9 TOTAL 12,724 8,849 a b in millions of euros 12/31/2025 12/31/2024 VAR (10 DAYS, 99%) 1 Maximum value 37.7 44.1 2 Average value 21.8 26.5 3 Minimum value 11.9 18.8 4 Period end 13.6 24 SVAR (10 DAYS, 99%) 5 Maximum value 81.2 88.2 6 Average value 50.1 62.3 7 Minimum value 32.1 42.8 8 Period end 44.1 42.8 IRC (99.9%) 9 Maximum value 66.7 62.7 10 Average value 35.2 36.9 11 Minimum value 18.1 15.8 12 Period end 61.1 22.5 The chart below shows the backtesting (a posteriori comparison of the potential loss), as calculated ex-ante by the VaR (99% one-day), with the hypothetical results and the actual results observed in profit or loss on the regulatory scope and enables the robustness of the VaR indicator to be verified:
In 2025, five backtesting exceptions were recorded on the hypothetical P&L, on April 9, June 26, October 29, December 5 and December 29, 2025, following losses resulting from market movements, mainly relating to interest rates.
12/31/2025 12/31/2024 a b c d in millions of euros RWEAs Own funds
requirementsRWEAs Own funds
requirements1 VAR (HIGHER OF VALUES A AND B) 1,119 89 1,618 129 (a) Previous day’s VaR (VaRt-1) 14 24 (b) Multiplication factor (mc) x average of previous 60 working days (VaRavg) 89 129 2 SVAR (HIGHER OF VALUES A AND B) 2,910 233 4,122 330 (a) Latest available SVaR (SVaRt-1) 44 43 (b) Multiplication factor (ms) x average of previous 60 working days (sVaRavg) 233 330 3 IRC (HIGHER OF VALUES A AND B) 764 61 611 49 (a) Most recent IRC measure 61 28 (b) 12 weeks average IRC measure 56 49 4 COMPREHENSIVE RISK MEASURE (HIGHER OF VALUES A, B AND C) 0 0 0 0 (a) Most recent risk measure of comprehensive risk measure 0 0 (b) 12 weeks average of comprehensive risk measure 0 0 (c) Comprehensive risk measure - Floor 0 0 5 OTHER 0 0 0 0 6 Total 4,793 383 6,351 508 a b c d e f g in millions of euros VaR SVaR IRC Comprehensive
risk measureOther Total
RWEAsTotal own funds
requirements1 RWEAs at previous period end (12/31/2024) 1,618 4,122 611 - - 6,351 508 1a Regulatory adjustment (1,318) (3,587) (259) - - (5,164) (413) 1b RWEAs at the previous quarter-end (end of the day) 300 535 352 - - 1,187 95 2 Movement in risk levels (131) 16 412 - - 298 24 3 Model updates/changes - - - - - - - 4 Methodology and policy - - - - - - - 5 Acquisitions and disposals - - - - - - - 6 Foreign exchange movements - - - - - - - 7 Other - - - - - - - 8a RWEAs at the end of the reporting period (end of the day) 169 551 764 - - 1,485 119 8B REGULATORY ADJUSTMENT 949 2,359 - - - 3,308 265 8 RWEAs at the end of the reporting period (12/31/2025) 1,119 2,910 764 - - 4,793 383 - regulatory adjustment: delta between the RWAs used in the calculation of regulatory RWAs and the RWAs calculated on the last day of the period;
- changes in risk levels: changes related to market characteristics;
- model updates/modifications: changes linked to significant modifications of the model following an update of the calculation perimeter, the methodology, the assumptions or the calibration;
- methodology and policies: changes related to regulatory changes;
- acquisitions and disposals: changes following the purchase or disposal of business lines.
The VaR level for Natixis’ trading books averaged €7.8 million, with a minimum of €5.9 million on April 1, 2025, and a peak of €12.6 million on April 23, 2025, and standing at €6.8 million at December 31, 2025.
The breakdown of the VaR by business line provides a picture of the monthly contribution of the main business lines and the netting effects in terms of VaR.
This slight decrease is mainly due to the prudent management of positions, in an unstable geopolitical environment and more sustained commercial activity.
The level of stressed regulatory VaR averaged €15.8 million, with a reported minimum of €10.2 million on November 12, 2025, a maximum of €25.7 million on April 7, 2025, and a level of €13.9 million at December 31, 2025.
This indicator covers the regulatory scope. Natixis’ IRC averaged €35.2 million, bottoming out at €18.1 million on May 8, 2025, with a peak of €66.7 million on December 17, 2025, and stood at €48.9 million at December 31, 2025. IRC is subject to greater variations following a methodological change in the model passed on April 5, 2024 concerning the cash-based CDS component directly incorporated into the IRC amount.
Overall stress test levels reached an average level of +€198 million as at December 31, 2025, versus +€158 million as at December 31, 2024.
-
9.1 Governance and structure
Like all credit institutions, Groupe BPCE is exposed to structural liquidity, interest rate and foreign exchange risks.
These risks are closely monitored by the Group and its institutions to secure immediate and future income, balance the balance sheets and promote the Group’s development.
The Audit Committee and the Supervisory Board of Groupe BPCE are consulted on the general asset/liability management policy and are informed of any major decisions taken regarding liquidity, interest rate and foreign exchange risk management. The implementation of the chosen policy is delegated to the Group Asset/Liability Management Committee.
Each year, Supervisory Board of Groupe BPCE validates the main lines of the ALM policy, i.e. the principles of market risk measurements and levels of risk tolerance. It also reviews the risk limit system each year.
-
9.2 Liquidity risk management policy
Liquidity risk is defined as the risk of the Group being unable to meet its commitments or to settle or offset a position, due to market conditions factors specific to Groupe BPCE, within a specified period and at a reasonable cost. It reflects the risk of not being able to meet net cash outflows, including those related to collateral requirements, over all time horizons, from the short term to the long term.
- in the short-term, it involves assessing an institution’s ability to withstand a crisis;
- in the medium-term, liquidity is measured in terms of cash requirements;
- in the long-term, it involves monitoring the institution’s maturity transformation level.
Liquidity risk is likely to materialize in the event of a decline in sources of financing that could be caused by a massive withdrawal of customer deposits or by problems in executing the annual financing plan following a widespread crisis of confidence on the markets or events specific to Groupe BPCE. It could also be triggered by an increase in financing needs due to an increase in drawdowns on loan commitments, an increase in margin calls or a higher collateral requirement.
All liquidity risk factors are accurately mapped, updated annually and presented to the Group Asset/Liability Management Committee. This mapping identifies the various risks as well as their level of materiality, assessed according to various criteria shared between the Asset/Liability Management and Risk divisions.
The liquidity management policy aims mainly to refinance all of the Group’s business lines in an optimal and sustainable manner.
- ensure a sustainable refinancing plan at the best possible price, making it possible to finance the Group’s various activities over a period consistent with the assets created;
- distribute this liquidity between the various business lines and monitor its use and changes in liquidity levels;
- comply with regulatory ratios and internal constraints resulting in particular from stress tests guaranteeing the sustainability of the Group’s business model refinancing plan, even in the event of a crisis.
- centralized funding management aimed primarily at supervising the use of short-term funding, spreading out the maturity dates of medium- and long-term funds and diversifying sources of liquidity;
- supervision of each business line’s liquidity consumption, predominantly by maintaining a balance between growth in the credit segment and customer deposit in flows;
- the creation of liquidity reserves, both in cash and collateral, in line with future liabilities and the targets set for securing the Group’s liquidity.
These systems are managed and overseen by way of a consistent set of indicators, limits and management rules are combined in a centralized framework of standards and rules for the Group’s institutions, so as to ensure the measurement and consolidated management of liquidity risk.
To keep track of its liquidity risks and define appropriate management and/or corrective actions, the Group has established a reliable, comprehensive and effective internal liquidity management and oversight system including a set of associated indicators and their limits. Liquidity risk management and monitoring are carried out at the consolidated Group level and within each of its entities. The definition of these indicators, the calculation methodology and any associated limits are covered in a body of consolidated standards that is reviewed and validated by the decision-making bodies of the Group and its institutions.
The liquidity consumption of the Group’s various business lines and within the entities is governed by an internal liquidity allocation system based, on the one hand, on the setting of a target level of short-term, medium-term and long-term market footprint for the Group and, on the other hand, on its distribution among the Group’s various entities via a liquidity budget system. The Group’s market footprint measures its overall dependence to date on bond and money market funding. The sustainability of the Group’s market access is measured on a regular basis. The structure of the Group’s market footprint (schedule, type of vehicles, currencies, geographic area, investor categories, etc.) is thus closely monitored to ensure that it is not dependent on short-term financing and that sources of funds are diversified.
Each entity is required to meet the liquidity budget allocated to it both in terms of actual liquidity consumption and in terms of the projected vision as part of the budget process and the multi-year forecast. Compliance with the liquidity budget allocated to each entity makes it possible to ensure that the market footprint target set by the Group is correctly sized and to adapt, where necessary, the business line projections. Moreover, this also makes it possible to adjust the implementation rate of the multi-year funding plan based on the needs expressed by the business lines and the Group’s capacity to carry out public issues on the market.
The financing needs of the business lines are closely correlated with changes in commercial assets and liabilities (customer loans and deposits), in terms of both the liquidity gap between the average assets and liabilities and the need for liquidity reserves that can be generated through compliance with the liquidity coverage ratio (LCR).
The liquidity gap resulting from commercial activity is measured using the customer loan-to-deposit ratio (LTD) at both the consolidated and entity level. This indicator allows a relative measure of the Group’s autonomy with regard to the financial markets and monitors changes in the structure of the commercial balance sheet.
The liquidity risk of the Group and its entities is measured based on regulatory ratios as defined by European regulations, with the LCR (liquidity coverage ratio for short-term liquidity) and the NSFR (Net Stable Funding Ratio for long-term liquidity).
This regulatory approach is complemented by an internal “economic” approach consisting of measuring the liquidity gap over a 10-year horizon. It makes it possible to control the flow of medium and long-term debt and to anticipate the Group’s refinancing needs. It is governed by Group and individual entity limits.
The liquidity gap is measured using a so-called static approach, which only takes into account on-balance sheet and off-balance sheet positions to date, and incorporates outflow assumptions for unmatured products. These assumptions are based either on internal modeling (early repayment of loans, closing and deposits on home savings plans or PELs, etc.) or on agreements established for all Group entities (notably for customer deposits with no fixed maturity date, demand deposits and passbook savings accounts). The validation of the models and agreements is based on a process shared between the Asset/Liability management function and the Risk division which ensures a cross-examination of the relevance of the assumptions used and their suitability with respect to the current limit system.
Liquidity crisis simulations are regularly carried out to test the Group’s ability to meet its commitments and continue its day-to-day business in a context of crisis. This stress test system is intended to become a tool to support management decisions and to assess the Group’s resilience over a defined period of time, as well as the relevance of its management system.
Under normal circumstances, these simulations aim to regularly measure exposure to liquidity risks by playing out a set of different determined stress scenarios. They make it possible to ensure the correct balance between the Group’s liquidity reserve and changes in the net liquidity position under stress, as well as the ability to comply with regulatory requirements.
In a crisis situation, they make it possible to simulate possible changes in the instantaneous liquidity position on the basis of tailor-made scenarios, to identify potential impacts and to define the actions to be taken in the short-term.
The stress calculation methodology is based on the projection of the Group’s on-balance sheet and off-balance sheet flows with stressed assumptions defined in the context of stress scenarios and on changes in the liquidity reserve taking into account securities transactions and different valuations (Market, ECB haircuts) according to different scenarios. Thus, for example, we assume that we will only be able to partially renew all maturing refinancing operations, will have to cope with requests for early repayment of deposits or unexpected disbursements on off-balance sheet loan commitments, and will incur a loss of customer deposits or a substantial change in their structure, or a loss of liquidity in certain market assets.
Liquidity stressors are based on different scenarios: idiosyncratic (Group-specific) crisis, systemic crisis (affecting all financial institutions), and a combined crisis. Different intensity levels are also used to enable sensitivity analyses.
The Group’s consolidated indicators are produced by the Asset/Liability Management department based on indicators produced at the level of each entity. The indicators are derived from data collected in the entities’ information systems in accordance with a Group organization scheme (data collection and harmonization, correction and validation process).
A first-level control is carried out by the ALM departments of the entities in conjunction with Group ALM, followed by a second-level control carried out by the Risk departments of the entities and the Group.
The Group’s Contingency Funding Plan (CFP) brings together the work implemented by the Group to facilitate its management of liquidity crisis situations.
The CFP also includes an inventory and an analysis ahead of the financial and business lines that the Group can implement, including potential liquidity gains and the associated costs (loss of profitability) and possible obstacles to their implementation. These levers can be grouped into three categories:
1) liquidity collection: The Group comprises many entities, which allows it to collect liquidity on an ad hoc basis and in a diversified manner;
2) reduction in liquidity consumption: Given its activities, the Group could, if necessary, reduce the financing it grants to the economy, particularly on the most controllable activities of its Corporate & Investment Banking in the event of tensions on its liquidity position;
3) the monetization of liquid assets: The Group has significant collateral reserves that can be converted into cash if necessary.
The lessons learned from past crises are used to update the system in all its components, namely the early warning indicators (EWI) system, the comitology system and the related escalation process, as well as the assessment of the different levers.
The Financial Management department organizes, coordinates and supervises the funding of Groupe BPCE on the markets.
Groupe BPCE’s short-term funding is operated by a joint refinancing pool. This integrated treasury team is capable of managing the Group’s cash position more efficiently, particularly during a credit crunch.
The Group has access to short-term market funding through its two main issuers: BPCE and its subsidiary Natixis. In 2025, BPCE created an asset-backed commercial paper (ABCP) conduit, Portdalon, providing additional access to secured short-term liquidity.
For medium- and long-term funding requirements (more than one year), in addition to deposits from customers of the Banque Populaire and Caisse d’Epargne networks, which are the primary source of funding, the Group also issues bonds on the financial markets with BPCE as principal operator, offering the broadest range of bonds to investors:
- directly as BPCE for subordinated debt issues (Additional Tier-1 and Tier-2), senior non-preferred debt and vanilla senior preferred debt issues, in multiple currencies, with the main currencies being the euro, the United States dollar, the British pound sterling, the Japanese yen, the Australian dollar and the Singapore dollar;
- or as BPCE SFH, the Group’s main issuer of covered bonds; this issuer, operated by BPCE, specializes in obligations de financement de l’habitat (OH), a category of secured bond guaranteed by French legislation (backed by residential home loans in France).
- Natixis for structured senior preferred debt issues (private placements only) under the Natixis name, and for covered bonds under German law (backed by commercial home loans) under the Natixis Pfandbriefbank AG name;
- Crédit Foncier for issues of covered bonds of the type known as obligations foncières (OF), under the Compagnie de Financement Foncier name (a subsidiary of Crédit Foncier). OFs are a category of covered bonds based on French legislation (backed by public sector loans and assets, in line with the new positioning decided on in 2018 for this Group issuer, because this issuer’s collateral still includes residential home loan outstandings in France previously produced by Crédit Foncier).
It should be noted that BPCE also contributes to the medium- and long-term refinancing of Corporate & Investment Banking hosted by Natixis (in addition to the structured private placements mentioned above and Natixis’ own customer collections), which no longer intends to be an issuer on the markets in the form of a public issue.
BPCE has short-term funding programs governed by French law (NEU CP), UK law (Euro Commercial Paper) and New York State law (US Commercial Paper), and MLT funding programs governed by French law (EMTN and Neu MTN), New York State law (US MTN), Japanese law (Samurai) and New South Wales law (AUD MTN).
Lastly, the Group is able to carry out secured refinancing operations, in particular in the form of securitization of receivables or securitization of collateralized loans structured from loans originated by the Banque Populaire and Caisse d’Epargne networks as well as the specialized subsidiaries (Financial Solutions & Expertise).
The centralization of the Group’s refinancing involves the implementation of liquidity circulation principles within the Group and the rules for pricing this liquidity so that liquidity can circulate in the best possible way between the Group’s entities.
In its liquidity management policy, Groupe BPCE attaches great importance to the management and optimization of its collateral. Non-negotiable debt securities (in particular loans originated by the networks) and negotiable debt securities (financial securities, etc.) that are eligible for a funding arrangement, whether Central Bank funding (via the 3G pool) or Group funding (covered bonds, securitization, etc.) are classified as collateral.
- centralized management of the entities’ collateral by the central institution in order to improve oversight and operationality of collateral management. For entities with a 3G Pool (Natixis, Compagnie de Financement Foncier, BRED), each entity is responsible for its own collateral. Nonetheless, these entities cannot directly participate in ECB refinancing operations without prior approval from the central institution;
- a definition of investment and management rules by the central institution, with the entities enjoying autonomy in their decision-making in accordance with Group standards;
- a set of indicators relating to the monitoring of collateral determined at Group level and monitored by the Group’s Asset/Liability Management Committee.
-
9.3 Quantitative information
At December 31, 2025, the liquidity reserves covered 197% of the short-term funding and short-term maturities of MLT debt (€155 billion at December 31, 2025) compared to 177% at December 31, 2024 (ST and MLT maturities of €171 billion).
The increase in the coverage ratio is partly related to the repayments of short-term loans made mainly in April 2025 and extended until the end of the year.
The change in the liquidity reserve during 2025 reflects the Group’s liquidity management policy with the desire to maintain a high level of hedging of its liquidity risk.
in millions of euros 01/01/2026 to 12/31/2026 01/01/2027 to 12/31/2029 01/01/2030 to 12/31/2033 Liquidity gap 40,325 22,544 12,682 The projected liquidity position shows a structural liquidity surplus over the analysis horizon. Compared with the end of 2024, this surplus increased by €16.0 billion over one year and by €3.0 billion over two to four years, and decreased by €3.4 billion over five to eight years.
Over the short-term horizon, the increase of the liquidity surplus was mainly due to the Commercial Banking networks with an improvement in the customer gap due to the increase in term and sight resources. This beneficial effect of higher inflows was mitigated by an increase in customer loans (homes and equipment). In addition, the cash gap also improved due to an increase in specialized medium- and long-term refinancing.
Over the two-to-four year horizon, the liquidity surplus increased compared to the end of 2024. This increase is smaller than over the one-year horizon because the contribution of the networks’ customer gap became neutral. The improvement in the liquidity surplus is explained in particular by the improvement in the cash gap of BPCE SA due to an increase in interbank borrowings. In the longer term, this increase in surplus disappears with the significant degradation of Natixis’ cash gap due to an increase in interbank loans.
At December 31, 2025, the Group’s customer loan-to-deposit ratio declined to 123% compared to 128% at December 31, 2024.
in millions of euros Less
than 1
monthFrom 1
month
to 3 monthsFrom 3
months
to 1 yearFrom 1 year
to 5 yearsMore than
5 yearsNot
determinedTotal at
12/31/2025Cash and amounts due from central banks 133,133 64 741 133,938 Financial assets at fair value through profit or loss 239,646 239,646 Financial assets at fair value through other comprehensive income 1,295 1,493 2,771 32,823 21,120 4,469 63,971 Hedging derivatives 6,398 6,398 Securities at amortized cost 488 475 1,842 11,430 11,759 856 26,851 Loans and advances to banks and similar at amortized cost 107,896 11,311 1,558 536 582 490 122,373 Loans and advances to customers at amortized cost 60,901 24,831 75,044 286,934 419,060 12,637 879,407 Revaluation differences on interest rate risk-hedged portfolios, assets (2,201) (2,201) FINANCIAL ASSETS BY MATURITY 303,713 38,173 81,215 331,723 452,521 263,037 1,470,383 Central banks 12 12 Financial liabilities at fair value through profit or loss 3,795 500 2,412 16,586 26,634 183,850 233,777 Hedging derivatives 13,251 13,251 Debt securities 24,435 28,329 48,527 107,171 77,076 (2,502) 283,035 Amounts due to banks and similar 36,735 9,518 7,208 21,012 16,411 55 90,939 Amounts due to customers 608,938 27,896 32,570 72,961 13,407 1,481 757,253 Subordinated debt 738 7 3,055 1,494 13,392 (675) 18,012 Revaluation differences on interest rate risk-hedged portfolios, liabilities 25 25 FINANCIAL LIABILITIES BY MATURITY 674,641 66,261 93,771 219,224 146,920 195,485 1,396,304 Loan commitments given to banks 127 3 12 638 70 2 851 Loan commitments given to customers 28,584 5,470 22,496 67,449 28,966 9,257 162,222 TOTAL LOAN COMMITMENTS GIVEN 28,710 5,473 22,509 68,087 29,036 9,258 163,074 Guarantee commitments given to banks 409 1,237 1,797 507 1,028 67 5,045 Guarantee commitments given to customers 2,242 3,936 13,529 17,929 10,086 3,351 51,074 TOTAL GUARANTEE COMMITMENTS GIVEN 2,651 5,173 15,326 18,436 11,114 3,419 56,119 in millions of euros Less
than 1
monthFrom 1
month
to 3 monthsFrom 3
months
to 1 yearFrom 1 year
to 5 yearsMore than
5 yearsNot
determinedTotal at
12/31/2024Cash and amounts due from central banks 132,769 23 394 133,186 Financial assets at fair value through profit or loss 230,521 230,521 Financial assets at fair value through other comprehensive income 2,191 795 1,139 25,817 22,902 4,322 57,166 Hedging derivatives 7,624 7,624 Securities at amortized cost 543 908 1,398 11,580 11,404 1,188 27,021 Loans and advances to banks and similar at amortized cost 102,984 9,580 493 1,564 459 782 115,862 Loans and advances to customers at amortized cost 57,309 29,677 74,939 270,945 406,527 12,445 851,843 Revaluation differences on interest rate risk-hedged portfolios, assets (856) (856) FINANCIAL ASSETS BY MATURITY 295,796 40,983 77,970 309,906 441,293 256,420 1,422,368 Central banks 1 1 Financial liabilities at fair value through profit or loss 722 514 2,661 10,317 23,000 181,749 218,963 Hedging derivatives 14,260 14,260 Debt securities 42,061 30,857 49,508 107,946 76,920 (2,335) 304,957 Amounts due to banks and similar 31,959 11,200 5,826 9,669 11,426 (127) 69,953 Amounts due to customers 582,144 27,504 37,162 61,678 13,172 1,429 723,090 Subordinated debt 944 1,589 274 4,674 11,674 (754) 18,401 Revaluation differences on interest rate risk-hedged portfolios, liabilities 14 14 FINANCIAL LIABILITIES BY MATURITY 657,832 71,665 95,431 194,284 136,192 194,236 1,349,640 Loan commitments given to banks 133 90 7 651 279 3 1,163 Loan commitments given to customers 28,842 6,121 22,611 66,065 25,318 5,569 154,527 TOTAL LOAN COMMITMENTS GIVEN 28,975 6,211 22,618 66,716 25,597 5,572 155,689 Guarantee commitments given to banks 322 1,050 1,923 489 1,899 49 5,732 Guarantee commitments given to customers 1,923 6,480 12,558 17,763 10,954 2,795 52,471 TOTAL GUARANTEE COMMITMENTS GIVEN 2,245 7,529 14,481 18,252 12,852 2,844 58,204 Financial instruments marked to market on the income statement and held in the trading book, variable-income available-for-sale financial assets, non-performing loans, hedging derivatives and revaluation differences on interest rate risk-hedged portfolios are placed in the “Not determined” column. These financial instruments are:
- either held for sale or redeemed prior to their contractual maturity;
- or held for sale or redeemed at an indeterminable date (particularly where they have no contractual maturity);
- or measured on the balance sheet for an amount impacted by revaluation effects.
Technical provisions of insurance companies, which, for the most part are equivalent to demand deposits, are not shown in the Table above.
One of Groupe BPCE’s ongoing priorities in terms of medium- and long-term funding in the financial markets is to ensure that sources of funding are properly diversified, in terms of types of investors, types of debt issues, geographic areas and currencies.
Under the 2025 “market” medium- and long-term refinancing program, Groupe BPCE raised a total amount of €35.5 billion in the bond market, of which €23.9 billion excluding structured private placements; the public issues represented 63% of the total amount and the private placements represented 37%.
In addition, the Group raised €8.4 billion in secured funding excluding covered bonds (ABS, collateralized refinancing, etc.).
In 2025, the amount raised in the unsecured bond segment, excluding structured private placements, was €13.9 billion, of which €2 billion in Tier-2, €9.4 billion in the form of senior non-preferred debt and €2.5 billion in the form of senior preferred debt. In addition, €11.6 billion was raised in structured private placements.
In the secured funding segment excluding ABS, the amount raised was €10 billion in covered bonds. In addition, €8.4 billion were raised in the form of ABS, collateralized refinancing and repo transactions for treasury securities.
Since May 2014, Groupe BPCE has implemented several securitization programs for loans originated by the Caisse d’Epargne and Banque Populaire networks in order to manage and optimize two elements of Groupe BPCE:
- the Group’s liquidity reserves, through “self-owned” securitization transactions;
- the Group’s refinancing, through securitization transactions placed on the market or with a limited number of investors.
These self-owned securitization transactions aim to ensure the sustainability of the collateral stock eligible for the Eurosystem in the form of securities and thus contribute to the creation of the Group’s liquidity reserves. In this arrangement, no securities are placed outside the Group. The Sellers are the subscribers of all the securities and therefore retain all the risks and rewards of the receivables sold.
The self-owned securitizations originated by BPCE use residential real estate receivables, equipment loans and personal loans.
They make up a large part of the Group’s liquidity reserve. Some treasury shares are also subject to repo transactions with external counterparties for market funding purposes for the Group.
Drawing on its experience in treasury securitizations, the Group has also developed transactions aimed at providing refinancing. The securitizations can use residential real estate receivables, equipment loans, personal loans, etc. These transactions can be STS-certified, rated by agencies, reloadable or not, etc. The receivables/loans are contributed to the securitized mutual fund (Fond commun de titrisation - FCT) in two ways: either as direct sales to the FCT, or as collateralization of loans sold to the FCT. These transactions are placed on the market or with a limited number of investors.
They constitute the secured portion of the Group’s funding plan, excluding covered bonds, which amounted to €8.4 billion in 2025 (including repo transactions on securitizations on treasury shares).
Participating
institutionsAmounts issued per transaction Assigned /
collateralized
receivables/
AssetsTransaction name
(FCT)Label
STS
Y/NTreasury
shares/
RefinancingType of
receivables/
AssetsLaunch
dateReloa
dable
Y/NDisposal /
CollateralizationCE BP BPCE &
subsidiariesSenior
in millions of
eurosSubordinate
in millions of
eurosResidual
units
in €in millions of
eurosBPCE Master Home Loans FCT N Treasury shares Residential
real estateMay 2014 Y Disposal 15 12 - 88,200 5,630 10,200 93,828 BPCE CONSUMER LOANS FCT 2016 Y Treasury shares Personal
loansMay 2016 Y Disposal 15 11 - 3,325 831 16,000 4,154 BPCE HOME LOANS FCT 2017 N Treasury shares Residential
real estateMay 2017 N Disposal 15 11 - 2,327 330 14,000 2,657 BPCE DEMETER UNO FCT N Refinancing Personal
loansApril 2023 Y Collateralizati on 14 1 - 1,250 220 2,250 1,471 BPCE DEMETER DUO FCT Y Refinancing Personal
loansFeb. 2021 Y Collateralizati on 4 - - 400 71 600 541 BPCE DEMETER TRIA FCT Y Refinancing Personal
loansJuly 2021 Y Collateralizati on 3 7 - 750 243 1,500 994 BPCE HOME LOANS FCT 2021 Green UoP Y Refinancing Residential
real estateOct. 2021 N Disposal 15 11 - 884 120 13,000 1,004 BPCE CONSUMER LOANS FCT 2022 Y Refinancing Personal
loansJuly 2022 Y Disposal 15 11 - 1,000 220 13,000 1,221 BPCE ELIOS I FCT N Refinancing Equipment
loansDec. 2022 Y Collateralizati on 1 - - 400 133 300 542 BPCE HOME LOANS FCT 2023 Y Refinancing Residential
real estateOct. 2023 N Disposal 15 12 - 710 68 13,500 778 BPCE MERCURE MASTER SME FCT N Treasury shares Equipment
loansNov. 2023 Y Disposal 15 12 - 13,500 5,383 4,050 18,879 BPCE DEMETER TETRA FCT Y Refinancing Personal
loansMarch 2024 Y Collateralizati on 15 10 - 900 300 7,500 1,202 BPCE CONSUMER LOANS FCT 2024 Y Refinancing Personal
loansMay 2024 Y Disposal 15 11 - 636 143 13,000 893 BPCE OPHELIA MASTER SME FCT Y Refinancing Equipment
loansJuly 2024 Y Disposal 15 12 - 2,100 858 4,050 2,955 BPCE HOME LOANS FCT 2024 Green UoP Y Refinancing Residential
real estateOct. 2024 N Disposal 15 12 - 681 53 13,500 733 BPCE DEMETER PANTA FCT Y Refinancing Personal
loansApril 2025 Y Collateralizati on 12 10 - 1,300 433 3,300 1,739 BPCE Olympia Master Home Loans Y Refinancing Residential
real estateOct. 2025 Y Disposal 15 12 - 650 49 4,050 696 PORTDALON ABCP Conduit N Refinancing Multi-Sellers
/ MixedApril 2025 Y ABCP conduit - - 1 1,291 - - 1,291 FCT PURPLE MASTER CREDIT CARDS N Refinancing Credit Cards April 2025 Y Disposal - - 1 600 99 300 692 GAÏA MASTER Consumer Loans N Refinancing Personal
loansNov. 2025 Y Collateralizati on 12 5 - 484 85 2,550 570 BRED Banque Populaire regularly securitizes its advances. The securities issued are kept on the balance sheet to strengthen its mobilization capacities at the ECB. The underlying advances are generally home loans and occasionally equipment or professional loans. The stock of eligible securities depends on the rate of securitization. The objective for the bank is not to transfer credit risk but to improve its liquidity.
- the constitution of the pool of advances is determined by the Finance division under the supervision of the project manager. A detailed analysis of the composition of the deposit is carried out;
- the pool of advances is passed through the centralized IT filter;
- the deposit is systematically analyzed in great detail by two rating agencies (S&P and Fitch Ratings in general).
For information, in 2025 BRED Banque Populaire carried out an STS securitization transaction of a portfolio of residential real estate loans, for a value of nearly €1.85 billion:
- the shares are held in treasury and therefore have no accounting impact in the consolidated financial statements;
- the program has a dual purpose: to strengthen the purchasing power at the ECB and to generate LCR via securities exchanges.
At the end of 2025, BRED had seven outstanding ELIDE programs, the details of which are given below:
Participating
institutionsAmounts subscribed by the ETB Creation name Treasury
shares /
RefinancingType of
receivablesLaunch date Reload
able Y/NDisposal /
CollateralizationCE BP Senior
in millions of
eurosSubordinate
in millions of
eurosResidual
units in €Initial
assigned/
collateralized
receivablesAssigned/
collateralized
receivables in
DARELIDE 2017-01 Treasury shares Residential real estate 02/02/2017 N Disposal - 1 €1,722.5 million ELIDE 2017-02 Treasury shares Residential real estate 04/27/2017 N Disposal - 1 956 76.1 300 1,050.6 252.9 ELIDE 2018-01 Treasury shares Residential real estate 05/29/2018 N Disposal - 1 1,167.3 198 300 1,389.0 495.6 ELIDE 2021-01 Treasury shares Residential real estate 03/25/2021 N Disposal - 1 2,584.3 312.4 300 2,920.1 1,801.5 ELIDE 2022-01 Treasury shares Residential real estate 11/24/2022 N Disposal - 1 2,260 230.0 300 2,500.0 1,954.1 ELIDE 2024-01 Treasury shares Residential real estate 05/23/2024 N Disposal - 1 1,870 122.0 300 2,000.0 1,718.0 ELIDE 2025-01 Treasury shares Residential real estate 07/23/2024 N Disposal - 1 1,739 111.0 300 1,850 1,774.6 The breakdown by currency of unsecured issues excluding completed structured private placements is a good indicator of the diversification of the Group’s medium-and long-term funding sources. In all, 63% (compared to 56% in 2024) of these issues were made in currencies other than the euro in 2025; the five largest currencies were the United States dollar (39%), the Japanese yen (7%), the British pound sterling (7%), the Australian dollar (6%) and the Swiss franc (2%).
The average maturity at issuance (including ABS) for Groupe BPCE as a whole was 6.3 years in 2025, compared with an average maturity of 6.4 years in 2024.
The vast majority of medium- and long-term funding raised in 2025 was at a fixed rate, as in previous years. In general, fixed rate is swapped into floating rate in accordance with the Group’s interest rate risk management policy.
Groupe BPCE, as a recurring and innovative issuer in the sustainable issuance market (issues complying with the green bond and social bond principles of the International Capital Market Association - ICMA), carried out four public, green and social issues in 2025 for €2,683 million:
- AU$500 million 15NC10 Tier-2 LED social Economic and Local Development;
- Green Building covered bonds issued by BPCE SFH for €1,000 million over 10 years;
- €1,000 million 8NC7 SNP social (Health);
- €400 million 10-year Tier-2 green building issued by BPCE Assurances.
In addition to these five transactions, Natixis issued €1,900 million in ESG Structured Private Placements in 2025.
Furthermore, in 2025, Groupe BPCE issued another form of thematic bond: a defense bond issued in August 2025 for the (re)financing of assets in the Defense sector for an amount of €750 million. This issue received the “Defence Bond” label from Euronext. This issue is neither green, nor social, but it borrows best practices from the ICMA principles, namely the use of funds, the asset evaluation and selection process, the traceability of funds and the compilation of reports.
The creation of the ESF Financial Issues and Solutions department at the end of 2023 (created to centralize all players involved in MLT Funding in the same team) took on its full meaning in 2025; it has enabled Groupe BPCE to optimize its scarce resources, such as liquidity, collateral and solvency.
-
9.4 Management of structural interest rate risk
Structural interest rate risk (or overall interest rate risk) is defined as the risk of loss in value on the balance sheet in the event of a change in interest rates due to all balance sheet and off-balance sheet transactions, except for – if applicable – transactions subject to market risks. Structural interest rate risk is an intrinsic component of the business and profitability of credit institutions.
The objective of the Group’s interest rate risk management framework is to monitor each institution’s maturity transformation level in order to contribute to the growth of the Group and the business lines while evening out the impact of any unfavorable interest rate changes on the value of the Group’s banking books and future income.
Structural interest rate risk is controlled by a system of indicators and limits set by the Group Asset/Liability Management Committee. It measures structural interest rate risk on the balance sheet, excluding any kind of independent risk (trading, own accounts, etc.). The indicators used are divided into two approaches: a static approach that only takes into account on-balance sheet and off-balance sheet positions at a set date and a dynamic approach which includes commercial and financial forecasts. They can be classified into two sets:
- gap indicators, which compare the amount of the liability exposures against the asset exposures on the same interest rate index and over different maturities. These indicators are used to validate the main balance sheet aggregates to ensure the sustainability of the financial results achieved. Gaps are calculated on the basis of contractual maturities, the results of common behavioral models for different credit or collection products, outflow agreements for products with no maturity date, and specific agreements for regulated rates;
- sensitivity indicators, both in terms of value and revenues. The value-based indicator, known as SOT EVE (SOT: Supervisory Outlier Test; EVE: economic value of equity), measures the change in the net present value of equity under different scenarios of changes in the yield curve (parallel translation of the yield curve, flattening, steepening, etc.). The revenue-based indicators measure the sensitivity of the projected revenue where there are differences between the change in the market interest rate and a central scenario. They consist of a regulatory indicator, the SOT NIM, and an internal indicator. The SOT NIM, implemented in 2024, measures the change in revenues over the next twelve months in the event of a shift in the yield curves upwards or downwards relative to the forward rate under a constant balance sheet assumption. The internal indicator measures the change in the NIM over a multi-year horizon using a multi-scenario approach that takes into account business forecasts (new activity and changes in customer behavior) and uncertainties related to these forecasts and possible changes in the commercial margin.
Internal stress tests are carried out periodically to measure changes in the bank’s earnings trajectory in adverse scenarios. The interest rate position of the Group’s institutions is managed in compliance with the Group’s standards, which formalize both the indicators monitored and the associated limits, as well as the instruments authorized for hedging interest rate risk. These are strictly “vanilla” (unstructured), option sales are excluded and accounting methods with no impact on the Group’s consolidated income are preferred.
The interest rate position is mainly driven by Retail Banking and Insurance, and primarily by the networks. Measured using a static approach to interest rate gaps, it shows a structural risk exposure to an increase in interest rates with a surplus of fixed-rate assets compared to fixed-rate resources. This structural surplus is due in particular to the percentage of customer deposits at regulated or similar rates (in particular the Livret A rate).
The interest rate gap at the end of December 2025, presented below, narrowed over one year compared to December 2024 (+€15.9 billion). This improvement in the interest rate gap was mainly due to the Commercial Banking networks, with a greater increase in fixed-rate borrower hedging swaps than in fixed-rate lending hedging swaps. It is also accentuated by the decrease in the networks’ customer gap, linked to the increase in sight deposits, term resources and specialized refinancing.
It should be noted that the significant decrease in regulated passbook savings accounts due to the methodological change (decrease in the share of fixed interest rates) contributes to the deterioration of the gap, but this does not offset the overall improvement observed in the Group interest rate gap.
Beyond one year, the interest rate gap deteriorates (-€0.7 billion over two to four years and -€5.6 billion over five to eight years). The beneficial effects mentioned above disappear gradually and do not make it possible to mitigate the significant decline in Commercial Banks’ passbook savings accounts. The degradation of the interest rate gap is reinforced by higher outstanding home loans due notably to a lower anticipated repurchases compared to December 2024. BPCE SA also contributed to this negative change in the interest rate gap, particularly over the two- to four-year horizon, with a degradation in the cash gap explained by an increase in fixed-rate interbank loans and a decrease in issues.
in millions of euros 01/01/2026 to 12/31/2026 01/01/2027 to 12/31/2029 01/01/2030 to 12/31/2033 Interest rate gap (fixed-rate*) (9,756) (32,765) (58,211) - * The indicator takes into account all asset and liability positions and floating-rate positions until the next interest rate reset date.
The sensitivity of the net present value of the Group’s balance sheet to a +/-200 bps variation in interest rates remained lower than the 15% Tier-1 limit. At December 31, 2025, Groupe BPCE’s sensitivity to interest rate increases stood at -11.29% compared to Tier-1 versus -9.62% at December 31, 2024. This indicator, calculated according to a static approach (contractual or conventional flow of all balance sheet items) and in a stress scenario (immediate and significant interest rate shock), makes it possible to highlight the distortion of the balance sheet over a long horizon.
To better control the Group’s exposure to interest rate risk, it must be supplemented by a dynamic approach (including new production forecasts). This is achieved by measuring the change in the Group’s forecast net interest margin at one year according to four scenarios (rise in rates, decline in rates, steepening of the yield curve, flattening of the yield curve) compared to the core scenario.
These net interest margin sensitivity indicators cover all commercial banking activities and aim to estimate the sensitivity of the institutions’ results to interest rate fluctuations. Following regulatory changes and modifications of its management system, since 2023 Groupe BPCE has deployed an internal revenue sensitivity indicator on the commercial banking networks and the Supervisory Outlier Test (SOT) Net Interest Margin (NIM) regulatory indicator at Group level, in addition to its internal indicators. The dynamic approach in terms of the sensitivity of future revenues is reinforced by a multi-scenario vision, which allows a broader approach by taking into account the uncertainties related to business forecasts (new activity and changes in customer behavior) and possible changes in commercial margin.
At December 31, 2025, the most penalizing scenario for the Group in terms of the SOT NIM was the downside scenario. The indicator stands at -1.27% and remains below the 5% limit compared to Tier 1.
a b c d Changes of the economic value of equity Changes of the net interest income Supervisory shock scenarios 12/31/2025 12/31/2024 12/31/2025 12/31/2024 1 Parallel up (11.29%) (9.62%) 0.19% 0.22% 2 Parallel down (3.69%) (5.80%) (1.27%) (1.19%) 3 Steepener (5.72%) (4.97%) 4 Flattener 2.13% 0.92% 5 Short rates up 0.39% 0.40% 6 Short rates down (0.40%) (0.13%) -
9.5 Management of structural foreign exchange risk
Structural foreign exchange risk is defined as the risk of a realized or unrealized loss due to an unfavorable fluctuation in foreign currency exchange rates. The management system distinguishes between the structural exchange risk policy and the management of operational foreign exchange risk.
For Groupe BPCE (excluding Natixis), the foreign exchange risk is monitored using regulatory indicators (measuring the corresponding capital adequacy requirements by entity). The residual foreign exchange positions held by the Group (excluding Natixis) are not material because virtually all foreign currency assets and liabilities are match-funded in the same currency.
As regards international trade financing transactions, risk-taking is limited to counterparties in countries with freely-translatable currencies, provided that translation can be technically carried out by the technically managed by the entity’s information system.
Natixis’ structural exchange rate positions on net investments in foreign operations funded with currency forwards are tracked on a quarterly basis by its Asset/Liability Management Committee in terms of sensitivity as well as solvency. The resulting risk indicators are submitted to the Group Asset/Liability Management Committee on a quarterly basis.
-
9.6 Detailed quantitative information on liquidity risk
The detailed quantitative disclosures on liquidity risk in the following tables enhance the information in the previous section under Pillar III.
The cash balance sheet of Groupe BPCE shows the main items of the balance sheet by identifying in particular:
- the business financing needs (customer loans, centralization of regulated passbook savings accounts and the Group’s tangible and intangible assets) for a total of €1,008 billion at December 31, 2025, up by €30 billion year-on-year mainly due to the increase in loan outstandings (equipment and other);
- the Group’s stable resources, consisting of customer deposits, medium- and long-term resources and equity and similar, for a total of €1,149 billion at December 31, 2025, up by €60 billion year-on-year mainly linked to the increase in customer deposits (sight and term resources and network loans made by Natixis);
- the €141 billion surplus reflects the surplus of customer deposits and medium-and long-term financial resources over the financing needs of the customer business. It is mainly invested in liquid assets to contribute to the liquidity reserve;
- the short-term resources invested mainly in liquid assets (central bank deposits, interbank assets, debt securities).
- (1) Stable resources balance of €141 billion at December 31, 2025 = MLT resources of €255 billion + customer resources of €804 billion + equity of €89 billion + miscellaneous €1 billion - customer loans of €884 billion - centralization of regulated passbook savings accounts of €106 billion + property, plant and equipment and intangible assets of €19 billion.
- (2) Including financing of Group SPT customer loans by SCF.
- (3) Of which €34 billion excluding accrued interest from market MLT resources with a residual maturity of one year or less.
The regulatory 30-day liquidity ratio measures the ratio between the liquidity buffer (high-quality liquid assets - HQLA) and the expected net cash outflows over a 30-day period. Since January 1, 2018, the minimum requirement level has been 100%.
The Group’s LCR stood at an average monthly rate of 145.1% in December 2025, i.e. a liquidity surplus of €62.9 billion, compared with levels of 149.3% and €68.1 billion, respectively, in December 2024.
a b c d e f g h in millions of euros Total unweighted value (average) Total weighted value (average) EU 1a Quarter ending on (MM/DD/YYYY) 12/31/2025 09/30/2025 06/30/2025 03/31/2025 12/31/2025 09/30/2025 06/30/2025 03/31/2025 EU 1b Number of data points used in the calculation of averages 12 12 12 12 12 12 12 12 HIGH-QUALITY LIQUID ASSETS 1 Total high-quality liquid assets (HQLA), after application of haircuts in line with Article 9 of regulation (EU) 2015/61 203,374 200,876 201,384 205,495 CASH - OUTFLOWS 2 retail deposits and deposits from small business customers, of which: 407,991 399,293 391,078 383,133 20,954 20,916 20,865 20,808 3 Stable deposits 274,894 276,050 277,390 278,734 13,745 13,802 13,869 13,937 4 Less stable deposits 69,139 68,111 67,351 66,690 7,204 7,106 6,986 6,862 5 Unsecured wholesale funding 208,960 205,513 202,322 199,639 105,566 105,196 103,754 102,653 6 Operational deposits (all counterparties) and deposits in networks of cooperative banks 45,906 45,638 45,932 46,651 10,456 10,393 10,471 10,655 7 Non-operational deposits (all counterparties) 145,734 141,336 138,048 134,089 77,790 76,264 74,942 73,099 8 Unsecured debt 17,320 18,539 18,341 18,899 17,319 18,539 18,341 18,899 9 Secured wholesale funding 25,580 26,256 27,117 28,033 10 Additional requirements 115,271 114,335 113,698 113,541 30,540 29,924 29,669 29,802 11 Outflows related to derivative exposures and other collateral requirements 11,891 11,718 11,546 11,324 10,878 10,575 10,417 10,191 12 Outflows related to loss of funding on debt products 0 0 0 0 0 0 0 0 13 Credit and liquidity facilities 103,379 102,617 102,152 102,216 19,663 19,349 19,252 19,611 14 Other contractual funding obligations 51,845 50,807 49,514 47,715 51,213 50,244 48,961 47,211 15 Other contingent funding obligations 154,321 154,186 151,136 143,471 10,534 10,426 10,316 10,377 16 TOTAL CASH OUTFLOWS 244,388 242,962 240,683 238,883 CASH - INFLOWS 17 Secured lending (e.g. reverse repos) 125,049 126,398 129,335 127,834 19,607 20,484 21,515 21,924 18 Inflows from fully performing exposures 39,679 37,587 36,171 34,057 29,298 28,071 27,512 26,241 19 Other cash inflows 69,078 70,305 68,366 65,565 55,019 56,611 55,050 52,784 EU-19a (Difference between total weighted inflows and total weighted outflows arising from transactions in third countries where there are transfer restrictions or which are denominated in non-convertible currencies) 0 0 0 0 EU-19b (Excess inflows from a related specialised credit institution) 0 0 0 0 20 TOTAL CASH INFLOWS 233,806 234,291 233,872 227,456 103,924 105,165 104,076 100,949 EU-20a Fully exempt inflows 0 0 0 0 0 0 0 0 EU-20b Inflows subject to 90% cap 0 0 0 0 0 0 0 0 EU-20c Inflows subject to 75% cap 199,663 199,454 198,905 193,409 103,924 105,165 104,076 100,949 TOTAL ADJUSTED VALUE 21 TOTAL HQLA 203,374 200,876 201,384 205,495 22 TOTAL NET CASH OUTFLOWS 140,464 137,797 136,607 137,934 23 LIQUIDITY COVERAGE RATIO 145% 146% 148% 149% The Group’s liquid assets, after taking into account regulatory haircuts, amounted to €203.4 billion and consisted largely of central bank deposits and sovereign securities.
The gross cash outflows amounted to €244.4 billion. The increase observed over 2025 mainly concerns deposits from companies and financial institutions and other contractual cash outflows. On the other hand, the gross cash inflows amounted to €104 billion and increased in 2025. In net position, the cash outflows thus amounted to €140.5 billion, an increase of €2 billion between December 2024 and December 2025.
The liquid asset position is managed in such a way as to retain a sufficient amount of excess liquidity to cover any volatility in the evolution of the LCR ratio and also to protect the Group against a short-term liquidity crisis that may prevent the Group from renewing all or part of its short-term issues. In this context, the excess liquidity will be absorbed first without impacting the Group’s core activities.
The net stable funding ratio (NSFR) corresponds to the amount of available stable funding (i.e. own funds and the proportion of liabilities assumed to be reliable over the time horizon taken into account for the purposes of the NSFR, i.e. up to one year) compared to the required stable funding. This ratio is restrictive, with a minimum requirement level of 100% since June 28, 2021.
EU LIQ2 – Net stable funding ratio (NSFR)
12/31/2025 a b c d e Unweighted value by residual maturity in millions of euros No maturity < 6 months 6 months to
< 1 yr≥ 1 yr Weighted
valueAVAILABLE STABLE FUNDING (ASF) ITEMS 1 Capital items and instruments 87,399 0 0 13,873 101,273 2 Own funds 87,399 0 0 13,873 101,273 3 Other capital instruments 0 0 0 0 4 Retail deposits 379,578 1,443 48,701 406,147 5 Stable deposits 290,334 211 13,378 289,395 6 Less stable deposits 89,244 1,232 35,323 116,752 7 Wholesale funding: 506,934 50,417 243,199 391,587 8 Operational deposits 47,159 0 0 23,580 9 Other wholesale funding 459,775 50,417 243,199 368,008 10 Interdependent liabilities 6,136 0 99,331 0 11 Other liabilities: 0 28,405 5,068 39,975 42,509 12 NSFR derivative liabilities 0 13 All other liabilities and capital instruments not included in the above categories 28,405 5,068 39,975 42,509 14 Total available stable funding (ASF) 941,516 REQUIRED STABLE FUNDING (RSF) ITEMS 15 Total high-quality liquid assets (HQLA) 20,988 EU-15a Assets encumbered for a residual maturity of one year or more in a cover pool 2,779 2,719 113,692 101,312 16 Deposits held at other financial institutions for operational purposes 391 0 0 195 17 Performing loans and securities: 162,589 60,448 712,706 626,931 18 Performing securities financing transactions with financial customers collateralised by Level 1 HQLA subject to 0% haircut 25,669 2,547 2,608 3,968 19 Performing securities financing transactions with financial customer collateralised by other assets and loans and advances to financial institutions 52,505 7,755 33,180 40,881 20 Performing loans to non-financial corporate clients, loans to retail and small business customers, and loans to sovereigns, and PSEs, of which: 53,897 36,892 400,852 537,015 21 With a risk weight of less than or equal to 35% under the Basel II Standardised Approach for credit risk 8,021 6,140 118,121 255,722 22 Performing residential mortgages, of which: 13,584 11,561 227,216 0 23 With a risk weight of less than or equal to 35% under the Basel II Standardised Approach for credit risk 13,527 11,539 226,853 0 24 Other loans and securities that are not in default and do not qualify as HQLA, including exchange-traded equities and trade finance on-balance sheet products 17,034 1,876 51,025 47,156 25 Interdependent assets 6,136 0 99,331 0 26 Other assets: 48,003 90 88,168 91,947 27 Physical traded commodities 0 0 28 Assets posted as initial margin for derivative contracts and contributions to default funds of CCPs 146 0 8,803 7,607 29 NSFR derivative assets 2,819 2,819 30 NSFR derivative liabilities before deduction of variation margin posted 36,058 1,803 31 All other assets not included in the above categories 8,981 90 79,364 79,719 32 Off-balance sheet items 323,784 108 38,051 18,227 33 Total RSF 859,599 34 Net Stable Funding Ratio (%) 109.53% 12/31/2024 a b c d e Unweighted value by residual maturity in millions of euros No maturity < 6 months 6 months to
< 1 yr≥ 1 yr Weighted
valueAVAILABLE STABLE FUNDING (ASF) ITEMS 1 Capital items and instruments 84,040 0 0 13,934 97,974 2 Own funds 84,040 0 0 13,934 97,974 3 Other capital instruments 0 0 0 0 4 Retail deposits 391,764 806 27,278 395,782 5 Stable deposits 303,418 396 513 289,136 6 Less stable deposits 88,347 411 26,765 106,647 7 Wholesale funding: 497,870 43,970 220,284 352,014 8 Operational deposits 48,509 0 0 2,258 9 Other wholesale funding 449,361 43,970 220,284 349,757 10 Interdependent liabilities 6,201 0 96,287 0 11 Other liabilities: 0 38,857 280 39,321 39,462 12 NSFR derivative liabilities 0 13 All other liabilities and capital instruments not included in the above categories 38,857 280 39,321 39,462 14 Total available stable funding (ASF) 885,232 REQUIRED STABLE FUNDING (RSF) ITEMS 15 Total high-quality liquid assets (HQLA) 22,036 EU-15a Assets encumbered for a residual maturity of one year or more in a cover pool 1,825 2,020 44,495 41,090 16 Deposits held at other financial institutions for operational purposes 402 0 0 201 17 Performing loans and securities: 157,385 56,154 752,561 661,942 18 Performing securities financing transactions with financial customers collateralised by Level 1 HQLA subject to 0% haircut 22,310 1,758 2,363 3,533 19 Performing securities financing transactions with financial customer collateralised by other assets and loans and advances to financial institutions 58,692 8,301 27,486 36,303 20 Performing loans to non-financial corporate clients, loans to retail and small business customers, and loans to sovereigns, and PSEs, of which: 50,690 33,717 446,119 585,943 21 With a risk weight of less than or equal to 35% under the Basel II Standardised Approach for credit risk 8,052 7,092 178,218 321,715 22 Performing residential mortgages, of which: 13,437 11,503 236,915 0 23 With a risk weight of less than or equal to 35% under the Basel II Standardised Approach for credit risk 13,428 11,492 236,764 0 24 Other loans and securities that are not in default and do not qualify as HQLA, including exchange-traded equities and trade finance on-balance sheet products 12,321 936 42,055 38,291 25 Interdependent assets 6,201 0 96,287 0 26 Other assets: 52,136 202 79,270 83,347 27 Physical traded commodities 0 0 28 Assets posted as initial margin for derivative contracts and contributions to default funds of CCPs 146 0 8,545 7,388 29 NSFR derivative assets 3,450 3,450 30 NSFR derivative liabilities before deduction of variation margin posted 33,217 1,661 31 All other assets not included in the above categories 15,324 202 70,725 70,849 32 Off-balance sheet items 319,115 0 34,734 17,087 33 Total RSF 825,703 34 Net Stable Funding Ratio (%) 107.21% Over the course of 2025, the NSFR surpluses increased by €22.4 billion, mainly due to the greater increase in stable resources (available stable funding - ASF) (+€56 billion) than the increase in needs (required stable funding - RSF) (+€33 billion).
This clear improvement in the NSFR surplus was driven by the increase in inflows from individual customers to regional banks (+€2.5 billion) and by the collection of deposits from non-financial customers excluding individual customers and the centralization of deposits (+€20.5 billion).
At the same time, the increase in long market resources and the improvement in the management of loans encumbered by the Covered SCF and SFH issues more than offset the new NSFR requirements related to the acquisition of Société Générale Equipment Finance (BPCE ES) in 2025.
The amount of the available stable funding for Groupe BPCE amounted to €942 billion and mainly consisted of:
- customer deposits (€406 billion), including a significant portion of deposits deemed stable, and increasing since June 2025 reflecting the high levels of savings recorded over the period; and
- wholesale funding (€392 billion), including corporate deposits, which were up compared to June 2025.
The amount of required stable funding stood at €860 billion, the result of a significant level of performing loans and securities whose impact was €627 billion, a decrease compared to June 2025.
EU AE1 – Encumbered and unencumbered assets
12/31/2025 Carrying amount of encumbered
assetsFair value of encumbered
assetsCarrying amount of
unencumbered assetsFair value of unencumbered
assetsof which
notionally
eligible EHQLA
and HQLAof which
notionally
eligible EHQLA
and HQLAof which
EHQLA and
HQLAof which
EHQLA and
HQLAin millions of euros 10 30 40 50 60 80 90 100 010 Assets of the reporting institution 283,771 92,117 - - 1,205,480 37,558 - - 030 Equity instruments 29,824 25,463 29,824 25,463 23,420 9,016 17,820 9,333 040 Debt securities 93,932 67,979 92,823 68,513 30,150 30,138 38,178 35,108 050 of which: covered bonds 681 - 639 - 2,630 2,630 2,622 2,622 060 of which: securitisations 15,774 - 14,786 - - - - - 070 of which: issued by general governments 57,193 56,892 58,145 57,517 24,106 21,747 22,776 22,731 080 of which: issued by financial corporations 13,659 9,356 13,158 9,356 17,269 5,694 6,188 5,621 090 of which: issued by non-financial corporations 4,609 2,177 4,488 2,178 5,046 3,795 5,820 3,734 120 Other assets 159,548 - - - 1,152,559 - - - 12/31/2024 Carrying amount of
encumbered assetsFair value of encumbered
assetsCarrying amount of
unencumbered assetsFair value of unencumbered
assetsof which
notionally
eligible EHQLA
and HQLAof which
notionally
eligible EHQLA
and HQLAof which
EHQLA and
HQLAof which
EHQLA and
HQLAin millions of euros 10 30 40 50 60 80 90 100 010 Assets of the reporting institution 253,116 85,131 1,187,470 40,483 030 Equity instruments 27,101 24,876 27,101 24,876 26,956 11,790 21,657 11,719 040 Debt securities 77,497 60,478 76,958 60,469 30,333 28,853 35,739 30,265 050 of which: covered bonds 7 2 7 2 2,614 2,537 2,684 2,504 060 of which: securitisations 10,666 - 10,137 - - - - - 070 of which: issued by general governments 50,333 49,611 50,324 49,603 19,265 19,265 17,725 17,363 080 of which: issued by financial corporations 12,653 8,066 12,653 8,066 8,975 6,573 8,634 6,383 090 of which: issued by non-financial corporations 2,965 2,182 2,963 2,181 - - 6,054 3,663 120 Other assets 149,607 - 1,130,823 - EU AE2 – Collateral received and own debt securities issued
12/31/2025 Unencumbered Fair value of encumbered collateral
received or own debt securities issuedFair value of collateral received or own
debt securities issued available for
encumbranceof which notionally
eligible EHQLA
and HQLAof which EHQLA
and HQLAin millions of euros 010 030 040 060 130 Collateral received by the disclosing institution 172,228 145,085 120,251 63,272 140 Loans on demand - - - - 150 Equity instruments 34,963 24,337 21,122 9,177 160 Debt securities 137,606 120,837 60,179 53,400 170 of which: covered bonds 434 - 1,722 1,687 180 of which: securitisations 893 - - - 190 of which: issued by general governments 102,476 101,013 39,307 38,974 200 of which: issued by financial corporations 30,296 19,493 14,001 11,421 210 of which: issued by non-financial corporations 3,798 1,049 5,040 1,754 220 Loans and advances other than loans on demand - - 38,343 - 230 Other collateral received - - - - 240 Own debt securities issued other than own covered bonds or securitisations - - - - 241 Own covered bonds and asset-backed securities issued and not yet pledged - - 6,642 - 250 TOTAL COLLATERAL RECEIVED AND OWN DEBT SECURITIES ISSUED 456,695 239,859 - - 12/31/2024 Unencumbered Fair value of encumbered collateral
received or own debt securities issuedFair value of collateral received or own
debt securities issued available for
encumbranceof which notionally
eligible EHQLA and
HQLAof which EHQLA
and HQLAin millions of euros 010 030 040 060 130 Collateral received by the disclosing institution 159,296 134,646 116,840 59,786 140 Loans on demand - - - - 150 Equity instruments 29,585 16,715 24,921 8,300 160 Debt securities 127,845 116,291 60,751 51,271 170 of which: covered bonds 4 1 1,492 1,492 180 of which: securitisations 13 - - - 190 of which: issued by general governments 98,583 97,867 34,616 34,195 200 of which: issued by financial corporations 25,051 16,156 17,365 13,607 210 of which: issued by non-financial corporations 3,431 1,224 7,278 2,026 220 Loans and advances other than loans on demand - - 33,286 - 230 Other collateral received - - - - 240 Own debt securities issued other than own covered bonds or securitisations - - - - 241 Own covered bonds and asset-backed securities issued and not yet pledged - - - - 250 TOTAL ASSETS, COLLATERAL RECEIVED AND OWN DEBT SECURITIES ISSUED 411,302 219,777 - - EU AE3 – Sources of encumbrance
12/31/2025 Matching liabilities,
contingent liabilities or
securities lentAssets, collateral received
and own debt securities
issued other than covered
bonds and securitizations
encumberedin millions of euros 010 030 010 Carrying amount of selected financial liabilities 243,710 295,696 An asset or a guarantee is encumbered when it is capitalized as a guarantee, collateral or enhancement of a transaction, and becomes capitalized as a result.
-
assets transferred to the Central Bank but not mobilized,
-
assets underlying self-owned securitizations.
Groupe BPCE pledges its assets and collateral in order to benefit from advantageous refinancing conditions and to carry out repurchase agreements and derivatives.
At December 31, 2025, Groupe BPCE’s encumbered assets ratio was 24.6% compared to 25.8% at December 31, 2024.
Groupe BPCE’s encumbered assets and collateral amounted to €440.4 billion and mainly consisted of loans and advances and securities issued.
-
€108.9 billion in loans and advances to guarantee the covered bonds issued by BPCE SFH, SCF and Natixis Pfandbriefbank. The over-collateralization rates applied are respectively 105% for BPCE SFH and SCF and 102% for Natixis Pfandbriefbank;
-
10.1 Legal and arbitration proceedings
On October 9, 2015, a company operating in the meal voucher industry lodged a complaint with the French Competition Authority (Autorité de la concurrence) to contest industry practices with respect to the issuance and acceptance of meal vouchers. The complaint targeted several French companies operating in the meal voucher industry, including Natixis Intertitres, which became Bimpli at the end of 2022.
In its decision of December 17, 2019, the French Competition Authority ruled that Natixis Intertitres had participated in a practice covering the exchange of information and a practice designed to keep new entrants out of the meal voucher market.
Natixis Intertitres was fined €4,360,000 in its own right, along with two other fines totaling €78,962,000, jointly and severally with Natixis who was its parent company.
Since the alliance concluded between Groupe BPCE and Swile on December 14, 2022, Bimpli has been owned by a third party outside the Group.
The Paris Court of Appeal confirmed the decision of the French Competition Authority by a judgment delivered on November 16, 2023.
Bimpli and Natixis filed an appeal against this decision on December 20, 2023, along with other French companies in the meal voucher sector.
As part of the examination of this appeal, the Versailles Court of Appeal, by a judgment dated January 28, 2025, rejected the judgment of the Paris Court of Appeal of November 16, 2023. Drawing the consequences of this decision, on October 28, 2025, the Court of Cassation annulled the judgment of the Paris Court of Appeal and referred the case back to the latter with a differently constituted bench.
Between November 2024 and July 2025, Swile (which became BIMPLI on January 1, 2024 following a merger-acquisition transaction) and Natixis were summoned – alongside other players in the meal voucher market – before the Paris Economic Activities Court, by several plaintiffs wanting to obtain compensation for the alleged damages caused by the practices sanctioned by the Competition Authority, including those of Natixis Intertitres.
At this stage, and subject to the legal appraisals requested by the plaintiffs, the total amount of the sums requested is €830,457,122, in addition to €2,475,000 for appraisal costs and €4,160,000 in respect of Article 700 of the French Code of Civil Procedure. All these proceedings are currently pending before the Paris Economic Activities Court.
Although the Group still considers that it has serious arguments to contest these decisions, a provision was made in the Group’s financial statements in 2023, in the amount of the estimated risk.
At the end of December 2023, 6,077 individuals and legal entities, members of an association called “Collectif Porteurs H2O” brought proceedings against the French company Natixis Investment Managers before the Paris Commercial Court, alongside five defendants, to obtain compensation for damage they suffered as investors in seven mutual funds (UCITS) managed by the English entity H2O AM LLP, then the French entity H2O AM Europe, between 2015 and 2021.
Together, the plaintiffs seek a joint sanction against Natixis Investment Managers, Natixis SA, BPCE and the other defendants, including the managers, custodian and auditor of the seven funds, to compensate for their alleged damages. Given the ever-changing number of plaintiffs and the fact that plaintiffs do not update the amount of their applications, the amount claimed cannot be precisely determined to date. On the basis of the information provided by the plaintiffs, the amount of the claims can be estimated to date at approximately €600 million in respect of the financial and moral damages alleged, in addition to legal costs.
In July 2025, Natixis SA, Natixis Investment Managers and BPCE were served third-party notice to the proceedings initiated in early July 2023 by 26 holders of H2O funds before the Paris Economic Court.
-
10.2 Legal and arbitration proceedings specific to Natixis
Like many banking groups, Natixis and its consolidated subsidiaries are subject to legal and tax proceedings and investigations by the supervisory authorities.
The financial consequences, assessed as of December 31, 2025, of those likely to have, or which have had in the recent past, a significant impact on the financial position of Natixis and/or Natixis and its consolidated subsidiaries taken as a whole, their profitability or activity, have been included in Natixis’ consolidated financial statements.
The most significant legal and arbitration proceedings are described below, it being specified that their inclusion in the list below does not mean that these proceedings will necessarily have any impact on Natixis and/or its consolidated subsidiaries. Other proceedings, including tax proceedings, have no significant impact on the financial position or profitability of Natixis and/or Natixis and its consolidated subsidiaries taken as a whole, or are not at a sufficiently advanced stage to determine whether they are likely to have such an impact.
The Madoff outstanding amount was estimated at €306 million in exchange value at December 31, 2025, fully provisioned at that date, compared to €347.8 million at December 31, 2024. The effective impact of this exposure will depend on both the extent of recovery that Natixis benefits from and the outcome of the measures taken by the bank, notably in terms of legal proceedings. Furthermore, in 2011 a dispute emerged over the application of the insurance policy for professional liability in this case, which had been taken out with successive insurers for a total amount of €123 million. In November 2016, the Paris Court of Appeal vindicated the Commercial Court’s prior ruling that the primary insurers were liable to cover the losses incurred by Natixis due to the Madoff fraud, up to the amount for which the bank was insured. On September 19, 2018, the Court of Cassation subsequently annulled the judgment under appeal and referred the case back to the Paris Court of Appeal with a differently constituted bench. On September 24, 2019, the Court ruled against Natixis, overturning the ruling by the Paris Commercial Court. Natixis filed an appeal with the Court of Cassation in December 2019. The Court of Cassation dismissed the appeal on November 4, 2021, so that the judgment of the Paris Court of Appeals of September 24, 2019, unfavorable to Natixis, became final and irrevocable.
Irving H. Picard, the liquidator of Bernard L. Madoff Investment Securities LLC (BMIS), submitted a restitution claim concerning the liquidation of amounts received prior to the discovery of the fraud through a writ filed with the United States Bankruptcy Court for the Southern District of New York against several banking institutions, including a $400 million claim against Natixis. Natixis denies the allegations made against it and has taken the necessary steps to defend its position and protect its rights. Natixis has launched appeals, including a motion to dismiss the case on a preliminary basis, and prior to any ruling on the merits, and a motion to withdraw the reference to transfer certain matters to the Federal District Court. These proceedings have been the subject of numerous rulings and appeals and are still ongoing. A November 2016 ruling by the bankruptcy court dismissed a number of restitution claims initiated by the liquidator on the grounds of extraterritoriality. In September 2017, the Second Circuit Court granted the liquidator of BMIS and the defendants the right to appeal the bankruptcy court’s ruling on the grounds of extraterritoriality directly through the Second Circuit, thereby avoiding the need to file an intermediary appeal with the District Court. In February 2019, the Second Circuit Court overturned the bankruptcy court’s extraterritoriality ruling. In August 2019, Natixis joined the group of defendants having filed a request for permission to appeal the Second Circuit Court’s ruling before the Supreme Court. In June 2020, the Supreme Court refused to hear the case. On August 30, 2021, the Second Circuit Court clarified the concept of “good faith” by deciding (i) that it is determined according to the standard of “inquiry notice” which is less favorable to the defendants, and (ii) that the burden of proof lies not with the liquidator of BMIS but with the defendants. These preliminary points having now been decided, the proceedings are continuing on the merits. The liquidator of BMIS has taken steps to split the restitution claim initially brought against Natixis into two separate actions, one against Natixis SA (initial action amended to include only the buybacks of Fairfield Sentry shares) and the other against Natixis Financial Products LLC (new action to be brought relating to the buybacks of Groupement Financier shares). Separate proceedings have been initiated and are ongoing. The bankruptcy court issued its decisions in November 2023, dismissing the motions to dismiss filed by Natixis SA and Natixis Financial Products LLC. In December 2023, Natixis SA filed an appeal requesting authorization to appeal the decision rejecting its request for rejection. The authorization to appeal was rejected on February 2, 2024. The case is ongoing.
Furthermore, the liquidators of Fairfield Sentry Limited and Fairfield Sigma Limited have initiated a large number of proceedings against investors having previously received payments from these funds for redemptions of shares (over 200 proceedings have been filed in New York). Some Natixis entities have been named as defendants in some of these proceedings. Natixis deems these proceedings to be entirely unfounded and is vigorously defending its position. These proceedings have been suspended for a couple of years, and in October 2016 the bankruptcy court authorized the liquidators to modify their initial claim. The defendants filed joint responses in May and June 2017. In August 2018, the bankruptcy court ruled on a motion to dismiss filed by the defendants (requesting that the case be dismissed on a preliminary basis and prior to any ruling on the merits). The judge only gave a ruling on one of the merits (that of personal jurisdiction), having found that the latter was missing from the claim made against the defendants. In December 2018, the judge ruled on the motion to dismiss, rejecting the liquidators’ common law claims (unjust enrichment, money had and received, mistaken payment and constructive trust) as well as the contractual claims. However, it overturned the motion to dismiss in respect of the claims founded on British Virgin Islands’ law, while reserving the right to file a plea for the application of the Section 546(e) safe harbor provision. In May 2019, the liquidators appealed the bankruptcy court’s ruling before the District Court. On March 9, 2020, the defendants, including Natixis, submitted a motion to dismiss this appeal and they renewed their initial motion on March 16, 2020. The bankruptcy court asked the defendants to limit the motion to dismiss to arguments that can lead to the dismissal of all the actions of the liquidators (pursuant to the Section 546(e) safe harbor provision or the impropriety of the initial petition). In December 2020, the bankruptcy court dismissed the action brought under the law of the British Virgin Islands, considering that the defendants, including Natixis, are covered by the Section 546(e) safe harbor provision. In August 2022, the District Court upheld the bankruptcy court’s decision dismissing the actions of the liquidators against all defendants, including Natixis. The liquidators unsuccessfully appealed this decision to the Second Circuit and appealed to the United States Supreme Court. The case is ongoing.
In March 2009, the Paris public prosecutor’s office (Parquet de Paris) launched a preliminary investigation into a complaint filed by Natixis minority shareholders and coordinated by the French Association for the Defense of Minority Shareholders (Association de défense des actionnaires minoritaires - ADAM). As the plaintiffs have initiated civil proceedings, a judicial investigation opened in 2010. On February 14, 2017, Natixis came under investigation for false and misleading information on account of two messages sent in the second half of 2007, at the beginning of the subprime crisis.
The committal concerns only one of the two messages, disseminated on November 25, 2007, explaining the risks to which Natixis was exposed at the time as a result of the subprime crisis. The second message was dismissed.
The Paris Criminal Court, in a judgment handed down on June 24, 2021, condemned Natixis, deeming insufficient the information provided by said press release of November 25, 2007, and more specifically the risks to which the bank was exposed at the time due to the subprime crisis.
It imposed a fine of €7.5 million. The civil parties were awarded total compensation of around €2 million. Natixis appealed against this judgment.
The case was appealed to the Paris Court of Appeal from January 22 to 31, 2024. On May 7, 2024, the Paris Court of Appeal issued its decision upholding the conviction of Natixis, but significantly reducing the penalty to a fine of €2 million. In respect of the civil action, the Court of Appeal upheld – in substance – the judgment and awarded the civil parties additional compensation for the costs of the proceedings in question.
Natixis, which has always considered that it has not committed any criminal offense, filed an appeal on May 7, 2024. In a decision dated February 4, 2026, the Court of Cassation dismissed this appeal.
By two summons dated November 20, 2013, Selcodis, on the one hand, and EDA, on the other hand, brought proceedings before the Paris Commercial Court jointly against Natixis and two other banking institutions for alleged unlawful agreement, which allegedly resulted in the refusal to provide a guarantee to EDA and the termination of various loans.
Under the terms of these summons, Selcodis seeks compensation for the loss allegedly suffered as a result of the judicial liquidation of its subsidiary EDA and seeks an order that the defendants be ordered to pay damages, which it assesses at the sum of €32 million. For its part, EDA requests that the defendants be ordered to bear the total amount of the shortfall to be quantified by the court-appointed agent on liquidation.
On December 6, 2018, the Paris Commercial Court, after consolidating the proceedings, noted their expiry and declared them extinguished. In January 2019 the plaintiffs appealed this judgment.
The judgment was delivered on June 22, 2020. The Court of Appeal ruled out the expiry of the current proceedings. The decision was made not to appeal to the Court of Cassation.
By a judgment dated December 5, 2025, the Paris Commercial Court declared Selcodis’ action inadmissible and dismissed all of the plaintiffs’ claims.
Following a review by the AMF in February 2015 of the compliance by Natixis Asset Management (new name Natixis IM International) with its professional obligations, and more specifically the management of its formula funds, the Sanctions Committee issued its decision on July 25, 2017, issuing a warning and a fine of €35 million. The Sanctions Committee noted several breaches concerning redemption fees paid to the funds and structuring margins.
Natixis IM International appealed this decision to the French Council of State. In its judgment of November 6, 2019, the Council of State reformed the decision of the Sanctions Commission by reducing the penalty to €20 million. The warning was maintained.
In addition, on March 5, 2018, UFC-QUE CHOISIR, in its capacity as a consumer defense association, brought proceedings against the asset management company before the Paris Court of Justice to obtain compensation for the property damage allegedly suffered by the holders of the aforementioned formula funds.
By a judgment of April 3, 2024, the Paris Court of Justice declared the action of UFC-QUE CHOISIR to be inadmissible and dismissed its claims in full. UFC-QUE CHOISIR has appealed this judgment.
On June 18, 2025, the Paris Court of Appeal dismissed the claims on the merits in their entirety, finding that there was no compensable loss suffered by the unit holders of the formula funds managed by Natixis IM International.
On August 18, 2025, UFC Que choisir filed an appeal with the Court of Cassation against the decision of the Court of Appeal.
On June 7, 2019, Bucephalus Capital Limited (a company under UK law) brought claims against Darius Capital Partners (a company under French law, now operating under the name Darius Capital Conseil, a 70%-held subsidiary of Natixis Investment Managers) before the Paris Commercial Court, to contest the alleged breach of various contractual obligations, particularly with respect to a framework agreement dated September 5, 2013 setting out their contractual relations and various subsequent agreements. Bucephalus Capital Limited claimed a total of €178,487,500.
In the course of the proceedings, Bucephalus Capital Limited increased the amount of its claims, seeking payment of €418,492,588 or, in the alternative, €320,645,136, in addition to payment of €100,000 under Article 700 of the French Code of Civil Procedure.
By decision of March 16, 2023, the Paris Commercial Court rejected all of Bucephalus Capital Limited’s claims and ordered it to pay Darius Capital Conseil’s legal costs in the amount of €150,000. Bucephalus Capital Limited filed an appeal on June 28, 2023 and requested a stay of payment of the €150,000. By order of November 29, 2023, the Paris Court of Appeal rejected this request.
On May 20, 2021, the European Commission issued an infringement decision against Natixis and found that it had breached EU competition rules by participating in a cartel on the primary and secondary European government bond market in 2008-2009.
As Natixis had left the cartel more than five years before the Commission began its investigation, it benefited from the limitation period. No fines were imposed on Natixis.
On July 30, 2021, Natixis filed an application with the General Court of the European Union to annul the Commission’s decision. The appeal is based, in particular, on the argument that the Commission has the right to issue a decision of infringement only if it can demonstrate a “legitimate interest” in doing so and on the argument of the infringement of the rights of defense of Natixis.
On March 26, 2025, the Court dismissed Natixis’ appeal and confirmed that the European Commission’s infringement decision against Natixis should be maintained.
Natixis is the subject of preliminary investigations opened in France by the Parquet National Financier and in Germany by the Cologne Public Prosecutor’s Office.
As part of the investigations conducted in France, and in particular the searches carried out on March 28, 2023 at the premises of various banks, including Natixis, the Parquet National Financier issued a press release stating that five preliminary investigations were opened on December 16 and 17, 2021 on charges of aggravated tax fraud and, in some cases, aggravated tax fraud relating to the taxation of dividends received by banks in connection with their securities transactions.
As part of the investigations conducted by the Cologne public prosecutor’s office, searches were carried out on June 13, 2023, mainly at the premises of the Natixis Branch in Frankfurt, but also at the headquarters of Natixis Pfandbriefbank AG and Natixis Investment Managers International SA in Frankfurt and Munich.
-
11 Non-compliance and financial crime risks
In accordance with the legal and regulatory requirements, and with the professional standards and control charters governing Groupe BPCE, the functions managing compliance risk are organized as part of the internal control framework of all Groupe BPCE entities and subsidiaries as a whole. The Group Compliance division, which reports to the Groupe BPCE Corporate Secretary’s Office, performs its duties independently of the operational departments and of the other Internal Control departments with which it collaborates.
The Compliance division, “Compliance Verification function” defined by the EBA and included in the order of November 3, 2014, amended by the order of February 25, 2021, is responsible for the prevention, detection, measurement and monitoring of non-compliance risks to ensure their control.
It helps regulate, manage, control and guide the functions Group entities. The Compliance Chief Officers appointed within the various direct subsidiaries of BPCE SA and subject to the regulatory banking and financial supervision system, report to it through a strong functional link.
The Group Compliance division carries out all actions designed to strengthen customer protection, compliance with ethical rules, the fight against money laundering and the financing of terrorism, the fight against market abuse, the monitoring of transactions and compliance with sanctions and embargoes. Lastly, it monitors compliance risks throughout the Group. As such, it builds and revises the standards proposed for the governance of Groupe BPCE, shares best practices and coordinates working groups consisting of Compliance representatives sector.
The dissemination of the culture of non-compliance risk and consideration of the legitimate interests of clients is also reflected in the training of employees in the sector and the awareness-raising of other BPCE departments.
- draws up the Group’s non-compliance risk management frameworks (risk mapping and RMS) and supervises the permanent control framework relating to non-compliance risks;
- prepares internal risk prevention reports for the Group’s Risk Executive Committees and the Supervisory Body’s Risk Committees;
- determines and validates, in conjunction with HR, the content of training materials intended for the Compliance function;
- coordinates the training of Directors/Heads of Compliance through a dedicated system;
- animates the Compliance function of the entities through national days that present themes relating to Customer Protection, Conduct and Ethics or Financial Crime;
- draws on the expertise of the Compliance functions of Group entities via theme-based working groups, in particular to develop and implement compliance standards.
In addition, BPCE SA Compliance & OR to the Group Compliance division and manages and supervises the Compliance of the entities of the Financial Services and Expertise division (FSE), the Digital & Payments division, the Insurance division, and of the other subsidiaries reporting to BPCE, including Palatine, Natixis Algérie and BPCE International.
-
11.1 Compliance
Group Compliance includes a team in charge of supervising the compliance framework of the Group’s entities and areas of expertise (Conduct and Ethics, Banking Insurance Compliance, Investment Services Compliance, and Financial Crime).
Group compliance is organized as follows: The Consolidated oversight and Ethics department
is in charge of overseeing the compliance frameworks deployed within Groupe BPCE entities. It defines the framework for this supervision and establishes a supervision control plan drawing on the expertise of the Banking & Insurance Compliance, Investment Services Compliance, Financial Crime, and Conduct and Ethics divisions. It manages the mapping of non-compliance risks for Groupe BPCE entities. It organizes the coordination of the Compliance function.
It monitors non-compliance risk indicators, oversees the reporting frameworks and also covers the centralization of relations with regulators, supervisors and the Group Internal Audit in compliance matters.
The Conduct, Ethics and Anti-Bribery Corruption ABC (attached to the Consolidated oversight and Ethics department)
covers the supervision and management of Groupe BPCE’s Conduct and Ethics frameworks, including the conflicts of interest framework, employee ethics (gifts, benefits and external interests), the internal anti-fraud framework, the whistleblower framework, the anti-bribery corruption framework, and the training courses related to conduct and ethics applicable to Groupe BPCE entities.
Every six months, the Conduct and Ethics indicators and highlights are presented to the Group’s Cooperative and CSR Committee.
It is responsible for implementing the regulatory texts and defining the body of standards relating to Conduct and Ethics to be implemented within Groupe BPCE’s entities. A mapping of non-compliance risks relating to the regulatory frameworks on Conduct and Ethics is prepared every year by the Group’s entities with a focus on the assessment of the level of risk and the control system, and is presented to the management bodies. In addition, annual checks on the Conduct and Ethics systems are carried out every year as part of permanent controls.
Banking Insurance Compliance and Investment Services Compliance departments
are responsible for preventing the risk of non-compliance with laws, regulations or professional standards, within the scope of the banking, insurance and financial savings activities.
Paying particular attention to all issues relating to compliance with customer protection rules, the main actions carried out by these two departments are as follows:
- Participation in regulatory work in the marketplace;
- Development and updating of the Group normative, control and steering framework in terms of compliance;
- Support for entities in the deployment of Group compliance standards and in external and internal audits;
- Support for the Group in terms of maintaining or achieving regulatory compliance of the entities’ business practices and regulatory processes relating to customer protection;
- Support for the Sales Department of BPCE (Retail Banking and Insurance) and the networks:
-
In the deployment of commercial offers: marketing of new offers, creation or adjustment of associated marketing paths, and validation of client and advisor support materials,
-
In the marketing and monitoring of new products and new activities over time;
- Monitoring of the compliance frameworks deployed within the Group’s entities.
Investment Services Compliance department also includes the oversight of investment services and the operating procedures of investment services compliance officers (Responsables de la conformité des services d’investissement - RCSI).
Financial Crime department
covers the supervision of the frameworks for combating money laundering and financing of terrorism (AML-CFT), and for compliance with national and international sanctions financial sanctions (embargoes, sectoral sanctions and asset freezes) (see dedicated section).
Ongoing improvements to the already robust framework in place. Several IT projects were delivered to further expand the regulatory information, both annually on inactivity status and on deposits (information prior to the closing of accounts and transfer to Caisse des Dépôts et Consignations). The identification of inactive safes has also been improved, facilitating the implementation of our regulatory obligations.
- – improve effective reimbursement and investigation times. Regular monitoring by indicators has been set up;
- – ensure reimbursement of the costs incurred;
- – ensure that disputes between entities are handled in a uniform manner by implementing procedures common to the entities;
- – facilitate the initiation of a dispute by the client by creating the self-care dispute channel, in addition to the branch and customer relations center channels.
Implementation of the obligations resulting from the IP Regulation (instant transfers in euros) which came into force on October 9, 2025. This work led in particular to the roll-out of access for our clients to instant transfer, limit management and beneficiary verification services.
Continued implementation of the multi-holding control measures for regulated savings products provided for by Decree No. 2021-277 of March 12, 2021 on the control of the holding of regulated savings products, which will come into force no later than January 1, 2026.
Identification of the operational impacts resulting from the obligations of the Consumer Credit Directive 2 (CCD2), which is scheduled to come into force on November 20, 2026.
Continuation of several major actions in 2025 with the aim of anchoring the reflexes of systematic updating of Customer Knowledge: raising awareness among networks and management through indicators allowing for enhanced and global monitoring of Customer Knowledge.
The Group has continued to improve and strengthen its frameworks for Investor Protection, Product Governance and Supervision, and Market Integrity and Transparency.
- The rationalization and the review of the LOD 2 policies, guides and control sheets included in the 2025 Compliance roadmap on the Investor Protection, Product Governance and Supervision, and Market Integrity and Transparency frameworks.
- – Concerning Investor protection and product governance and supervision, ACPR recommendation 2024-R-03 on the duty to advise, AMF position 2013-10/2019-12 on GSM remediation, and the order of March 19, 2025 amending the General Regulation of Autorité des marchés financiers (AMF), the French financial markets authority, on product marketing monitoring have been integrated. Also, a note on the impacts of the Retail investment strategy was distributed at the end of the year to the sales and compliance functions within the entities.
- – Concerning Market integrity and transparency, the new EMIR and SFTR regulatory texts related to market transactions, in particular EMIR 3.0, have been integrated.
- As part of the supervision exercised, controls were carried out on the Investor Protection, Product Governance and Supervision, and Market Integrity and Transparency frameworks. Monitoring actions have been implemented to follow up on the remediation of identified anomalies.
- Committees continued to strengthen the monitoring of entities, as well as provide support for institutions in the context of supervisory requests/controls and monitoring of agreed Group remediation plans.
- Work to develop consolidated Group management indicators, particularly on the Market integrity and transparency frameworks, and the investor protection customer journey, has been carried out and will continue in 2026.
- Entities were monitored and supported for their declarations related to the annual report of investment services compliance officers (Responsables de la conformité des services d’investissement - RCSI) submitted to the Autorité des marchés financiers (AMF), the French financial markets authority.
- A new tool for processing market abuse alerts was rolled out.
In the context of legislation that offers much better protection for more whistleblowers (see Act of March 21, 2022), and to meet the requirements of act No. 2017-399 on the duty of care of parent and subcontracting companies, Groupe BPCE has chosen to use the same tool for all Group entities, regardless of the country in which they operate (Europe, the United States, etc.) and regardless of their business line (Retail Banking, Corporate & Investment Banking, etc.).
This framework allows for the collection of reports on a secure online platform directly accessible by an URL link (https:// www.groupebpce.com). The whistleblowing framework is open to all employees and third parties, who can express their concerns if they are aware of serious violations of human rights and fundamental freedoms, personal health and safety, or the environment.
The online platform offers all the guarantees in terms of data security and respects the highest standards in terms of confidentiality and respect for anonymity.
Groupe BPCE entities protect whistleblowers. Under no circumstances may they be subject to any disciplinary action or legal proceeding, provided they have acted without direct financial compensation and in good faith.
Group employees regularly receive training on Customer protection issues to maintain the required level of customer service quality. These training sessions are aimed at promoting awareness of compliance and customer protection among new hires and/or sales team employees.
-
11.2 Financial crime
- Fight against money laundering, criminal activities (including financing of the proliferation of weapons of mass destruction) and financing of terrorism;
- Compliance with national, European and international sanctions targeting individuals, entities or countries.
- customer relations principles aimed at preventing, mitigating and remedying the risks of criminal use of the products and services offered by the Group’s entities. These principles are formalized in policies and procedures that are regularly updated and are regularly communicated to the employees;
- a continuous training framework for the Group’s employees and specific training for the financial crime function.
- preventing criminal activities by depriving them of funds, on the one hand;
- ensuring the soundness, integrity and stability of the economic and financial system, on the other hand.
As an AML-CFT obliged entity, Groupe BPCE is fully committed in the fight against illegal financial circuits, in addition to the action of public authorities: financial intelligence units, law enforcement agencies, and judicial authorities.
The AML-CFT framework applies to all Groupe BPCE entities (institutions of the Banques Populaires and Caisses d’Epargne networks and their subsidiaries and branches, as well as BPCE SA, its subsidiaries and branches in France and abroad), which are subject to AML-CFT requirements.
In addition to the corporate culture, this system is based on an internal organization and resources (human, IT, data), which implement a complete and consistent framework for prevention, mitigation and remediation of financial transactions likely to be linked to criminal activities. It is based on five main components:
- I. Assessment of the risks of money laundering, criminal activities and terrorist financing. Each entity, subsidiary or branch of the Group, subject to the AML-CFT requirements, assesses its exposure to the risks described by the public authorities according to the factors provided for by the legislation, inherent to their clients, services, transactions and distribution channels, and geographic factors.
- II. KYC, through onboarding checks, including identification of the beneficial owners for legal entities and regular updating of client information throughout the business relationship. Due Diligence on clients also includes the detection of politically exposed persons (PEP) and the application of additional vigilance measures.
- III. Ongoing monitoring of transactions, throughout the business relationship. These vigilance efforts, adapted to the ML/FT risk, are based on human vigilance as well as on automated means of detecting unusual transactions, in strict compliance with the rules provided for by the General Data Protection Regulation (GDPR).
- IV. Processing of alerts, in order to remove any doubt about the lawfulness of sums or atypical/unusual transactions. These analyses lead the entities to carry out a certain amount of due diligences: analysis of the operation of the account, request for supporting documents, etc.
- V. Reporting of "suspicions" to the Financial Intelligence Unit (FIU; TRACFIN in France) of doubtful/suspicious amounts or transactions when there is a concern about their legality. Conversely, in the event the due diligence confirms the regular nature of the amounts or transactions, the alert is “closed” and accompanied by an audit trail of the verifications performed. Reporting time periods are monitored as part of the risk appetite policy.
Other elements supplement this framework such as, in particular, a permanent and periodic internal control system, regular training and information for employees and managers of the Group and affiliates, and regular monitoring of dedicated indicators by the governance bodies.
B/ Compliance with national, European and international financial sanctions targeting individuals, entities or countries
Compliance with national and international financial sanctions is a key element of Groupe BPCE’s compliance framework, which, as a French and European entity, strictly complies with French and European Union laws and regulations and with the Resolutions of United Nations Security Council (UNSC).
Furthermore, all entities within Groupe BPCE comply with the US financial sanctions regime due to Groupe BPCE's presence in the United States and the large volume of transactions denominated in US dollars, as well as other criteria that establish US jurisdiction. In particular, the extraterritorial scope of certain US regulations on financial sanctions, including secondary sanctions that extend the extraterritoriality of US sanctions to transactions without American links.
Groupe BPCE complies with all applicable forms of financial sanctions, which may target a country or territory, an organization, an individual, a legal entity, a ship, an aircraft, certain goods or services, or certain activities, whether freezes of assets or economic resources, total embargoes, restrictions or specific embargoes on particular types of transactions or on the export or import of certain goods, services or technologies.
French, European, UN and US regulations therefore constitute a “common base” in terms of financial sanctions applicable to Groupe BPCE. The other regulations of the jurisdictions in which Groupe BPCE operates apply locally, and concurrently to the common base. The strictest provisions prevail.
In accordance with Groupe BPCE’s charters, all Group entities have their own financial crime unit which, along with the front, middle and back office teams, ensures the operational implementation of these measures and plays a direct role in preventing, mitigating and remediating the risks of criminal activity. All entities have an internal control framework and provide regular reporting to Groupe BPCE’s executives, governing bodies and central institution.
In addition, within the Group Compliance division, a dedicated department is responsible for adapting the legal framework to Groupe BPCE’s entities, implementing policies and procedures, ensuring that money laundering and terrorist financing risks are taken into account in the approval procedure for BPCE’s new products and new commercial activities, monitoring the resources implemented and the regulatory reporting to Groupe BPCE supervisors and executives, analyzing the results of the permanent controls and conducting supervisory controls, as well as designing the training content and coordinating the Compliance/Financial Crime function at Group level.
The Group has continued its work to strengthen and and to rationalize its frameworks and to improve the means of supervision carried out by the central body. Groupe BPCE has reviewed its financial crime risk appetite policy, its mapping of non-compliance risks and all the controls of the AML/CFT framework, and has equipped itself with tools for monitoring, in real time or, when relevant, at close frequencies, the activity of the Group’s entities. The methodology for assessing money laundering and terrorist financing risks has been completely reviewed, allowing for an overhaul of the automated transaction monitoring system, in order to improve the relevance of the detection of suspicious transactions that must be reported to TRACFIN.
-
12.1 Business continuity
The Group Business Continuity department, which reports to the Business Continuity and Crisis Management department, performs its tasks independently of the operational divisions. The Business Continuity and Crisis Management department’s missions consist of:
- managing Group business continuity and coordinating the Group Business Continuity function;
- coordinating the Group’s crisis management;
- managing the implementation of the Group Contingency and Business Continuity Plans (CBCPs) and keeping them operational;
- ensuring compliance with regulatory provisions governing business continuity;
- participating in the Group’s internal and external bodies.
The tools associated with the crisis management system are constantly evolving to improve their ergonomics and increase the range of associated functions.
- streamlining processes and strengthening systems;
- compliance with European texts on operational resilience.
The management of business interruption risks is addressed by the Group’s legal entities in the form of an analysis of the risks associated with the activities carried out. This analysis makes it possible to prioritize their restart. At the same time, the identification of the various possible risk events guides the Legal Entity in the business continuity responses to be provided and the preparation of the actions to be taken in the event of the occurrence of the risk event.
-
12.2 Information System Security (ISS)
The Group Security department (DSG) is in charge of managing cyber and technological risks for the Group through the Cyber & Technology Risk Management Group (CTRMG) team.
- 1. Function, Policies and Processes (FPP) whose main missions are the definition and operational implementation of TRM governance, the associated policies and processes, the coordination of the CTRM function composed of approximately 280 members, and the contribution of CTRM expertise during project validation committees.
- 2. The Computer Emergency Response Team (CERT), reachable 24/7, whose missions are to provide incident responses to internal or external requests, manage and deliver cyber services (in particular bug bounty, cyber rating, attack surface, etc.), animate the VIGIE community of more than 300 internal members, and coordinate the Group’s Security Operation Centers (SOC), and make DORA declarations to Autorité de contrôle prudentiel et de résolution (ACPR), the French prudential supervisory authority for the banking and insurance sector. CERT uses a variety of devices to control its attack surface and monitor information leaks outside the information system, both on the web and the dark web. It also relies on cyber threat intelligence tools to anticipate and track the activities of attacker groups. In addition, CERT collaborates with specialized communities, such as Intercert France and TFCSIRT, to share information on the various cyber threats.
- 3. The RSSI/CTRM Delegation team is responsible for managing BPCE SA’s cyber governance and IT risks and for the delegated management of BPCE SA’s direct subsidiaries.
- 4. Leaders of major Cybersecurity projects (DORA, IAM, etc.) under the responsibility of Program Directors reporting to the Group RSSI.
- 1. Continued implementation of regulatory projects (including DORA);
- 2. Implementation of essential projects and platforms for IT Security and Resilience;
- 3. Study of initiatives to respond to new threats.
The Group Information Systems Security policy (ISSP-G), which dealt solely with the types of cybersecurity risk, has given way to the Technology Risk Management (TRM) model, which is now the Group’s technology risk management framework.
The general Cyber and IT Risk Management policy (PG-TRM) covers six types, meeting EBA guidelines and the DORA regulation, and is accompanied by new policies dedicated to each of these risks:
- 1. Cybersecurity;
- 2. IT production;
- 3. IT developments and projects;
- 4. IT outsourcing;
- 5. IT governance and strategy;
- 6. IS continuity.
This TRM model is deployed in all Group entities, in accordance with the level of risk of each entity, with four main objectives:
- 1. Interlocutors who aware of and trained in cyber and IT risks;
- 2. A system equipped with Rules and Controls;
- 3. Cyber & IT risk mapping;
- 4. A committee system incorporating TRM risks.
In parallel with this deployment and the associated metrics, the strengthening of the system for managing current authorizations is also monitored, with a view to continuous improvement.
The improvement of the data leak detection system has made it possible to identify more incidents, without the severity of the damage being greater.
In addition, this deployment ensures the strengthening of third-party management (classification and definition of associated control measures) and the implementation of the audits provided for in subcontracting or service contracts. The existing contracts have also been reviewed and supplemented by the TRM appendix for better management of the security of data entrusted to third parties.
BPCE monitors its ISS maturity level with an external firm by carrying out an annual National Institute of Standards and Technology (NIST) assessment. The second line of defense (LoD2/ RSSI) commissions penetration tests on the most critical applications. In addition, with the application of the DORA regulation, BPCE is subject to Threat-Led Penetration Testing (TLPT). In addition, BPCE has not only a third line of defense, composed of the Group Internal Audit, but also the audit teams in the Group’s various entities. Lastly, BPCE is supervised by the ECB, which can carry out on-site inspection (OSI) missions; the latest OSI took place in 2023 and concerned IT risk management.
The Group Security department presents cybersecurity and IT risks to the Supervisory Board or its Risk Committee.
Furthermore, Groupe BPCE organizes mandatory regulatory training (FRO) on cybersecurity for its employees. These mandatory regulatory training courses must be followed by all employees, including managers, in accordance with the regulatory requirements (order of February 25, 2021 and DORA regulation).
The Group proposes a new mandatory regulatory training course every year, covering the themes of data protection, password management, phishing and fraud prevention, as well as compliance with the Charter for the Use of Information and Communication Technologies.
In addition, regular awareness-raising campaigns are deployed throughout the Group (including the prevention of phishing threats).
The new “Charter for the Use of Information and Communication Technologies” is an appendix to the internal rules, and it defines:
-
– the general rules governing the use of IT resources;
-
– the security rules for these resources that users must comply with;
-
– the protection and control principles that may be put in place;
-
– the responsibilities of users and potential sanctions incurred in the event of non-compliance with the Charter.
As the use of IT tools has evolved in recent years, with, among other things, the emergence of artificial intelligence and the massive deployment of teleworking, the threats have become multifaceted and have also intensified. These developments require the Group to adapt to these new threats by adjusting certain rules for the use of IT resources, while making users aware of their central role in company security.
The Charter thus specifies the rights, duties and obligations of the user (employee or external) concerning the use of the resources made available. It applies both inside and outside the company’s premises, whether when traveling or teleworking.
In addition, the awareness-raising campaigns continued, particularly aimed at the Group’s top management. In addition, the Group participates in industry bodies on cybersecurity and events such as the “European Cybersecurity Month”.
Groupe BPCE relies on a normative framework for the management of third parties. This framework involves:
-
– A prior assessment of the level of security (audit report, questionnaire of the level of maturity in terms of data protection, etc.);
-
– Contractual requirements to ensure compliance with the Group’s data protection regulations and standards;
-
– Monitoring of the compliance level (Committees, Permanent Controls, penetration tests and vulnerability scans, etc.).
-
– Thus, in accordance with DORA, Groupe BPCE plans to implement:
-
upon entering into a relationship with an external partner (before contracting), a mandatory risk analysis questionnaire including a section of questions relating to the training and awareness of the staff involved in the provision of the service;
-
a TRM appendix to the outsourcing/subcontracting contract, in which the supplier undertakes to ensure that its staff involved in the provision of the services, or having access to the customer’s information systems, benefit from regular awareness-raising efforts and training that are adequate and sufficient in terms of ICT security;
-
during the life of the contract, a permanent control, already in place in 2025, ensuring compliance annually with the training commitments on the protection and security of the employee data of external partners.
-
12.3 Personal Data Protection
The Group Security department (DSG) is responsible for the protection of personal data within the Group. It defines, implements and develops the Group’s Personal Data Protection policies. It provides continuous and consolidated oversight of its area of safety expertise, for which it is responsible, as well as technical and regulatory watch. It initiates and coordinates Group projects aimed at reducing risks in its field of expertise. It also represents Groupe BPCE vis-à-vis banking industry groups and public authorities.
Groupe BPCE has established a groupwide Privacy function. It brings together the Group Data Protection Officer (DPO-G), who coordinates this area of privacy expertise, and the DPOs of all supervised companies.
The Group Security department defines, implements and develops the Group’s Personal Data Protection policy.
- ensures the management of the Group’s ongoing GDPR compliance program, as well as the management and coordination of the DPO community, the coordination between the Group’s institutions, and the maintenance in operational condition of the standards, guiding principles and procedural models pertaining to the GDPR;
- also coordinates the processing of data breaches and in particular the CNIL notification phase;
- intervenes in the validation circuit of new products or commercial processes that impact the Group. It also participates in the negotiation of contracts with service providers when they have a Community role;
- provides reporting on the Group’s GDPR risk, defines and consolidates a permanent control system for the benefit of Groupe BPCE’s governance, and carries out an annual consolidated mapping of the GDPR risk. The DPOs of the Caisses d’Epargne and Banques Populaires and more broadly all affiliated parent companies, direct subsidiaries and IT EIGs report functionally to the Group DPO. This functional link means that:
- – the Group DPO is notified of any DPO appointment and is involved in the recruitment process. Before being rolled out throughout the Group in 2027, the DPO is integrated into the recruitment process for DPOs (or their corporate relay, the Data Protection Lead (DPL), if the DPO function is centralized within the Group Data Protection department) as part of a strong functional link applied to the entities of the BPCE Collective. This functional link also includes the assessments of the DPO or DPL in conjunction with his or her superiors, as well as the preparation of budgets;
- – the Group data protection policy applies within the institutions and guides the organization and missions of the two lines of defense, LoD2 and LoD1. Although there is a possibility for local subsidiarity, it must remain limited and validated by the Group DPO or a lower level DPO (GFS, Insurance division and BRED);
- – reports on the level of compliance of the institutions with the Group data protection policy, the permanent privacy control, the main GDPR incidents, and any requests from CNIL are sent to the Group DPO.
- a first- and second-level permanent control system recorded in the DRIVE and PRISCOP tools, the latter combining the two levels of control;
- an annual GDPR risk mapping established according to the operational risk standards;
- a GDPR risk governance through the Executive Privacy Committee, which meets quarterly and receives quarterly reporting. This committee brings together LoD1 and LoD2 players and includes four members of BPCE’s Executive Management Committee, present or represented, as well as four representatives of the Banques Populaires and the Caisses d’Epargne.
-
13.1 Operational risk management
Groupe BPCE has set up a system for measuring non-financial risks through the standardized use of indicators. These cover the indicators of the RAF system, the indicators resulting from the amended order of November 3, 2014, but also qualitative indicators aimed at measuring the industry’s adherence to operational risk standards.
The Group’s operational risk policy consists of keeping all of these indicators below the set limits, by entity and on a consolidated basis. In the event of an overrun, appropriate measures and corrective actions must be taken by the business lines owning the risks to remedy the possible failures. These measures and corrective actions must be monitored by the committee in charge of operational risks.
The Group Operational Risk division (DROG) – part of the Group Risk division – is in charge of identifying, measuring, monitoring and managing the operational risks incurred in all activities and functions undertaken by Group institutions and subsidiaries.
- a central organization and a network of operational risk managers and officers, working in all activities, entities and subsidiaries of Group institutions and subsidiaries;
- a methodology based on a set of standards and an OR tool used throughout the Group.
- in all structures consolidated or controlled by the institution or the subsidiary (banking, financial, insurance, etc.);
- in all activities exposed to operational risks, including outsourced activities, within the meaning of Article 10 q and Article 10 r of the order of November 3, 2014 as amended, “outsourced activities and services or other critical or essential operational tasks”.
1. At the level of each group institution 2. At Groupe BPCE level The Operational Risk Committee is responsible for adapting the operational risk management policy and ensuring the relevance and effectiveness of the operational risk management framework. Accordingly, it:
- examines major and recurring incidents, and validates the associated corrective actions;
- examines indicator breaches, decides on associated corrective actions, and tracks progress on risk mitigation initiatives;
- examines permanent controls carried out by the Operational Risk division and in particular any excessive delays in implementing corrective actions;
- helps organize and train the network of Operational Risk officers;
- determines if any changes need to be made in local insurance policies;
The frequency of meetings depends on the intensity of the institution’s risks, in accordance with three operational schemes reviewed once a year by the Group Non-Financial Risk Committee (CRNFG) and communicated to the entities.
The Group Non-Financial Risk Committee meets quarterly and is chaired by a member of the Executive Management Committee.
Its main duties are to define the OR standard, ensure that the OR system is deployed at the Group entities, and define the Group OR policy. Accordingly, it:
- examines major risks incurred by the Group and defines its tolerance level, decides on the implementation of corrective actions affecting the Group and monitors their progress;
- assesses the level of resources to be allocated;
- reviews major incidents within its remit, validates the aggregated map of operational risks at Group level, which is used for the macro-level risk mapping campaign;
- monitors major risk positions across all Group businesses, including risks relating to non-compliance, financial audits, personal and property safety, contingency and business continuity planning, financial security and information system security (ISS);
- lastly, validates Group RAF indicators related to non-financial risks as well as their thresholds.
-
13.2 Monitoring
Incident data are collected to build knowledge of the cost of risks, continuously improve management systems, and meet regulatory objectives.
- broaden risk analysis and gain the knowledge needed to adjust action plans and assess their relevance;
- produce COREP regulatory half-year operational risk statements;
- produce reports for the executive and governing bodies and for non-management personnel;
- establish a record that can be used for operational risk modeling.
Incidents are reported as they occur, as soon as they are detected, in accordance with Group procedure. A whistleblowing procedure has been set up for major incidents and internal limit breaches to round out the incident data collection system.
The operational risk management framework relies on a mapping process which is updated annually by all Group entities.
Mapping enables the forward-looking identification and measurement of high-risk processes. For a given scope, it allows the Group to measure its exposure to risks for the year ahead. This exposure is then assessed and validated by the relevant committees in order to launch action plans aimed at reducing exposure. The mapping scope includes emerging risks, risks related to information and communication technologies and security, including cyber-risks, risks related to service providers and risks of non-compliance.
This same mapping mechanism is used during the Group’s ICAAP to identify and measure its main operational risks. The operational risk map also serves as a basis for the macro-risk mapping campaign covering the institutions, and thus for the Group overall.
Corrective actions are implemented to reduce the frequency, impact or spread of operational risks. They may be introduced following operational risk mapping, breaches of risk indicator thresholds or specific incidents.
At Group level, progress on action plans for the principal risk areas is also specifically monitored by the Non-Financial Risk Committee.
The alert procedure for serious incidents has been extended to the entire scope of Groupe BPCE. The aim of this system is to enhance and reinforce the system for collecting loss data across the Group.
An operational risk incident is deemed to be serious when the potential financial impact at the time of detection is over €300,000. Operational risk incidents with a material impact on the image and reputation of the Group or its subsidiaries are also deemed to be serious.
-
13.3 Control
The permanent risk control division of the Governance and Risk Control department performs two types of Level 2 Controls on Operational Risks:
-
compliance checks with standards (comprehensive and automatic):
- Groupe BPCE checks the system when it presents any deviations from the Operational Risk Standards on the various themes of Operational Risk Management: organizational system for the management of OR, incidents, mapping, predictive risk indicators, corrective actions, etc.;
-
data quality controls (sample and manual):
- Groupe BPCE performs Level 2 controls of the Operational Risk division.
These controls are carried out on the basis of the control reports of the Institutions system, and therefore on the same scope as these reports: system, incidents, mapping (risk situations), predictive risk indicators, corrective actions.
The majority of these controls are carried out on the basis of data samples extracted from the operational risk management tool. The results of these Level 2 sample controls are recorded in the permanent controls management tool.
Other controls concern certain points relating to risk coverage. They are exhaustive and their results are subject to specific formalization (minutes of meetings relating to serious incidents, record of decisions, etc.).
In addition, with a view to improving our risk management, first- and second-level controls on external fraud are being implemented.
In terms of Insurance, the networks and subsidiaries benefit from coverage of their insurable operational risks under Group insurance policies contracted from leading insurance companies. In addition to this system, an internal Group reinsurance company has been set up.
As in the previous year, the two main Basel OR causes are “Execution, Delivery and Process Management” and “External fraud”.
The main incident in 2025 was an “Execution, Delivery and Process Management” Basel incident for an amount of €8 million, which explains the change in percentages.
In terms of Insurance, the networks and subsidiaries benefit from coverage of their insurable operational risks under Group insurance policies contracted from leading insurance companies. This system is complemented by a reinsurance captive that allows the adjustment of deductible levels.
- for its subsidiaries, including Natixis;
- and the Banque Populaire and Caisse d’Epargne networks, with the exception of CASDEN Banque Populaire with respect to the “Property Damage” insurance coverage for Registered Offices & Similar and their contents (including IS equipment) and consequent “losses in banking activities”, described below in point E/.
The following main Insurance policies to cover its insurable operational risks and protect its balance sheet and income statement:
- A/ Combined “Global Banking (Damages to Valuables and Fraud)” & “Professional Civil Liability” policy with a total maximum payout of €217 million per year of insurance, of which:
- I. €92.5 million per year, combined “Global Banking/ Professional Civil Liability/Cyber-Risks/FIE” and mobilizable under the guaranteed amounts indicated in (ii) and/or (iii) and/ or (iv) and/or F/ below;
- II. €48 million and per year (sub-limited in “Fraud” to €35 million per claim), dedicated to the “Global Banking” risk only;
- III. €25 million per claim and per year, solely reserved for “Professional Civil Liability” risk;
- IV. €51.5 million per claim and per year, combined “Global Banking/Professional Civil Liability” insurance available in addition to or after use of the amounts guaranteed set out in (ii) and/or (iii) above.
The maximum amount that can be paid out for any one claim under this arrangement is €100 million under “Professional Civil Liability” coverage and €100.5 million under “Fraud” coverage in excess of the applicable deductibles.
- B/ “Regulated Intermediation Liability” (in three areas: Financial Intermediation, Insurance Intermediation and Real Estate Transactions/Management) with a total maximum payout of €10 million per claim and €13 million per year.
- C/ “Operating Civil Liability” covering €75 million per claim, as well as a “Subsidiary Owner Civil Liability”/”Post Delivery-Reception Civil Liability” coverage extension for up to €35 million per claim and per year of insurance.
- D/ “Company Directors Civil Liability” for up to €150 million per claim and per year of insurance.
- E/ “Property Damage” to “Registered Offices & Similar” and to their content (including IT equipment) and the consecutive “losses in banking activities”, for up to €300 million per claim (sub-limited to €100 million per claim and €200 million per year for consequential “losses in banking activities”).
- F/ “Protection of Digital Assets against Cyber-Risks” & consecutive “losses of banking activities”, up to €100 million per claim and €156.5 million per policy year of which €85 million per year combined with the guaranteed amount indicated in (i) of A/.
-
compliance checks with standards (comprehensive and automatic):
-
13.4 Detailed quantitative information
a b c d e f g h i j k In millions of euros 12/31/2025 12/31/2024 12/31/2023 12/31/2022 12/31/2021 12/31/2020 12/31/2019 12/31/2018 12/31/2017 12/31/2016 Ten-year
averageUsing the €20,000 threshold 1 Total amount of operational risk losses net of recoveries (no exclusion) 112 123 121 127 197 234 113 624 401 466 252 2 Total number of operational risk losses 958 943 1,022 1,004 981 990 978 1,139 2,117 2,550 1,268 3 Total amount of excluded operational risk losses 4 Total number of excluded operational risk events 5 Total amount of operational risk losses net of recoveries and net of excluded losses 112 123 121 127 197 234 113 624 401 466 252 Using the €100,000 threshold 6 Total amount of operational risk losses net of recoveries (no exclusion) 81 93 88 91 167 203 80 587 330 382 210 7 Total number of operational risk losses 244 243 260 266 334 296 213 270 516 566 321 8 Total amount of excluded operational risk losses 9 Total number of excluded operational risk events 10 Total amount of operational risk losses net of recoveries and net of excluded losses 81 93 88 91 167 203 80 587 330 382 210 Details of operational risk capital calculation 11 Not applicable 12 Not applicable 13 Not applicable in millions of euros a b c d BI and its subcomponents 12/31/2025 12/31/2024 12/31/2023 Average value 1 Interest, leases and dividend component (ILDC) 8,746 EU 1 ILDC related to the individual institution/consolidated Group (excluding entities considered by Article 314(3) 8,746 1a Interest and lease income 52,243 59,309 52,741 54,764 1b Interest and lease expense 42,563 51,309 44,810 46,228 1c Total assets/Asset component 1,431,477 1,401,575 1,381,739 1,404,930 1d Dividend income/Dividend component 171 225 231 209 2 Services component (SC) 15,162 2a Fee and commission income 15,047 14,648 13,715 14,470 2b Fee and commission expense 2,467 3,074 2,845 2,795 2c Other operating income 633 632 814 693 2d Other operating expense 289 356 445 363 3 Financial component (FC) 3,396 3a Net profit or loss applicable to trading book (TB) 2,179 3,793 2,713 2,895 3b Net profit or loss applicable to banking book (BB) 627 -845 32 501 EU 3c Approach followed to determine the TB/BB boundary (PBA or accounting approach) PRUDENTIAL METHOD 4 Business Indicator (BI) 27,305 5 Business indicator components (BIC) 4,066 12/31/2025 in millions of euros a 1 Business Indicator Component (BIC) 4,066 EU 1 Alternative Standardised Approach (ASA) Own Funds Requirements (OROF) under Article 314(4) 0 2 Not applicable 3 Minimum Required Operational Risk Own Funds Requirements (OROF) 4,066 4 Operational Risk Exposure Amounts (REA) 50,821 -
14 Insurance, Asset Management, Financial Conglomerate risks
- The Boards of Directors decide on all matters relating to the company’s strategy, finance, risks and management; they are kept regularly informed of changes in the activity; they draw up the accounts, approve the budget and validate the Own Risk and Solvency Assessment (ORSA) report.
- The Risk Committee’s areas of expertise include:
- – Follow-up on the recommendations of the latest assignments of the BPCE’s Internal Audit, the internal audit departments of BPCE Assurances and BRED, or the ACPR;
- – Organization of the supervision and control of the entities’ risks (including operational risks), compliance, internal control organization, anti-money laundering, audit plan and audit budgets;
- – Changes in the organization or governance of companies.
Within the Group Risk division, the Non-Banking Equity Risk department aims to provide a cross-functional view of the risks borne by the Group’s non-banking investments, by identifying the interactions between the risks of the Insurance, Asset Management and Banking businesses, through contagion mechanisms in a financial conglomerate approach.
The Non-Banking Equity Risk department is based on a matrix organization and is made up of three teams:
- 1) Group and Financial Conglomerate Insurance Risks;
- 2) Asset Management and Insurance Investment Risks;
- 3) Stress Tests & Methodologies.
Risk management frameworks related to the entities of the insurance sector extended to the financial conglomerate
- BPCE is made up of several prudential Insurance groups within the meaning of Solvency II; each producing a 'group' ORSA report and 'solo' ORSA report;
- As part of these ORSA exercises, the companies carry out stress tests, which are coordinated by the Non-Banking Equity Risk department to ensure homogeneity;
- The Group Risk division has standardized the Group’s ORSA scenarios base with those of the internal capital adequacy assessment process (ICAAP). In addition, the companies simulate scenarios for their ORSAs that reflect the specificities of their business model and risk profiles;
- The Group Risk division coordinates these exercises and analyzes the results of the simulations and presents them to the Group’s Executive Management.
- The quarterly Insurance Risk Monitoring Committees, set up by the Group Risk division with each of the companies, are an important forum for discussion, where the company’s Chief Risk Officer presents his or her risk analysis and the highlights of the quarter to his or her banking parent company and to the central institution;
- These committees issue a quarterly report from each company to inform the Group’s Executive Management within the framework of the Group Risk and Compliance Committee;
- Each quarter, at the end of the CSRA, the Group Insurance Risks function prepares a quarterly summary of insurance risks for the Group’s CRO;
- In addition, every year the Group Risk division reviews, in conjunction with the non-banking business lines and their parent companies, the Group RAF indicators and the associated thresholds/limits;
- The Group Risk division is involved in the implementation and monitoring of the RAF system within the scope of each company.
- A methodology for the Group’s Insurance companies has been formalized and implemented. This methodology makes it possible to align Insurance with Banking within the framework of the ICAAP normative internal stress tests and the EBA regulatory stress tests;
- For the ICAAP economic approach, the Group Risk division has developed an Economic Capital model for Insurance Holdings Risk1
- 1 The methodology has been progressively enriched. In particular, Economic Capital distinguishes between the capital necessary to carry investments and the capital likely to be committed in a complementary manner (buffer for recapitalization risk, allocated to step-in risk).
- The Financial Conglomerate approach aims to consolidate the banking and insurance sector metrics in particular, especially the capital requirements, in order to:
- – Better establish the management of interactions between the three regulated financial sectors Banking, Insurance and Asset Management;
- – Ensure compliance with the FICO Directive 2002/87/EC, the associated Delegated Regulations, and its national transposition;
- – Perpetuate the maintenance of the “Danish Compromise” criteria thanks to the good integration of insurance companies, particularly in terms of risk management.
- In order to provide a forward-looking view of the Group’s solvency through the Financial Conglomerate’s analysis grid, the Capital Management function projects a trajectory of the Conglomerate surplus over several years;
- In order to understand the different solvencies of a Bancassurer, the Conglomerate excess capital is projected on the basis of homogeneous Group financial assumptions, taken from the Central and Adverse scenarios of the ICAAP and broken down into Insurance-specific shocks based on the ORSAs.
Like the system adopted for the Insurance business line, the operation of this system is based on subsidiarity with the Risk departments of the management companies and parent banks; in particular, Natixis Investment Managers, which consolidates most of the Group’s assets under management.
- The Group Risk division coordinates the function and animates cross-functional projects related to the banking sector.
- The Group Risk division and Natixis IM discuss the sectoral stress tests carried out by Natixis IM and its contributions to the Natixis and Group stress tests (e.g. IST, ICAAP);
The entire system in its various dimensions – Insurance, Asset Management, Banking and Financial Conglomerate; qualitative and quantitative risk assessments – gives rise to discussions with the joint ECB/ACPR (JST) supervision team, in meetings organized under the aegis of Regulation 2002/87/EC applicable to Financial Conglomerates..
In addition to the work carried out within the Group Insurance Risk function, a certain number of permanent controls are carried out by the insurance entities. They focus on the following areas:
- Money laundering and terrorist financing risks;
- Non-compliance risk;
- Fight against fraud;
- Emergency and Business Continuity Plan (BPC);
- Monitoring of essential outsourced services.
Depending on the organization of the institutions, these permanent controls are carried out either by the Compliance function, the Risk division or the function dedicated to permanent control.
Level 1
permanent controlsImplemented by the operational structures (self-control and hierarchical control) of each of the companies on the basis of charters and procedures; 
Second level permanent control Carried out by the risk management and monitoring functions independent of the operational units within the companies or by a permanent control unit depending on the entity;
Supplemented by the Risk functions of the banking parent companies and the central institution;
Third level periodic control Carried out by BPCE’s Internal Audit, and the internal audit departments of BPCE Assurances and BRED in their respective areas and scope. Asset allocation rules are set by the ad hoc committees based on the results of asset/liability simulations performed on tools held internally or by specialized consulting firms.
Each structure has implemented a financial charter based on the risk control and supervision principles laid down by the Group or by BRED (for Prépar Vie / IARD) and by the French Insurance Code.
The insurance business presents operational risks, including legal, non-compliance and image risks. These risks are all present during the creation of the product, the drafting of the contractual conditions, and the presentation and sale of the products etc.
The partners’ sales advisors or the banks’ credit analysts have computer tools enabling them to record contracts and amendments. The applications include the criteria for accepting or modifying contracts. They result from the policy of controlling the technical balances of the companies concerned.
Lastly, the system is based on updated procedures for granting sureties and guarantees and for monitoring underwriting risks (premiums, reserves, disaster) detailed by activity.
Portfolio monitoring actions are carried out to monitor and limit the risk of claims drift for all Group companies.
The policies for pricing, updating of scorings and provisioning are adapted to the monitoring system.
The various non-life insurance companies have implemented claims management monitoring processes to ensure uniform treatment and consistent assessments.
The technical departments of the companies are in charge of managing the technical risks of the companies. This covers, among other things, the calculation of provisions, additional claims costs and the determination of ultimate expenses.
Management tools are put in place by the companies to measure and provision for risks, then reinsure them if necessary, and regularly monitor the profitability of the portfolios.
In addition to the work on provisions, the work of the technical departments of these companies covers the creation of new products, pricing reviews, the development of technical dashboards, the processes for determining claims opening fees (for non-life insurance policies), and participation in work for the steering and management of reinsurance.
The following information corresponds to significant intragroup transactions carried out during the year or in inventory between Conglomerate entities with a banking or investment services activity, on the one hand, and those with an insurance activity, on the other hand, when Groupe BPCE exercises significant influence over the insurance companies.
The main intragroup transactions concern: home loan guarantees, mandates and UCITS, a guarantee on securities loans, and commissioning with the networks:
- CEGC and Parnasse Garanties guarantee a significant portion of the home loans granted by the CE and BP networks;
- The financial investments of the Group’s insurance companies are mainly entrusted to Natixis IM (mandates and dedicated UCITS);
- In addition, the networks are commissioned by the companies as part of the distribution of insurance products.
Other intragroup transactions, which could become significant in the event of stress, are monitored periodically. In particular, the holding by non-banking business lines1 of debt issued by BPCE, and securities lending/borrowing and repo operations between these business lines and the banking sector.
Compagnie Européenne de Garanties et Cautions is the Group’s Security and Guarantee insurance entity. It is exposed to underwriting risk, market risk, reinsurer default risk and operational risk.
In 2025, new home loans guaranteed by CEGC rebounded, and overall revenue increased by almost 30%. Claims made in 2025 remained under control at 26% of earned premiums (“claims to premiums”, gross reinsurance ratio).
Under the Solvency II prudential regime, CEGC uses a partial internal model approved by the Autorité de contrôle prudentiel et de résolution (ACPR), the French prudential supervisory authority for the banking and insurance sector, and meets the robustness requirement applicable to home loan guarantors.
In 2025, CEGC covered the Solvency Capital Requirement, thanks to its Tier-1 and Tier-2 capital, as well as its reinsurance coverage.
Underwriting risk is the main risk incurred by CEGC. It is essentially a counterparty risk, as the commitments given by CEGC to beneficiaries of guarantees result in direct exposure to individual or corporate insured parties. These commitments are regulated and provisioned under liabilities in the balance sheet. They amounted to €3.25 billion at December 31, 2025 (+2.7% compared to the end of 2024).
CEGC activities 12/31/2025 Change 12/31/2025
versus 12/31/2024Individual customers 2,893 2.5% Single-family home builders 96 8.5% Property administrators – Realtors 12 (7.9%) Corporate customers 36 23.9% Real estate developers 28 (15.9%) Small businesses 109 0.5% Social Economy – Social Housing 67 6.5% Structured collateral 4 11.2% TOTAL 3,245 2.7% CEGC’s short-term investment portfolio totaled over €3.9 billion on its balance sheet at December 31, 2025 hedging technical provisions and own funds.
Market risk associated with the short-term investment portfolio is limited by the company’s investment choices.
The company’s risk limits are set out in the financial management charter and the asset management agreement established with Ostrum. As an insurance company, CEGC does not require funding since insurance premiums are collected before the disbursement of claims. Nor does CEGC carry transformation risk: the investment portfolio is entirely backed by own funds and technical reserves.
12/31/2025 12/31/2024 in millions of euros Balance sheet value,
net of provisionin % Mark to market Balance sheet value,
net of provisionin % Mark to market Equities 193 5.0% 230 145 3.8% 152 Bonds 3,131 80.6% 2,952 3,043 79.0% 2,845 Diversified 114 2.9% 120 111 2.9% 113 Cash 179 4.6% 181 277 7.2% 285 Residential mortgages 168 4.3% 181 181 4.7% 193 FCPR 34 0.9% 52 33 0.9% 52 Private debt 60 1.5% 60 54 1.4% 55 Other 6 0.2% 11 6 0.2% 11 Total 3,885 100% 3,787 3,852 100% 3,705 At December 31, 2025, the proportion of sovereign bonds was over 50%. The proportion of bonds with a rating above A- was 85%, in line with the company’s financial management charter, and more than 99% of the securities held were classified as “Investment grade”.
CEGC hedges its liability portfolio by implementing a reinsurance program tailored to its activities.
In loan guarantees, reinsurance is used as a tool for regulatory capital management. It protects guarantee beneficiaries in the event of an economic recession leading to a loss of up to 2% of guaranteed loan outstandings.
In the other segments, reinsurance makes it possible to share risks and cover potential large claims. Reinsurer default risk is governed by counterparty concentration and rating limits. CEGC’s reinsurance programs are underwritten by a broad panel of international reinsurers with a minimum rating of A on the S&P scale.
- PREPAR-VIE, created in 1984, a public limited company with a Management Board and a Supervisory Board;
- PREPAR-IARD, created in 1990, a public limited company with a Board of Directors.
They are wholly-owned subsidiaries of BRED Banque Populaire, of which they form the Insurance division.
At December 31, 2025, PREPAR-VIE, considered as the parent company of the PREPAR Assurance group, managed approximately 246,000 savings contracts, for a total outstanding of €8.9 billion, and 775,000 personal risk insurance contracts. PREPAR Assurances is subject to the main risks described below.
- Market risk: PREPAR-VIE’s portfolio of assets is diversified to address the ALM management issues specific to an entity mainly marketing savings contracts. As a result, PREPAR-VIE is highly exposed to market risk and more specifically to interest rate, equity, real estate and spread sub-risks;
- Credit risk: mainly related to bond investments and their receivables;
- Life insurance underwriting risk: as a company mainly marketing savings contracts, PREPAR-VIE is subject to mortality, fee and surrender sub-risks.
-
15.1 Introduction
Groupe BPCE aims to optimize returns while operating within the risk appetite limits set by the Board of Directors by monitoring each type of risk and, in particular, the model risk as well as the associated regulatory obligations.
Simplification and underlying assumptions sometimes come at the expense of accuracy and structural integrity in stressed environments. Groupe BPCE is therefore exposed to a model risk.
Model risk is the risk of financial loss or damage to the Group’s reputation resulting from defects in the design, implementation or use of models.
- model uncertainty risk: this risk is inherent in the quantitative method, system or approach used to approximate or represent the observation;
- model risk as an operational risk: this is the risk of economic or reputational loss related to errors in the development, implementation or use of the model.
-
15.2 Organization
The Group strives to define and deploy internal standards to identify, measure and limit model risk based on fundamental principles, such as the implementation of three independent lines of defense:
- a first line of defense in charge of the design, development and use of the model and the day-to-day management of model risk through the application of controls, mainly embodied by the Model Owner;
- a second line of defense, embodied in particular by the Model Risk Management (MRM) and validation functions, responsible for the definition, maintenance and operational implementation of the model risk control framework;
- a third line, embodied by Internal Audit, whose role is to periodically verify the effectiveness of the management of the model risk system and the control system defined by the second line of defense.
-
15.3 Governance
Groupe BPCE has established a robust model risk governance system aimed at assessing, reducing and monitoring changes in model risk throughout the model’s life cycle through the definition of indicators and the implementation of dedicated dashboards distributed to Executive Management.
Its implementation is linked to an independent control based on principles in connection with the documentation, design, development, implementation, review, approval, continuous monitoring and use of models to ensure their reliability. An MRM risk management policy has been defined for this purpose. This policy must promote an informed knowledge of how each model works, how it is used, and its strengths, weaknesses and limitations. The policy is supplemented by a body of procedures defining the tools for monitoring the performance of the models, in particular, the validation review, the monitoring of remediation actions and the associated escalation processes, and the monitoring of the model portfolio through an inventory. The system is based on a specific tool used throughout Groupe BPCE for the purpose of identifying all models used within the Group and managing their life cycles. A Model Risk Management Committee, chaired by the Chairman of the Management Board of BPCE or by the Chief Executive Officer in charge of risks by delegation, is dedicated to the governance/supervision of the models and the associated risk. The role of the Model Risk Management Committee is to supervise the management of the model risk and to ensure the implementation of appropriate actions for the management of the model risk.
-
16.1 Definition and reference framework
The management of environmental, social and governance risks within Groupe BPCE is part of a double framework:
- The regulatory framework applicable to financial institutions, including in particular the Sustainable Finance Disclosure Regulation (SFDR), the Markets in Financial Instruments 2 Directive (MiFID 2) and the European Central Bank’s guide on climate-related and environmental risks. This framework is complemented by non-financial transparency mechanisms, such as the European Taxonomy and the Corporate Sustainability Reporting Directive (CSRD). Groupe BPCE also considers the environmental and social laws of the jurisdictions in which it operates as parts of its reference framework. In France, this includes the Energy and Climate act, the Mobility Orientation act and the AGEC act (against waste and for a circular economy);
- The framework of standards and best market practices, which Groupe BPCE applies voluntarily and which is based on international references and standards, such as the Sustainable Development Goals (UN), the United Nations Global Compact (UN), the Equator Principles (project financing), etc., as well as on market initiatives such as the Principles for Responsible Banking.
Groupe BPCE’s environmental, social and governance risk management framework aims to ensure compliance with the methodological standards and constraints set by this reference framework while still reflecting Groupe BPCE’s risk appetite.
- Physical risks arising from the impacts of extreme or chronic climatic or environmental events (biodiversity, pollution, water, natural resources) on the activities of Groupe BPCE or its counterparties;
- Transition risks arising from the impacts of the transition to a low-carbon economy, or one with a lower environmental impact, on Groupe BPCE or its counterparties, including regulatory changes, technological developments, and the behavior of stakeholders (including consumers).
Social risks arise from the impacts of social factors on Groupe BPCE’s counterparties, including issues related to the rights, well-being and interests of individuals and stakeholders (the company’s workforce, employees of the company’s value chain, communities concerned, end users and final consumers).
Governance risks arise from the impacts of governance factors on Groupe BPCE’s counterparties, including issues related to ethics and corporate culture (governance structure, business integrity and transparency, etc.), management of supplier relationships, lobbying activities and business conduct practices.
As part of its strategic planning, business line steering and risk management processes, the Groupe BPCE uses climate scenarios to assess the challenges associated with short-, medium- and long-term climate risks.
These scenarios come from leading institutions in scientific research on the climate, such as the Intergovernmental Panel on Climate Change (IPCC), the Network for Greening the Financial System (NGFS) and the International Energy Agency (IEA).
The choice of scenarios selected by the Group is based on cross-disciplinary work between the main departments involved in strategic planning and risk management. They are validated at executive management level by the relevant bodies overseeing each of the various exercises in which these scenarios are used.
Groupe BPCE mainly relies on the SSP2-4.5 (IPCC scenario) and Nationally Determined Contributions (NGFS scenario) scenarios to define a median trend for risk monitoring purposes.
For its risk assessment purposes in a deteriorated context, in stress test exercises for example, Groupe BPCE also relies on alternative, more extreme scenarios: SSP5-8.5 scenario (IPCC scenario) on physical risk and Net Zero 2050 and Delayed Transition scenarios (IPCC scenarios) on transition risk.
The characteristics of the main climate scenarios used by Groupe BPCE are described in the table below.
Topic RCP 4.5 RCP 8.5 Nationally Determined
ContributionsNet Zero Transition Delayed Transition Source IPCC IPCC NGFS NGFS NGFS Use of ESG risks Assessment of physical risk Assessment of physical risk Assessment of transition risk Assessment of transition risk Assessment of transition risk Demographics Stabilized growth around 2050 Sustained growth Moderate growth Stabilization or slight decrease Sustained growth Technology Adoption of more sustainable technologies, transition to renewable energies Slow adoption of more sustainable technologies, continued dependence on fossil fuels Gradual adoption of more sustainable technologies, innovations supported by adapted policies Acceleration of innovation in more sustainable technologies, strong political and financial support Delayed adoption of more sustainable technologies Societal Increased awareness of environmental issues, proactive policies Growing inequalities, potential social struggles Growing awareness of environmental issues, citizen engagement Strong social mobilization in favor of the transition, supported by appropriate policies Growing inequalities and social resistance Economic growth Moderate economic growth Rapid economic growth, high energy consumption Moderate economic growth Sustainable economic growth Rapid but unsustainable economic growth Greenhouse gas emissions Significant emission reduction from 2040 Rapidly rising emissions throughout the 21st century Gradual emission reduction Rapid and significant emission reduction Continued increase in short-term emissions, with late stabilization Groupe BPCE also draws on the scenarios developed by the International Energy Agency. These scenarios, specific to each sector, determine the technological breakthroughs necessary to achieve carbon neutrality by 2050.
In the context of defining its decarbonization objectives and trajectories, Groupe BPCE has decided to use the International Energy Agency’s Net Zero Emissions 2050 reference scenario (NZE 2050 scenario), published in 2021, to define the targets for aligning its exposure portfolios with the most carbon emitting sectors. This scenario plots sector trajectories compatible with limiting global warming to +1.5°C, in accordance with the most ambitious objectives of the Paris Agreement. When this scenario is not sufficiently precise and granular to be reconciled with the composition of certain sector portfolios, the Group may have to use alternative scenarios by ensuring the quality of the organizations that produce them and their compatibility with the +1.5°C target without or with limited overshoot of the global carbon budget.
While the reference base generally used is the International Energy Agency curve, the use of scientific reference curves adapted to each sector and the geographies in which Groupe BPCE’s activities are present has made it possible to take into account the specificities of the sectors considered. These scientific scenarios are usually expressed in emission intensity. They are also used by the vast majority of the customers that Groupe BPCE finances in these sectors. This shared use of a scientific reference base makes it possible to optimize the dialogue between the bank and its customers.
Groupe BPCE has developed a knowledge base shared between the main internal stakeholders in the ESG risk management framework (in particular the Impact department and the ESG Risk department). This knowledge base is intended to serve as a reference framework within Groupe BPCE on ESG issues related to the main economic sectors and to feed into the work carried out downstream to integrate ESG risks into strategic discussions and the various Groupe BPCE risk management frameworks.
This knowledge base takes the form of sectoral factsheets bringing together the main ESG issues of the most ESG-sensitive economic sectors. They are based on the current state of scientific, technological and social knowledge gathered by Groupe BPCE’s experts. This knowledge base is regularly updated and expanded in order to follow the sectoral dynamics observed.
The acquisition, dissemination and use within Groupe BPCE of data related to the ESG characteristics of its counterparties and its own activities is a critical issue, particularly for the purposes of portfolio management and ESG risk monitoring. They also play a major role in enriching customers’ non-financial knowledge, enabling the implementation of appropriate support actions depending to the customer segment.
The management of data relating to ESG issues (ESG data) falls within the general framework of Groupe BPCE’s data standards and policies, in particular those relating to the BCBS239 regulations. In addition, an ESG data governance standard has been defined to clearly specify the roles and responsibilities of the various players, as well as the specific requirements for the collection, aggregation and validation of ESG data.
Depending on its needs, Groupe BPCE has several channels for acquiring ESG data on its counterparties:
- Direct collection of data from its counterparties through specific questionnaires and dedicated strategic dialogues;
- Collection of data from non-financial information published by its counterparties, for example in their CSRD report for the European companies concerned;
- Public databases (open data), made available by governmental institutions such as the French Environment and Energy Management Agency (Agence de l’environnement et de la maîtrise de l’énergie - ADEME) or specialist non-governmental organizations (NGOs) such as World Wildlife Fund (WWF) or Urgewald;
- Specialized external data providers such as non-financial or general rating agencies.
In the absence of counterparty-specific data, Groupe BPCE may use approximations (e.g. sector averages) and estimates to assess the trajectory of its portfolios and its risks. This approach is used in particular for individual, professional and small business customers, as it is more challenging to obtain their data compared to obtaining that of large companies, which are subject to publication obligations.
To meet the challenges pertaining to the collection and quality of ESG data, in 2025 Groupe BPCE defined a roadmap making it possible to cover the main needs in terms of customer data, while complying with its commitments in terms of risk and commercial standards. The orientations related to this roadmap and the monitoring of its execution are carried out by the Executive Management Committee, as part of the monitoring of the VISION 2030 strategic project, and by the Environmental Transition Strategy Committee.
-
16.2 Governance
Groupe BPCE’s Supervisory Board oversees and puts into perspective Groupe BPCE’s ESG strategy, with the support of its specialized committees:
- The Risk Committee assesses the effectiveness of the internal control and ESG risk management frameworks within Groupe BPCE;
- The Cooperative and CSR Committee oversees the sustainability reporting and non-financial communication, in conjunction with the Audit and Investment Committee and the Impact program;
- The Audit and Investment Committee oversees the non-financial communication and the inclusion of ESG risks in Groupe BPCE’s financial statements, in conjunction with the Cooperative and CSR Committee (joint committee meeting once a year);
- The Remuneration Committee reviews proposals aimed at integrating ESG issues and risks into the executive remuneration policy.
Groupe BPCE’s directors receive regular training on the challenges that ESG risks represent for the Group, the evolution of the scientific context, the regulatory expectations associated with these risks, and the strategy and risk management frameworks implemented in response. In 2025, four specific training sessions on ESG impact and risks were offered to Groupe BPCE’s directors, enabling them to share ESG issues for financial institutions and actions relevant to supporting clients.
The Executive Management Committee of Groupe BPCE validates the ESG strategy, ensures its implementation and oversees the Group’s ESG risk management. To this end, it relies on committees dedicated to addressing these issues:
- The Environmental Transition Strategy Committee, chaired by the Chairman of the Management Board, validates the Group’s Impact strategy in terms of environmental transition and steers its implementation (action plans, indicators, measurement of the Group’s ambitions). This oversight includes the monitoring of ESG indicators;
- The ESG Risk Committee, chaired by Groupe BPCE’s Chief Risk Officer, brings together the heads of Groupe BPCE’s business divisions, the Risk and Finance functions and the Impact department, as well as two of the Group’s executive managers. This decision-making and monitoring committee deals with ESG issues from a cross-functional perspective for Groupe BPCE and its various business lines. It is responsible for the consolidated monitoring of Groupe BPCE’s ESG risks and for ensuring the implementation of the organizational and operational strategy regarding ESG risk management. It validates the main methodological choices and scenarios used within the Group in the context of ESG risk management. It reviews and validates the assessment of the materiality of ESG risks, gives its opinion on Groupe BPCE’s ESG risk appetite and monitors the key risk indicators and associated limits.
In addition, subjects associated with ESG risks are also handled by other Executive Management level committees, which include these subjects within their remit. This concerns in particular:
- the Group Risk and Compliance Committee, which integrates ESG risks into Groupe BPCE’s consolidated risk monitoring;
- the Standards and Methods Committee, which reviews and approves the changes in standards necessary for the implementation of the ESG risk management framework;
- the committees dedicated to the risk functions that integrate the relevant ESG risk factors within their area of expertise: Group Credit and Counterparty Committee, Group Non-Financial Risk Committee, Group Market Risk Committee, Group Reputation Committee;
- the Group Regulatory Watch Committee, which monitors ESG regulations and ensures that regulatory requirements are met;
- the New Products and New Activities Committee, which incorporates issues related to ESG strategy and risks and associated regulations in the assessment of new products and activities;
- the Group Asset/Liability Management Committee, which integrates the ESG strategy and risks associated with the management of Groupe BPCE’s liquidity reserve.
In the context of Groupe BPCE’s cooperative model, two committees support the definition and implementation of the ESG risk management strategy and framework by liaising with the managers of Groupe BPCE institutions:
- the Impact Committee, chaired by the Director of Impact, supports the work of defining and implementing the Impact strategy by ensuring the link with the managers of Groupe BPCE institutions. It provides cross-functional guidance on the Group’s Impact program, prior to its deployment in the institutions;
- the Risk, Compliance and Permanent Control Committee, chaired by the Chief Risk Officer, which provides guidance on the main proposed changes to the ESG risk management framework.
At an operational level, Groupe BPCE relies on committees bringing together experts on ESG issues and risks at the level of BPCE and its main entities. In particular, the Sustainable Finance Methodologies Committee, chaired by the Chief Impact Officer, defines the reference methodological approaches in terms of Sustainable Finance and ESG risks for Groupe BPCE.
The Impact department, which reports directly to the Chairman of the Management Board, is responsible for Impact VISION 2030 in terms of environmental, social and governance dimensions. It develops and deploys this expertise, and works to share and disseminate the best practices identified in all Group companies, with a view to continuous improvement. It coordinates the operational implementation of the Impact program, established as part of the BPCE VISION 2030 strategic project, by mobilizing the various stakeholders. Lastly, it ensures overall coordination and supports each sector to ensure “Impact Inside” operations, while setting up the necessary synergies.
To carry out its missions, the Impact department relies on the CSR/Impact departments of Groupe BPCE's various business lines, the Fédération nationale des Banques Populaires (FNBP), the Fédération nationale des Caisses d’Epargne (FNCE) and, at a more operational level, the CSR departments of the Group’s entities. An Impact function, coordinated and supported by the Impact department, manages and supports the sustainable transformation of the Group's business models and business lines to integrate ESG issues. Comprising all the Group’s entities and business lines, it ensures that common guidelines are developed and implemented jointly, while taking the specificities of each business model into account. It ensures the operational execution of the Impact strategic project.
Each Group institution and business line has appointed an Impact sponsor, a function member, who drives and coordinates the Impact action plan at his or her company level and participates in the co-construction momentum.
The ESG Risk department plays a central role in defining and implementing Groupe BPCE’s ESG risk supervision framework and is responsible for:
- Defining and deploying methodologies and risk measurement tools specific to ESG risks.
- Contribute to the definition of reference climate/environmental scenarios for Groupe BPCE;
- Contribute to the definition and implementation of a stress test framework on ESG risks and contribute to cross-functional risk management processes, in particular RAF/ICAAP/ILAAP, on behalf of ESG risks;
- Steer and support projects aimed at taking ESG risks into account in risk appetite, policies, processes, risk/business methodologies in all Risk functions, entities and business lines;
- Support the operational implementation of the ESG risk framework in all entities, in particular by supervising the permanent control framework related to ESG risks;
- Define and implement consolidated ESG risk monitoring dashboards and monitor sensitive individual and sector exposures;
- Produce and disseminate consolidated analyses (ad hoc or recurring) on ESG risk exposure;
- Define and develop the internal training framework on ESG risks (directors, managers, employees).
To carry out these missions, the ESG Risk department relies on a network of correspondents across all Groupe BPCE entities and institutions, in charge of supporting the deployment of the ESG risk management framework within their domain.
Given the specific challenges faced by Corporate & Investment Banking’s business lines, Natixis CIB has set up several hubs of expertise within its sales teams (Green & Sustainable Hub), Risk department and Strategy & Sustainability department. These teams contribute to Groupe BPCE’s work, in particular on large companies and specialized financing, impact and risk assessment methodologies, and are directly involved in supporting the deployment of the framework to other entities and institutions in Groupe BPCE.
The ESG risk management framework is based on the three lines of defense model in place within Groupe BPCE:
- First line of defense: the operational departments within Groupe BPCE’s various business lines and functions integrate ESG risks into their processes, policies and controls. ESG risks are taken into account in the level 1.1 and 1.2 control framework according to the risks induced by each activity;
- Second line of defense:
- – The ESG Risk department, which reports directly to Groupe BPCE’s Chief Risk Officer, establishes the reference framework (methodology and scenarios), structures, coordinates and supports the deployment of the ESG risk management framework within Groupe BPCE. These missions are carried out in collaboration with the Impact department, the other units of the Risk department, the other Groupe BPCE departments involved in ESG risk management and all Groupe BPCE entities and institutions;
- – The other risk and compliance functions incorporate ESG risks as a risk factor in the risk management and control framework, with the support of the ESG Risk department;
- – The departments in charge of permanent controls integrate the control points relating to ESG risks to ensure the monitoring and cross-functional control of the effective integration of the ESG risk management framework into policies and processes;
- Third line of defense: Groupe BPCE’s Internal Audit and the departments in charge of the internal audit include ESG risks in their review of the internal control framework to ensure the proper application of the associated risk policies, the compliance of commercial practices with risk management, and the compliance with regulatory obligations.
In 2025, Groupe BPCE set up the Impact Campus, a revised and updated training program based on three blocks: a common core based on general knowledge, advanced training modules on priority strategic themes, and modules specific to each business line. This framework brings together the up-to-date training courses available to build training plans by business line.
The VISION 2030 strategic project includes a target to train 100% of employees in ESG issues by December 31, 2026. In this context, in 2025, Groupe BPCE rolled out two e-learning training modules: “The fundamentals of impact” and “The fundamentals of ESG risks”. Additional training specifically dedicated to ESG issues and their consideration in the analysis of business models have also been provided to the teams concerned.
The Supervisory Board, through its Remuneration Committee, is responsible for setting the method and amount of remuneration for each member of the Management Board. It ensures that ESG issues are fully integrated into the remuneration policy.
The remuneration of the Chairman of the Management Board and the members of Groupe BPCE’s Executive Management Committee (excluding control functions) includes an annual variable component indexed at 40% to qualitative criteria. The allocation of this variable portion depends in part on the implementation of Groupe BPCE’s strategic ambitions on ESG issues.
On February 6, 2025, on the proposal of the Remuneration Committee, Groupe BPCE’s Supervisory Board decided to set the Management Board’s variable-compensation targets for the 2025 fiscal year by incorporating a specific criterion related to the environment, climate and decarbonization trajectories with a weighting of 5%.
Since 2022, in order to raise the employee’s awareness and involve them in the Group’s commitment to the fight against global warming, BPCE SA’s incentive scheme for employees has been partly indexed to an objective linked to Groupe BPCE’s Impact strategy (achievement of the Group’s strategic objective to reduce its direct footprint in the agreement covering the 2022-2024 fiscal years, followed by ESG training in the agreement covering 2025-2027).
-
16.3 VISION 2030 and Impact strategy
Groupe BPCE strategic project, VISION 2030, outlines the major priorities it has set for itself in order to build a growth project to serve its clients, in a society marked by four major transitions: environmental, demographic, technological and geopolitical.
Faced with this situation, Groupe BPCE is mobilizing its local and regional presence, its business lines and expertise, to enable its clients, cooperative shareholders and employees to assert their power to act and to trust in the future.
The cooperative nature of the Banques Populaires and the Caisses d’Epargne, coupled with their deep local roots, have made Groupe BPCE a positive impact financial player since its inception, which has been particularly committed to the decarbonization of the economy in recent years. Groupe BPCE’s global business lines – Natixis Corporate & Investment Banking (Natixis CIB) and Natixis Investment Managers (Natixis IM) – are positioned as key global players in transitions.
Faced with the climate emergency, the Group’s approach aims to rapidly implement and deploy measures to mitigate and adapt to the already tangible environmental and socio-economic impacts of climate change and the erosion of biodiversity. Making impact accessible to all means raising awareness and massively supporting all its clients in the environmental transition through expertise, consulting offers and global solutions.
Based on the scenarios defined by science, Groupe BPCE and its business lines are positioning themselves as facilitators of transition efforts, with a clear and ambitious objective: to finance a carbon-neutral economy by 2050 by taking action today.
The Group’s approach aims to rapidly implement and deploy measures to mitigate and adapt to environmental and socio-economic impacts. It is based on Groupe BPCE’s cooperative model, which combines local roots and commitment to society to finance the economy.
- Impact solutions:
- – For individual customers: Support energy renovation and adaptation of housing to aging and loss of autonomy by offering financing solutions and by mobilizing its role as an operator, trusted third party as well as its partnerships;
- – By offering a “Sustainable Tips and Solutions” tool in partnership with ADEME, which makes it possible to simply calculate one’s carbon footprint but also to benefit from advice and support for one’s energy renovation work, for decarbonized mobility or green savings;
- – By supporting energy renovation projects for individual homes and condominiums at each stage: energy assessment, search for subsidies, guarantee of completion of work, with pathways and financing adapted to each situation;
- – By increasing the number of financing for the energy renovation of buildings;
- – For BtoB customers: Support the transition of the business models of its customers, ranging from SMEs to the largest international companies. The Group is committed to a dedicated dialogue and a contribution of sector expertise to integrate ESG issues according to their size and economic sectors, particularly in energy infrastructure, transport, waste management and treatment, etc.; Sustainable solutions also exist for investor customers with a range of responsible investments: sustainable development savings accounts, funds with a sustainable investment objective, labeled thematic funds, etc.
- Support for the evolution of the energy mix: Faced with the climate emergency, the priority is to accelerate the advent of a sustainable energy system:
- – by positioning itself among the world leaders in debt project financing in the renewable energy sector;
- – by increasing its financing dedicated to the production and storage of green electricity;
- – by providing advice about capital raising processes to its customers, leaders in the infrastructure and equipment sector related to the energy transition, as well as innovative and fast-growing companies in the sector;
- – by advising its clients on energy transformation projects in their financing or capital raising processes;
- – by supporting the reindustrialization of regions and energy sovereignty;
- – by setting up teams of experts dedicated to low-carbon energies (solar, wind, electrolysis, etc.) and critical metals.
- Alignment of its financing and insurance portfolios with trajectories compatible with the objectives of the Paris Agreement:
- – by developing frameworks to measure carbon emissions;
- – by developing its framework for identifying and managing climate, physical and transition risks to which its clients and its own activities are subject, with a view to continuous improvement;
- – by gradually withdrawing from the most-carbon emitting activities, in particular through adapted ESG policies.
- Active and innovative issuer in sustainable finance: In its VISION 2030 strategic project, the Group has set itself the target of issuing more than five green, social or health financing instruments per year, using all the debt instruments at its disposal.
Groupe BPCE is a leading financier in the Social and Solidarity Economy sector and for local authorities, and is a major player in social housing, social entrepreneurship and microcredit.
- A player in the regions of the world where it operates: Groupe BPCE plays a strong role in local ecosystems that promote regional cohesion, supporting numerous initiatives to promote social inclusion and reduce inequalities:
- – The Banques Populaires and the Caisses d’Epargne are key players in the dynamics of the regions, notably by financing the construction or renovation of infrastructure and equipment necessary for education, health and mobility. They are the leading private financier of local authorities and the hospital sector;
- – Globally, Natixis Investment Managers and Natixis Corporate & Investment Banking are developing their Asset & Wealth Management and Corporate & Investment Banking business lines in more than 40 countries in compliance with international commitments, in terms of investment and financing.
- Committed to supporting local and national initiatives:
- – The impact of the sponsorship of the 14 Banques Populaires is measured every year via their Cooperative and Societal Footprint. This footprint identifies and values in euros the CSR and cooperative actions implemented within each bank;
- – The 15 Caisses d’Epargne deploy the utility contract in all regions of France: 100% cooperative, 100% regional and 100% useful for the economic, social and environmental development of the regions.
In order to support the transitions of its clients, according to the highest standards, Groupe BPCE has launched an internal transformation plan “Impact Inside.” To extend its impact solutions to its clients and accelerate each aspect of ESG, Groupe BPCE has undertaken a transformation of all its companies at all levels. It mobilizes its governance and employees, which it undertakes to train in ESG issues, and acts on its own activities by reducing its carbon footprint.
16.3.3 Objectives, targets and limits related to environmental and social risks and performance assessment
Groupe BPCE supports the economic transition to help mitigate and adapt to global warming. The growing awareness of stakeholders regarding the challenges related to climate change is also creating a positive dynamic of demand for sustainable solutions. The Group’s cooperative model allows it to meet client expectations and the company’s aspirations by ensuring a fair transition for each client. Its decentralized model and regional presence are real assets for supporting transitions and contributing to a fair and sustainable transformation of society.
The implementation of the VISION 2030 strategic project is monitored using key indicators corresponding to objectives to be achieved by the end of 2026. These include:
- supporting the evolution of the energy mix in the regions of the world where the Group operates by contributing to the reduction in the use of carbon-based energies through a 15% increase in new financing for renewable energy projects;
- managing the action plan to decarbonize the financing of the sectors that emit the most greenhouse gases via the implementation of absolute value or intensity targets for 2030: oil and gas, electricity production, automotive, air transport, steel, cement, aluminum, residential and commercial real estate and agriculture;
- supporting energy renovation by increasing the total annual amount of financing to €1 billion by 2026;
- assessing the reduction of our own carbon footprint.
More general indicators in terms of sustainability reflect the objectives relating to the support and awareness-raising actions deployed for our clients:
- 6 million unique visits to the “Advice and sustainable solutions” digital module for Banque Populaire and Caisse d’Epargne clients;
- ESG dialogues covering 100% of the active corporate customers (this dedicated exchange has been rolled out since the beginning of 2023 to corporate customers);
- the increase in financing granted to the Social Solidarity Economy (SSE), social housing and public sector sectors;
- the number of local social entrepreneurship projects supported.
Groupe BPCE has committed, over the long term, to developing a capacity to manage the evolution of its balance sheet by taking into account an assessment of the climate impact of its activities and of financed, invested or insured assets. This change is based, among other things, on the implementation of voluntary targets for the gradual alignment of financing, investment and insurance portfolios with trajectories compatible with the Paris Agreement's climate objectives.
In this approach, Groupe BPCE has relied on the methodological work of the Net Zero Banking Alliance initiative, an initiative launched in 2021 with the United Nations Environment Program (UNEP FI) to define and publish its decarbonization ambitions for the most carbon-intensive sectors. This alliance between banking institutions is a decisive step in the mobilization of the financial sector.
Similarly, BPCE Assurances relied on the work of the Net Zero Asset Owner Alliance (NZAOA). By issuing guidelines adapted to financial institutions, these alliances allow each financial institution, depending on the composition of its loan or investment portfolio, to define science-based targets to combat global warming. These methodologies have also enabled financial institutions to increase their transparency on the challenges of decarbonizing the economy.
This approach has enabled the Group to strengthen its knowledge of the challenges and action levers as well as the risks to which clients could be exposed. The definition of alignment targets requires:
- identifying the most carbon-intensive clients in their sector;
- estimating their transition commitment based, in particular, on their public documents on reducing their carbon emissions and strategic development prospects, as well as analyses of data suppliers and client knowledge;
- determining the evolution of portfolios by 2030 (starting from 2020) according to the targeted objectives of the business lines according to the geographies, technologies and prospects of the clients;
- deducing the absolute emissions or average carbon intensities of the portfolios according to the sectors and any action plans to achieve the Net Zero targets.
Since December 2022, Groupe BPCE published alignment targets for two sectors among those with the highest emissions: electricity production and the oil & gas sector. In December 2023, Groupe BPCE broadened its ambition to reduce carbon emissions by publishing new targets for 2030 for three additional sectors within the scope of Corporate & Investment Banking (Natixis CIB): automotive, steel and cement. Lastly, since June 2024, the trajectories of the real estate (residential and commercial), air transport and agriculture sectors have also been the subject of action plans aimed at reducing financed emissions.
For each sector, the carbon emission reduction targets, and the associated action plans are detailed in periodic publications.
With regard to the environment, excluding climate issues and in particular those relating to biodiversity, the Group is taking concrete steps to preserve it, specifically by adopting policies and practices to promote actions that respect biodiversity. Despite the absence of adapted scientific calculation methods and market benchmarks to assess the impact of these activities, the Group aims to adopt a proactive approach, by actively participating in local work aimed at overcoming these methodological limitations and identifying relevant action levers. To this end, in 2024, Groupe BPCE renewed the commitment previously made by Natixis by joining act4nature international, a coalition that mobilizes companies, public authorities, scientists and environmental associations committed to the protection of biodiversity. In addition, the Group has set concrete objectives in its activities as a banker, insurer and investor, structured around five areas: the integration of biodiversity issues into the strategy, the assessment of impacts and dependencies on nature, the reduction of pressure on ecosystems, the mobilization of a share of financial resources in favor of nature, and the strengthening of knowledge in terms of biodiversity.
In asset management activities, for Natixis Investment Managers, integrating ESG factors into the investment process makes it possible to make more informed decisions, better understand company risks, identify sustainable investment trends, and select companies that contribute to these trends. This approach aims to create long-term value for clients. Several affiliates have developed dedicated non-financial research capabilities and have integrated sustainability criteria into their investment decision-making models. They rely on proprietary systems and raw data to establish their own scoring models and methodologies that they can then transparently explain to clients.
Each Natixis Investment Managers management company is responsible for its investment process and is ultimately responsible for integrating environmental, social and governance factors in compliance with their fiduciary duty. European asset management companies have developed responsible investment policies that explain their overall ESG approach, provide detailed guidance on the integration of environmental factors, and explain their sectoral and/or exclusion policies. The majority of non-European affiliates have developed a global responsible investment approach that formalizes their commitment to integrate material environmental, societal and governance factors into their investment processes. They implement specific restrictions at the request of clients.
-
16.4 Environmental, social and governance risk management framework
The ESG Risk department coordinates the implementation of the ESG risk management framework at Groupe BPCE level through a dedicated program. This program is part of the VISION 2030 strategic project and defines a multi-year action plan (2024-2026) aimed at covering all regulatory requirements relating to ESG risk management. It is directly linked to the strategy and actions implemented by the Impact program. This program is monitored quarterly by Groupe BPCE’s ESG Risk Committee and Supervisory Board.
Groupe BPCE has implemented a process to identify and assess the materiality of ESG risks in order to structure its understanding of the risks to which it is exposed in the short, medium and long term and to identify priority areas for strengthening the risk management framework.
This process is coordinated by the ESG Risk department, under the supervision of Groupe BPCE’s ESG Risk Committee and Supervisory Board. It is subject to an annual review to update Groupe BPCE’s portfolios, scientific knowledge and underlying methodologies.
- Creation of the ESG risk inventory;
- Documentation of ESG risk transmission channels to other risk categories;
- Assessment of the materiality of ESG risks in relation to other risk categories;
- Input into cross-functional risk management exercises (risk appetite framework, ICAAP, ILAAP).
The scope of risks taken into account in the process of identifying and assessing the materiality of ESG risks only covers climate and environmental risks. Social and governance risks are directly integrated into the cross-functional risk appetite framework. Methodological work to extend it to social and governance risks is underway and will be completed in 2026.
Groupe BPCE has set up an environmental risk inventory making it possible to define the specific hazards covered. This inventory is based on current scientific knowledge and reference regulatory texts (e.g. European taxonomy) and aims for the most exhaustive possible representation of risks.
With regard to physical risks, the inventory distinguishes between physical risks related to the climate, biodiversity and ecosystems, pollution, water and marine resources, and the use of resources and the circular economy. The climate-related hazards are divided into acute or chronic hazards related to temperature, wind, water, solid mass and environmental hazards. Environmental risks are divided into those that disrupt regulation services (protection against climate risks, support for production services, mitigation of direct impacts) and those that disrupt supply services (in terms of quality or quantity).
With regard to transition risks, the inventory distinguishes between risks related to regulatory changes, technological developments, stakeholder expectations and changes in their behavior.
A social and governance risk inventory is being developed and is expected to be implemented in the course of 2026.
ESG risks are risk factors underlying the other risk categories to which Groupe BPCE is exposed, namely credit and counterparty risks, market and valuation risks, insurance risks, structural balance sheet risks, strategic and business risks and non-financial risks (operational risks, reputational risks, non-compliance risks, etc.), as identified in Groupe BPCE’s risk taxonomy.
Groupe BPCE has conducted work to systematically identify and describe the transmission channels linking climate and environmental risk factors to the main risk categories of Groupe BPCE’s risk taxonomy. For this exercise, Groupe BPCE relied on its internal experts as well as on the impact mapping carried out by leading institutions such as the NGFS, SBTN and the OCARA methodology.
The transmission channels describe the implications of climate risks on activities and business models, which are reflected in financial variables at the macroeconomic or microeconomic level and ultimately impact Groupe BPCE’s risk exposure. They may materialize directly, in connection with Groupe BPCE’s own activities, or indirectly, through the counterparties to which Groupe BPCE is exposed as part of its financing or investment activities. They are summarized in the diagram below.
The definition of transmission channels related to social and governance risks is being developed and will be implemented in the course of 2026.
Based on the transmission channels identified, Groupe BPCE assesses the materiality of climate and environmental risks in relation to the main risk categories to which it is exposed. This assessment distinguishes between physical risks and transition risks. It is carried out according to three time horizons: short-term (1 to 3 years, financial planning horizon), medium-term (3 to 7 years, strategic planning horizon), and long-term (~2050).
This assessment is based on quantitative or qualitative indicators, which, when available, allows to assess the exposure to risks from a sectoral and geographical point of view, as well as on expert assessments. The internal experts involved in these assessments include the ESG Risk department, the other functions of the Risk department, as well as representatives from the other departments (Impact, Compliance, Legal) and the business lines concerned.
In 2025, the materiality analysis was carried out at the Groupe BPCE level, covering both climate and environmental risks. It was also applied at the level of the main operating entities, based on common assumptions and a shared analytical framework.
The summary of the materiality assessment of climate and environmental risks carried out in 2025 at Groupe BPCE level is presented below.
CLIMATE AND ENVIRONMENTAL RISKS Physical risks Transition risks Short term
1 to 3 years
(2026)Medium term
3 to 7 years
(2030)Long-term
> 7 years
(2050)Short term
1 to 3 years
(2026)Medium term
3 to 7 years
(2030)Long-term
> 7 years
(2050)Credit and counterparty risk Low Low Moderate Low Moderate Moderate Market and asset valuation risk Low Low Low Low Low Low Own investment risk Low Low Low Low Low Low Structural ALM risks Low Low Low Low Moderate Low Insurance risk - technical Moderate Moderate Moderate Low Low Low Insurance risk - financial Low Moderate Moderate Low Moderate Moderate Strategic business and ecosystem risks - revenue Low Low Low Low Low Low Strategic business and ecosystem risks - asset management Low Low Moderate Low Low Moderate Operational risk (excluding legal risk) Low Low Moderate NA NA NA Legal risk Low Low Low Moderate Moderate Low Reputational risk Low Low Low High High Moderate Non-compliance risk NA NA NA Moderate Moderate Low The work to identify ESG risks and assess their materiality feeds into the main components of Groupe BPCE’s risk appetite as part of this framework's annual review process.
Groupe BPCE’s risk framework includes an “Ecosystem risk” category, which groups together environmental risks by distinguishing between physical and transition risks, social risks and governance risks
The materiality assessment of these risk categories as part of the risk appetite framework is defined by cross-referencing the materiality of the main risk categories to which Groupe BPCE is exposed (assessed as part of the annual process of defining the risk appetite) and the materiality of climate and environmental risks in relation to these risk categories (assessed according to the process described above). For social and governance risks, the assessment is carried out on an expert basis as part of the risk appetite definition process only.
In 2025, the materiality of physical and transition environmental risks was assessed at level 1 out of 3 (“significant”) for Groupe BPCE, while the materiality of social and governance risks was assessed at a level of 0 out of 3 (“low”).
In its risk appetite framework, Groupe BPCE has introduced indicators to manage the concentration of physical and transition risks in its financing portfolios.
A framework for the transitional risk appetite on the residential real estate portfolio was put in place in 2024. It is based on an indicator based on the share of financed properties with a deteriorated Energy Performance Assessment (class F or G) in the inventory. In 2026, a framework for transition risk on the professional, corporate and specialized financing portfolio will be added to the framework This indicator is based on internal transition risk assessment methodologies. This indicator replaces the indicator for monitoring sectors qualified as contributing significantly to greenhouse gas (GHG) emissions, previously under observation. At an operational level, indicators subject to limits are also being set up with regard to physical risks on professional loans, corporate customers and specialized financing exposures, on the one hand, and on residential real estate exposures, on the other hand.
In addition to financing portfolios, the transition risks related to liquidity and reputation risks are also controlled.
Some Group entities have also implemented additional management frameworks, aligned with their own challenges, in order to guarantee risk management adapted to their specificities.
Groupe BPCE takes physical risk into account in its internal capital adequacy assessment process (ICAAP) by applying adverse scenarios to heat waves, drought and floods. The assessment of the transition risk is based on delayed and orderly transition scenarios as well as on a specific scenario linked to the legislation on the energy performance of real estate assets in France. The assessment of the economic capital requirements includes a quantification of the impacts on the residential real estate portfolio and the corporate loan portfolio.
Groupe BPCE also takes into account physical and transition risks in its internal liquidity adequacy assessment process (ILAAP). The risk quantification is based primarily on the modeling of the impact of physical and/or transition risks on clients and investors, as well as of the impact of a negative ESG event on the Group’s reputation. The impact of a regulatory change relating to the eligibility of central bank assets based on climate criteria is also integrated.
In order to strengthen its ESG risk assessment capabilities, Groupe BPCE has adopted specific methodologies to assess the ESG risks associated with its portfolios in a systematic and consistent manner. These methodologies are based on internal and external expertise and reflect the state of scientific knowledge, current technologies, regulatory environment and market practices. They are regularly reviewed, supplemented and enhanced to gradually improve the accuracy of ESG risk assessment and take into account changes in the overall context.
The physical and transition risk assessment methodologies deployed by Groupe BPCE are based on quantitative data supplemented by qualitative analysis where appropriate. They are described in the paragraphs below.
In addition, work has been undertaken to update the social and governance risk assessment methodologies, which are expected to be implemented in the course of 2026.
In order to strengthen the sensitivity and robustness of its assessments of the physical risk associated with its professional and corporate financing exposures, the Groupe BPCE developed in 2024 a methodology to assess the vulnerability of these exposures to physical risks.
This internal methodology allows to take into account the intrinsic vulnerability of a sector to physical risks and the exposure of a given geographic area to these same hazards. It is currently based on a granular sectoral level (NACE2) and a national or regional geographic grid covering the countries in which Groupe BPCE has a particular concentration of exposures (France, United States). Six physical climate risks are currently covered, which are among the most representative for Groupe BPCE, and can be simulated under different scenarios and time horizons.
This methodology was deployed in the internal risk management tools during the course of 2025. The addition of risks related to environmental themes (biodiversity, water and marine resources, pollution) will be made in 2026.
Given its high exposure to residential real estate portfolio, Groupe BPCE has developed a simulation tool for the physical risks to which its financed assets are exposed. This tool takes into account the exact coordinates of the asset to assess its exposure to climate hazards, and certain characteristics to estimate its vulnerability and determine the estimated damages under different scenarios and time horizons. At this stage, this tool covers mainland France and Corsica and the two main physical risks on this portfolio (drought - shrink-swell and floods).
In order to enhance the granularity and robustness of its transition risk assessment associated with its professional and corporate financing exposures, Groupe BPCE developed in 2024 a granular analysis methodology for the sensitivity of the different economic sectors to this risk.
This internal methodology allows to assign a sectoral score reflecting the transition risk associated with a given economic sector, taking into account the carbon emissions and the main environmental impacts of the companies in the sector. It has been developed consistently with the Green Weighting Factor methodology (described below), which applies at the company or financed project level. Given the predominant share of French companies in Groupe BPCE’s exposure portfolio (excluding Natixis), this methodology is focused on the parameters corresponding to the French economy.
This methodology was deployed in the internal risk management tools during the course of 2025. The specificities of other geographic areas in terms of transition risk for the main business sectors concerned will be taken into account in 2026.
To assess the transition risk on its residential real estate portfolio, the Groupe BPCE relies on the Energy Performance Certificate (EPC) of the financed real estate assets. The EPC of financed assets in France is collected systematically, allowing to capture both the risk on the repayment capacity of the loan in the event of an increase in energy expenditure, or expenses related to the financing of energy performance improvement, and the risk of loss of value of the asset due to a deteriorated EPC, making it potentially unfit for rental under current regulations.
Groupe BPCE uses the Green Weighting Factor (GWF) methodology, developed by Natixis CIB, to assess the transition risk related to its counterparties and financed projects.
Using a seven-color rating scale ranging from dark brown to dark green, the GWF assesses the climate impact of transactions, while taking into account the risk of the most material non-climate-related environmental externalities (water, waste, biodiversity, pollution). For the Natixis CIB scope, this assessment is carried out on a granular basis for each of the financing exposures on the balance sheet for all banking products (loans, guarantees, sureties, documentary credits) regardless of their maturity, in all geographies and for all sectors of activity except the financial sector and administration. The GWF methodology is also adapted to corporate and dedicated financing.
- The measure of induced decarbonization (CO2 Scopes 1, 2 and 3);
- The contribution to the transition made by certain clients or active projects, with the notion of avoided emissions;
- The exposure to the most material non-climate environmental risks;
- A forward-looking view of clients’ performance, enabling us to assess their transition potential;
- A set of new indicators useful for steering the decarbonization strategy of Corporate & Investment Banking and for regulatory reporting;
- The non-financial reporting needs of investor clients.
The operational management of Natixis CIB’s climate trajectory is based, in particular, on data from the Green Weighting Factor (GWF). This management tool is used periodically and at several levels:
- For credit decisions at the transactional level;
- For strategic dialogue with clients;
- For strategic planning: definition of annual color targets for each business line and sub-business line;
- For commercial planning: definition of framework for assessing the individual performance of the financing origination teams;
- For capital allocation and active portfolio management;
- For risk appetite management.
To continuously improve this analysis tool, Corporate & Investment Banking carried out a major overhaul of its decision trees for the dedicated financing part, which will be deployed through a new tool. This overhaul allows for an increased coverage of the scope of analyzed financing and improves the relevance of the assessments of each transaction (based on feedback obtained from users since 2020).
Groupe BPCE is gradually incorporating ESG risk factors into its operational decision-making processes and risk monitoring and oversight frameworks. This approach draws on the risk management frameworks in place in the bank’s main risk divisions, as described in this section.
Groupe BPCE’s credit risk policies include eligibility criteria or points of vigilance relating to ESG issues and associated risks when they are relevant for a given sector. These criteria are used to guide the analysis of financing applications on these aspects. They are compiled and regularly updated from the ESG sectoral knowledge base developed by Groupe BPCE (see above), in coordination with Groupe BPCE’s entities and institutions as part of the regular updating of credit policies.
As part of the local implementation of credit policies, Groupe BPCE entities and subsidiaries are able to reinforce their local policy through additional criteria to take into account ESG risks specific to their operational and commercial context.
When relevant, Groupe BPCE’s credit policies refer to the Group’s voluntary commitments and, in particular, to the ESG sector policies. These policies require that the defined exclusion criteria set are taken into account in the credit decisions process. The ESG sector policies currently in force within Groupe BPCE are described in detail in the Group’s Sustainability report.
Groupe BPCE incorporates ESG issues and related risks into its strategic dialogue with the Corporate customers of its retail banking networks. An “ESG dialogue” tool was built internally and rolled out to sales teams to address the main challenges and commitments of Corporate customers on environmental (climate and biodiversity), social and governance issues. This tool allows to enrich client knowledge from the perspective of ESG issues and associated risks and to feed the analysis of the client’s risk profile, where applicable.
This approach was strengthened in 2025 in order to take into account more precisely client issues and the risk mitigation approaches implemented. In addition, a sectoral dimension has been introduced to specifically cover ESG issues and associated risks for some priority sectors for Groupe BPCE.
Groupe BPCE has an ESG risk rating deployed across the entire Corporate portfolio, covering SMEs/mid-sized companies and large companies. This ESG risk rating is independent of the credit rating and provides an indication of the counterparty’s sensitivity to ESG risks. It is made available to credit analysts and included in the files presented to the decision-making committees. For large Corporate customers, the rating methodology is based on a detailed questionnaire covering the customer’s physical and transition climate risks. The ESG risk rating of SME/mid-sized company customers is based on geo-sectoral ESG risk assessments (see above).
In addition, the Green Weighting Factor score (see above) assigned to the counterparty and the transaction (in the case of dedicated financing) is also included in the financing file. This framework is now deployed within Natixis CIB, CEGC and several subsidiaries of the FSE division.
The assets financed by the retail banking networks are also subject to a sustainability qualification in parallel with the credit granting process. The approach makes it possible to assess the compliance of the financed assets with the criteria of the European taxonomy and to provide customers with a certificate relating to the sustainability of the assets.
Groupe BPCE has implemented an analysis of non-financial risks that is integrated into the credit granting process and the annual review of counterparties. The conclusions of this analysis are reported to the decision-making bodies and taken into account when assessing the counterparty’s risk profile and the planned transaction.
Within the retail banking networks, the analysis of non-financial risks is integrated into all files presented to the main credit committee. It is notably based on the information collected as part of the ESG dialogue, on the ESG risk rating, as well as on the sectoral knowledge of ESG issues made available to credit analysts. It also includes a review of any controversies likely to affect the client and a review of the compliance with ESG sector policies. The analysis aims to highlight the material ESG risks that could have a significant impact on the counterparty’s financial statements so that they can be taken into account in the overall assessment of the credit profile and in the granting decision.
Within Natixis Corporate & Investment Banking, the non-financial risk analysis approach is gradually being rolled out across all of Natixis CIB’s main counterparties. This analysis is based on the customer on-boarding process, which includes a check on compliance with the applicable ESG sector policies and an assessment of any controversies associated with the client. During the granting process or annual review, these elements are supplemented by the climate and environmental risk assessment, which is integrated into the detailed analysis of the ESG risks to which the client is exposed. All the elements are presented through an ESG risks opinion, included in the file presented to the credit committee.
As part of the Equator Principles, Natixis CIB applies a market methodology that aims to assess the environmental and social risks of projects financed and the management of these risks by clients, regardless of their business sector. Since October 2020, Natixis CIB has applied the amended version of the Principles (EP Amendment IV), which includes more exhaustive criteria regarding respect for human rights (including the rights of indigenous communities) and requires the analysis of physical and transition climate risks.
The borrower is therefore required to: assess the physical risks associated with climate change for most projects, carry out an assessment of the climate transition risks and an analysis of less greenhouse gas intensive alternatives for projects with CO2 equivalent emissions of at least 100,000 metric tons per year in total. Depending on the risks identified and the nature of the associated impacts, mitigation measures are requested of the client. They are covered by specific clauses in the financial documentation (“covenants”).
Groupe BPCE’s incident tracking and operational risk monitoring tool makes it possible to specifically identify incidents related to climate and environmental risks, thus facilitating the continuous monitoring of their number and their financial repercussions.
As a preventive measure, as part of its business continuity framework, Groupe BPCE assesses the climate and environmental risks to which its main operating sites (head offices and administrative buildings) are exposed. These risks are taken into account as part of the business continuity plans defined at the level of Groupe BPCE and its entities. These define the procedures and resources to be implemented in the event of natural disasters in order to protect employees, assets and key activities and ensure the continuity of essential services.
Groupe BPCE’s essential, critical or important service providers (PECI) are also subject to an assessment of their business continuity plan, which must take into account the climate and environmental risks to which they are exposed.
The management of reputational risk arising from ESG issues is fully integrated into the overall reputational risk management framework described in the dedicated section of the Pillar III report.
ESG issues are the subject of particular attention in Groupe BPCE’s main operational decision-making processes, such as credit granting or purchasing processes, in order to ensure compliance with its voluntary commitments (ESG sector policies in particular) and to identify controversies likely to involve the Group. Specific crisis management mechanisms are also in place.
Reputation events related to ESG issues are subject to specific monitoring at Groupe BPCE level, carried out jointly by the Communication department and the ESG Risk department.
The legal risk management framework relating to ESG issues is part of Groupe BPCE’s overall legal risk management framework, as well as the operational risk management framework, which includes the management of litigation and reputation risks. These frameworks define the governance mechanisms and procedures for escalating identified or actual litigation risks within Groupe BPCE.
The management of litigation risks in connection with ESG issues, in particular climate and environmental issues, is based in particular on a monitoring framework implemented by the Legal department on litigation affecting large corporations and in particular financial institutions. Based on this monitoring, a quantification of the risk, through the definition of fictitious standard disputes to which the Group could be exposed, is carried out and integrated into the overall quantification of Groupe BPCE’s legal risk.
The risk prevention and control framework is based on the existing decision-making processes and aim at reducing exposure to the risk of greenwashing and the risk of non-compliance with voluntary commitments, as well as to potential failures in the exercise of the duty of care.
Investments in bonds for Groupe BPCE’s liquidity reserve are subject to an ESG framework in order to mitigate ESG and reputational risks. This framework consists of:
- A minimum percentage of “sustainable” securities (Green, Social, or Sustainable) held in the liquidity reserve;
- Exclusion from the investment scope of issuers with a downgraded non-financial rating;
- Exclusion from the investment scope of issuers whose activity does not comply with the criteria of Groupe BPCE’s ESG sector policies.
In order to identify potential sources of ESG risks in the analysis of proprietary investments in Private Equity and Non-Operating Real Estate, an ESG data collection and risk analysis process is integrated into the due diligence carried out when preparing investment files.
Natixis CIB has set up a monitoring framework for its main market exposures by underlying asset, sector or geographic area. The exposures to market risk are monitored by a counterparty rating aimed at highlighting the potential concentration of risks. To date, no significant concentration related to ESG criteria was identified in the context of short-, medium- or long-term market risks.
Additional work on stress scenarios is underway to enhance the assessment and monitoring of ESG risks in trading books.
Due to the nature of its business and its management horizons, BPCE's insurance companies attach importance to the integration of sustainability risks, particularly environmental risks, in its risk management framework.
In accordance with the regulations in force, BPCE's insurance companies incorporate environmental risks at each stage of the risk management process, from their identification to their assessment and then their mitigation.
Climate and non-climate environmental risks are integrated into a risk mapping specific to insurance, distinguishing between physical and transition risks, on the one hand, and short-, medium- and long-term horizons, on the other hand. Quantification of risks is an essential component of BPCE's insurance companies approach, which is gradually incorporating the concept of dual materiality.
Natixis Investment Managers (Natixis IM) recognizes the importance of ESG risks, in particular climate risks, and their potential impact on investment portfolios.
Most affiliates have set up systems for measuring the ESG and climate risk exposure of the assets under management, allowing for greater transparency in the management of these issues.
Each Natixis Investment Managers management company is responsible for its investment process and is ultimately responsible for integrating environmental, social and governance factors in compliance with their fiduciary duty. European asset management companies have developed responsible investment policies that explain their overall ESG approach, provide detailed guidance on the integration of environmental factors, and explain their sectoral and/or exclusion policies. The majority of non-European affiliates have developed a global responsible investment approach that formalizes their commitment to integrate material environmental, societal and governance factors into their investment processes. They implement specific restrictions at the request of clients.
Several affiliates have developed dedicated non-financial research capabilities and have integrated sustainability criteria into their investment decision-making models. They rely on proprietary systems and raw data to establish their own scoring models and methodologies.
The most advanced affiliates are developing methodologies for statistical measurement (Value at Risk type) of climate risks. In this context, some asset management companies use external data providers to access these indicators for a specific asset class (e.g. MSCI’s Real Estate Climate Value at Risk) or to access physical and transition scenarios to assess the potential impact of future events on the portfolios.
In addition, an ESG risk management policy has been implemented by Natixis Investment Managers. This policy establishes the supervision of these risks by an independent second line of defense, in particular as part of the categorization of funds and investment processes, and the definition of escalation processes within the affiliates and the Natixis Investment Managers holding company.
Natixis Investment Managers also uses data from external suppliers to calculate and monitor ESG and climate risk indicators for its portfolios on a monthly basis.
ESG risks are monitored on a consolidated basis at Groupe BPCE level, through a dashboard produced quarterly by the ESG Risk department and presented in the ESG Risk Committee.
The key risk indicators monitored through the ESG risk dashboard focus on the main primary risks and cover in particular the following points:
- Credit risk: indicators of sectoral concentration (corporate and professional portfolio) or assets (residential real estate portfolio) most sensitive to physical and transition risks;
- Financial risk: concentration by ESG rating of the liquidity reserve and the completed transactions;
- Liquidity risk: monitoring of the eligible assets available for the Green Building and Social refinancing schemes;
- Insurance: monitoring of indicators relating to climate claims within the Insurance Activities;
- Asset management: monitoring of fund concentration with regard to ESG criteria;
- Operational risk: monitoring of operational risk incidents related to ESG risk events;
- Reputational risk: monitoring of ESG events impacting the Group’s reputation.
In addition, dashboards have also been set up to monitor the gradual deployment of the framework. In particular, the hedging of credit exposure portfolios by tools, such as the ESG dialogue, is monitored.
-
16.5 Cross-reference table with regulatory reporting requirements
Economic strategy and processes Corresponding chapter a) Economic strategy of the institution to integrate environmental factors and risks, taking into account their impact on the business environment, business model, strategy and financial planning of the institution 16.3 VISION 2030 and Impact strategy b) Objectives, targets and limits for the assessment and management of the environmental risk in the short, medium and long term, and assessment of performance with regard to these objectives, targets and limits, including forward-looking information relating to the definition of the strategy and economic processes 16.3.3 Objectives, targets and limits related to environmental and social risks and performance assessment c) Current investing activities and (future) investment targets in favor of environmental objectives and activities aligned with the EU taxonomy 16.3.3 Objectives, targets and limits related to environmental and social risks and performance assessment d) Policies and procedures for direct and indirect dialog with new or existing counterparties on their strategies for mitigating and reducing environmental risks 16.4.4 Integration of ESG risks into the risk management framework Governance e) Responsibilities of the management body in establishing the risk tolerance framework and in overseeing and managing the implementation of the objectives, strategy and policies defined in the context of environmental risk management, covering relevant transmission channels 16.2 Governance f) Integration by the management body of the short-, medium- and long-term effects of environmental factors and risks into the organizational structure, both within the institution’s business lines and internal control functions 16.2 Governance g) Integration of measures to manage environmental factors and risks in the internal governance systems, including the role of committees, the distribution of tasks and responsibilities and the feedback circuit between the risk management function and the management body, covering the relevant transmission channels 16.2 Governance h) Environmental risk reporting channels and reporting frequency 16.4.5 ESG risk monitoring and reporting framework Risk management i) Alignment of the remuneration policy with the institution’s environmental risk objectives 16.2.5 Remuneration policy j) Integration of the short-, medium- and long-term effects of environmental factors and risks into the risk tolerance framework 16.4.2 ESG risk identification and assessment process k) Definitions, methodologies and international standards underlying the environmental risk management framework 16.1 Definitions and reference framework l) Process for identifying, measuring and monitoring activities and exposures (and, where applicable, collateral) sensitive to environmental risks, covering the relevant transmission channels 16.4.3 ESG risk measurement tools and methodologies m) Activities, commitments and exposures contributing to mitigating environmental risks 16.4.4 Integration of ESG risks into the risk management framework n) Implementation of tools to identify, measure and manage environmental risks 16.4.4 Integration of ESG risks into the risk management framework o) Results and conclusions drawn from the implementation of the tools and estimated impact of the environmental risk on the capital and liquidity risk profile 16.4.2 Identification and materiality assessment of ESG risks p) Data availability, quality and accuracy, and efforts to improve these aspects 16.1.5 ESG data q) Description of the limits set for environmental risks (as vectors of prudential risks) and triggering the seizure of higher levels and exclusion from the portfolio in the event of exceeding them 16.4.4 Integration of ESG risks into the risk management framework r) Description of the link (transmission channels) between environmental risks and credit risk, liquidity and funding risk, market risk, operational risk and reputational risk in the context of risk management 16.4.2 Identification and materiality assessment of ESG risks Economic strategy and processes Corresponding chapter a) Adjustment of the institution’s economic strategy to integrate social factors and risks, taking into account the impact of social risk on the economic environment, business model, strategy and financial planning of the institution 16.3 VISION 2030 and Impact strategy b) Objectives, targets and limits for the assessment and management of social risk in the short, medium and long term, and assessment of the performance with regard to these objectives, targets and limits, including forward-looking information entering into the definition of the strategy and economic processes 16.3.3 Objectives, targets and limits related to environmental and social risks and performance assessment c) Policies and procedures for direct and indirect dialog with new or existing counterparties on their strategies to mitigate and reduce socially harmful activities 16.4.4 Integration of ESG risks into the risk management framework Governance d) Responsibilities of the management body in establishing the risk tolerance framework and in overseeing and managing the implementation of the objectives, strategy and policies defined in the context of social risk management, covering the approaches followed by counterparties with regard to:
I. Activities in favor of the community and society
II. Labor relations and standards
III. Consumer protection and product liability
IV. Human rights
16.2 Governance e) Integration of social factors and risk management measures into internal governance systems, including the role of committees, the division of tasks and responsibilities, and the feedback circuit between the risk management function and the management body 16.2 Governance f) Social risk reporting channels and reporting frequency 16.4.5 ESG risk monitoring and reporting framework g) Alignment of the remuneration policy with the institution’s social risk objectives 16.2.5 Remuneration policy Risk management h) Definitions, methodologies and international standards on which the social risk management framework is based 16.1 Definitions and reference framework i) Process for identifying, measuring and monitoring activities and exposures (and, where applicable, collateral) sensitive to social risks, covering the relevant transmission channels 16.4.3 ESG risk measurement tools and methodologies j) Activities, commitments and assets contributing to social risk mitigation 16.4.4 Integration of ESG risks into the risk management framework k) Implementation of social risk identification and management tools 16.4.4 Integration of ESG risks into the risk management framework l) Description of the setting of social risk limits and cases triggering the attachment of higher levels and exclusion from the portfolio in case of exceeding 16.4.4 Integration of ESG risks into the risk management framework m) Description of the link (transmission channels) between social risks and credit risk, liquidity and funding risk, market risk, operational risk and reputational risk in the context of risk management 16.4.2 ESG risk identification and assessment process Governance Corresponding chapter a) Integration by the institution, in its governance arrangements, of the counterparty’s governance performance, including at the level of the committees of the latter’s highest governance body and its committees responsible for decisions on economic issues, environmental and social 16.4.4 Integration of ESG risks into the risk management framework b) Consideration by the institution of the role of the counterparty’s highest governance body in the publication of non-financial information 16.4.4 Integration of ESG risks into the risk management framework c) Integration by the institution, in the governance system, of the performance of its counterparties in terms of governance, in particular:
I. Ethical considerations
II. Risk strategy and management
III. Inclusiveness
IV. Transparency
V. Managing conflicts of interest
VI. Internal communication on critical concerns
16.4.4 Integration of ESG risks into the risk management framework Risk management d) Integration by the institution, in its risk management frameworks, of the performance of its counterparties in terms of governance in terms of:
I. Ethical considerations
II. Risk strategy and management
III. Inclusiveness
IV. Transparency
V. Managing conflicts of interest
VI. Internal communication on critical concerns
16.4.4 Integration of ESG risks into the risk management framework -
16.6 Detailed quantitative information
Groupe BPCE has decided to apply the transitional provisions confirmed by the EBA’s no-action letter of August 6, 2025, which suspend the publication of templates 6 to 10 (relating to the Green Asset Ratio and the other climate change mitigation measures) and column c (“of which environmentally sustainable – CCM”) of templates 1 and 4.
Template 1: Banking book - Indicators of transition risk potentially linked to climate change: Credit quality of exposures by sector, issues and residual maturity
12/31/2025 a b d e f g h i j k l m n o p Total gross carrying amount (in millions
of euros)Accumulated impairment,
accumulated negative
changes in fair value due to
credit risk and provisions
(in millions of euros)GHG financed
emissions (Scope 1,
Scope 2 and Scope 3
emissions of the
counterparty) (in
metric tons of CO2
equivalent)GHG
emissions
(column i):Sector/sub-sector Of which
exposures
towards
companies
excluded
from EU
Paris
Agreement-
aligned
BenchmarksOf which
Stage 2
exposuresOf which
non-
performing
exposuresOf which
Stage 2
exposuresOf
which
non-
performing
exposuresOf which
Scope 3
financed
emissionsgross
carrying
amount
percentage
of the
portfolio
derived from
company-
specific
reporting≤ 5 years > 5 years
≤ 10
years> 10
years ≤
20 years> 20
yearsWeighted
average
maturity1 Exposures towards sectors that highly contribute to climate change* 258,088 4,128 46,733 13,640 (8,008) (2,199) (5,540) 90,367,499 64,459,468 9.19% 110,915 67,504 68,638 11,031 9 2 A - Agriculture, forestry and fishing 5,960 - 1,868 457 (370) (127) (243) 10,349,907 2,906,848 0.05% 2,853 1,819 1,233 56 9 3 B - Mining and quarrying 2,767 1,231 540 185 (78) (5) (73) 3,925,966 2,192,541 0.39% 2,097 577 91 3 4 4 B.05 - Mining of coal and lignite 1 - - - (0) (0) (0) 577 211 0.00% 0 0 0 0 1 5 B.06 - Hydrocarbon extraction 520 511 3 1 (1) (0) (1) 820,741 680,808 0.12% 394 109 17 0 2 6 B.07 - Mining of metal ores 931 - 292 113 (16) (1) (14) 1,085,553 257,956 0.14% 705 194 31 1 4 7 B.08 - Other mining and quarrying 583 12 149 31 (20) (1) (19) 892,296 590,618 0.04% 442 122 19 1 8 8 B.09 - Mining support service activities 732 708 95 41 (41) (3) (38) 1,126,799 662,948 0.10% 555 153 24 1 2 9 C - Manufacturing 22,267 571 3,183 1,911 (1,040) (128) (881) 18,524,449 14,859,327 1.72% 17,444 3,925 676 222 5 10 C.10 - Manufacture of food products 4,215 - 735 420 (267) (33) (226) 5,243,475 4,786,699 0.23% 3,302 743 128 42 6 11 C.11 - Manufacture of beverages 1,369 - 548 66 (49) (6) (41) 840,654 748,399 0.08% 1,072 241 42 14 5 12 C.12 - Manufacture of tobacco products 1 - - 0 (0) (0) (0) 1,049 922 0.00% 1 0 0 0 1 13 C.13 - Manufacture of textiles 381 - 26 24 (10) (1) (8) 97,434 54,687 0.05% 299 67 12 4 6 14 C.14 - Clothing industry 149 - 31 31 (13) (2) (11) 30,907 25,732 0.00% 116 26 5 1 11 15 C.15 - Manufacture of leather and related products 71 - 7 9 (4) (0) (3) 17,397 14,327 0.00% 56 13 2 1 11 16 C.16 - Manufacture of wood and of products of wood and cork, except furniture; manufacture of articles of straw and plaiting materials 887 - 175 96 (68) (8) (57) 311,032 232,170 0.02% 695 156 27 9 10 17 C.17 - Manufacture of pulp, paper and paperboard 378 - 33 16 (10) (1) (8) 241,921 103,231 0.02% 296 67 11 4 4 18 C.18 - Printing and service activities related to printing 567 - 34 59 (22) (3) (18) 161,936 117,644 0.00% 444 100 17 6 6 19 C.19 - Manufacture of coke oven products 602 534 1 15 (10) (1) (9) 2,322,812 1,760,053 0.11% 472 106 18 6 5 20 C.20 - Production of chemicals 1,298 - 132 80 (36) (4) (31) 1,073,239 765,709 0.15% 1,017 229 39 13 3 21 C.21 - Manufacture of pharmaceutical preparations 968 - 91 166 (54) (7) (46) 280,730 185,872 0.15% 759 171 29 10 3 22 C.22 - Manufacture of rubber products 774 - 109 42 (24) (3) (20) 907,549 679,092 0.01% 607 136 23 8 6 23 C.23 - Manufacture of other non-metallic mineral products 643 0 166 53 (30) (4) (26) 565,649 250,845 0.02% 504 113 20 6 6 24 C.24 - Manufacture of basic metals 908 - 62 35 (15) (2) (13) 1,190,445 468,613 0.12% 711 160 28 9 4 25 C.25 - Manufacture of fabricated metal products, except machinery and equipment 2,250 - 373 249 (111) (14) (94) 1,184,286 879,143 0.02% 1,763 397 68 22 6 26 C.26 - Manufacture of computer, electronic and optical products 1,287 - 84 53 (26) (3) (22) 528,222 506,055 0.17% 1,008 227 39 13 4 27 C.27 - Manufacture of electrical equipment 1,071 37 80 136 (87) (11) (74) 496,409 464,801 0.17% 839 189 32 11 4 28 C.28 - Manufacture of machinery and equipment n.e.c. 1,186 - 106 109 (69) (8) (58) 1,036,989 987,233 0.10% 929 209 36 12 7 29 C.29 - Automotive industry 1,311 - 127 72 (41) (5) (35) 891,177 814,413 0.21% 1,027 231 40 13 3 30 C.30 - Manufacture of other transport equipment 681 - 93 35 (23) (3) (20) 653,154 611,959 0.07% 534 120 21 7 5 31 C.31 - Manufacture of furniture 213 - 40 45 (19) (2) (16) 44,476 32,732 0.00% 167 37 6 2 8 32 C.32 - Other manufacturing industries 373 - 52 35 (21) (3) (18) 79,399 64,645 0.00% 292 66 11 4 7 33 C.33 - Repair and installation of machinery and equipment 684 - 78 66 (32) (4) (27) 324,108 304,351 0.01% 536 121 21 7 9 34 D - Electricity, gas, steam and air conditioning supply 13,416 1,258 1,299 374 (163) (40) (122) 7,956,265 3,416,046 1.29% 5,453 2,784 3,970 1,210 9 35 D35.1 - Electric power generation, transmission and distribution 12,308 620 1,062 356 (149) (37) (112) 6,617,387 2,728,713 1.17% 5,002 2,554 3,642 1,110 9 36 D35.11 - Power generation 11,270 577 984 356 (147) (36) (110) 5,435,618 2,130,708 0.98% 4,580 2,338 3,335 1,016 10 37 D35.2 - Manufacture of gas; distribution of gaseous fuels through mains 974 562 214 18 (13) (3) (10) 1,202,034 636,716 0.11% 396 202 288 88 8 38 D35.3 - Steam and air conditioning production and supply 134 75 23 0 (1) (0) (1) 136,844 50,617 0.00% 54 28 40 12 10 39 E - Water supply; sewerage, waste management and remediation activities 2,337 - 206 91 (45) (6) (36) 1,132,555 513,933 0.05% 1,292 433 483 130 9 40 F - Construction 17,468 28 5,060 1,855 (1,116) (256) (823) 5,543,183 4,944,900 0.35% 9,795 5,499 1,951 224 8 41 F.41 - Construction of buildings 9,995 - 2,869 974 (635) (146) (468) 2,734,874 2,441,277 0.12% 5,604 3,147 1,116 128 8 42 F.42 - Civil engineering 2,240 28 360 102 (47) (11) (35) 1,293,026 1,156,169 0.18% 1,256 705 250 29 5 43 F.43 - Specialized construction activities 5,233 0 1,831 779 (434) (100) (320) 1,515,283 1,347,454 0.06% 2,934 1,647 584 67 9 44 G - Wholesale and retail trade; repair of motor vehicles and motorcycles 39,228 852 6,220 2,311 (1,542) (295) (1,223) 32,532,442 27,607,131 2.56% 28,118 8,467 1,204 1,439 6 45 H - Transportation and storage 10,465 178 1,576 564 (277) (55) (190) 3,095,267 1,795,681 0.52% 6,884 2,455 1,011 115 7 46 H.49 - Land transport and transport via pipelines 6,207 177 1,068 333 (178) (35) (121) 1,225,046 737,355 0.23% 4,083 1,456 600 68 6 47 H.50 - Water transport 785 - 58 119 (32) (6) (22) 124,192 74,729 0.06% 516 184 76 9 11 48 H.51 - Air transport 680 - 131 33 (23) (5) (16) 641,428 104,773 0.09% 447 159 66 7 5 49 H.52 - Warehousing and support activities for transportation 2,589 1 314 78 (43) (9) (30) 1,063,298 864,425 0.12% 1,703 607 250 28 7 50 H.53 - Postal and courier activities 204 - 5 2 (1) (0) (1) 41,303 14,399 0.02% 134 48 20 2 2 51 I - Accommodation and food service activities 11,789 0 2,947 1,092 (673) (219) (451) 2,589,148 2,019,324 0.14% 5,428 3,512 2,769 80 8 52 L - Real estate activities 132,391 10 23,834 4,800 (2,703) (1,068) (1,499) 4,718,317 4,203,737 2.11% 31,553 38,033 55,252 7,553 11 53 Exposures towards sectors other than those that highly contribute to climate change 102,968 433 11,960 4,161 (2,967) (480) (1,930) - - - 60,873 28,944 10,733 2,417 7 54 K - Financial and insurance activities 36,296 427 3,416 1,093 (808) (127) (623) - - - 26,477 6,422 2,699 698 5 55 Exposures to other sectors (NACE codes J, M – U) 66,672 6 8,543 3,068 (2,159) (354) (1,307) - - - 34,396 22,522 8,034 1,720 8 56 TOTAL 361,056 4,561 58,692 17,801 (10,975) (2,679) (7,470) 90,367,499 64,459,468 9.19% 171,789 96,449 79,371 13,448 - * In accordance with the Commission Delegated Regulation (EU) 2020/1818 supplementing Regulation (EU) 2016/1011 as regards minimum standards for EU Climate Transition Benchmarks and EU Paris Agreement-aligned Benchmarks – Climate Benchmark Indices Regulation – Recital 6: Sectors listed in Sections A to H and Section L of Annex 1 to Regulation (EC) 1893/2006.
06/30/2025 a b d e f g h i j k l m n o p Total gross carrying amount (in millions
of euros)Accumulated impairment,
accumulated negative
changes in fair value due to
credit risk and provisions
(in millions of euros)GHG financed
emissions (Scope 1,
Scope 2 and Scope 3
emissions of the
counterparty) (in
metric tons of CO2
equivalent)GHG
emissions
(column i):Sector/sub-sector Of which
exposures
towards
companies
excluded
from EU
Paris
Agreement-
aligned
BenchmarksOf which
Stage 2
exposuresOf which
non-
performing
exposuresOf which
Stage 2
exposuresOf
which
non-
performing
exposuresOf which
Scope 3
financed
emissionsgross
carrying
amount
percentage
of the
portfolio
derived from
company-
specific
reporting≤ 5 years > 5
years ≤
10 years> 10
years ≤
20 years> 20
yearsWeighted
average
maturity1 Exposures towards sectors that highly contribute to climate change* 255,319 3,194 50,777 13,028 (7,908) (2,270) (5,335) 85,411,606 60,628,202 9.35% 103,606 73,165 68,004 10,544 9 2 A - Agriculture, forestry and fishing 5,945 - 2,006 436 (366) (133) (232) 10,429,002 2,928,607 0.04% 2,641 2,047 1,206 51 9 3 B - Mining and quarrying 2,499 714 632 220 (85) (7) (77) 3,598,475 1,687,554 0.32% 1,694 740 57 7 5 4 B.05 - Mining of coal and lignite - 775 283 0.00% 2 5 B.06 - Hydrocarbon extraction 484 282 40 1 (1) (0) (1) 710,407 562,082 0.11% 328 143 11 1 2 6 B.07 - Mining of metal ores 832 29 267 141 (16) (1) (15) 1,219,551 360,932 0.16% 564 247 19 2 5 7 B.08 - Other mining and quarrying 533 12 168 31 (21) (2) (19) 567,869 234,435 0.01% 361 158 12 2 9 8 B.09 - Mining support service activities 650 391 157 47 (47) (4) (43) 1,099,873 529,822 0.04% 440 192 15 2 3 9 C – Manufacturing 22,404 432 3,054 1,919 (1,029) (111) (895) 17,688,768 14,400,827 1.66% 16,228 5,343 578 255 6 10 C.10 - Manufacture of food products 4,239 - 708 413 (266) (29) (231) 5,681,317 5,239,162 0.22% 3,070 1,011 109 48 6 11 C.11 - Manufacture of beverages 1,417 - 517 64 (45) (5) (39) 852,942 759,115 0.10% 1,027 338 37 16 6 12 C.12 - Manufacture of tobacco products 0 - - 0 (0) (0) (0) 325 286 0.00% 0 0 0 0 1 13 C.13 - Manufacture of textiles 421 - 27 21 (9) (1) (8) 127,312 75,693 0.06% 305 100 11 5 6 14 C.14 - Clothing industry 194 - 20 33 (15) (2) (13) 47,820 42,558 0.01% 140 46 5 2 10 15 C.15 - Manufacture of leather and related products 242 - 6 5 (3) (0) (3) 33,921 30,868 0.04% 175 58 6 3 3 16 C.16 - Manufacture of wood and of products of wood and cork, except furniture; manufacture of articles of straw and plaiting materials 918 - 157 100 (63) (7) (55) 307,160 232,778 0.02% 665 219 24 10 9 17 C.17 - Manufacture of pulp, paper and paperboard 386 - 29 17 (10) (1) (9) 218,400 90,179 0.02% 280 92 10 4 8 18 C.18 - Printing and service activities related to printing 600 - 45 64 (25) (3) (22) 170,389 123,556 0.00% 435 143 15 7 5 19 C.19 - Manufacture of coke oven products 473 377 0 15 (10) (1) (9) 1,400,534 898,716 0.08% 342 113 12 5 6 20 C.20 - Production of chemicals 1,453 - 184 50 (31) (3) (27) 1,574,643 1,264,255 0.15% 1,052 346 37 17 3 21 C.21 - Manufacture of pharmaceutical preparations 1,036 - 19 182 (54) (6) (47) 301,819 194,652 0.15% 751 247 27 12 3 22 C.22 - Manufacture of rubber products 705 - 120 39 (23) (2) (20) 372,111 228,303 0.00% 511 168 18 8 8 23 C.23 - Manufacture of other non-metallic mineral products 614 0 163 52 (31) (3) (27) 538,114 231,397 0.02% 444 146 16 7 7 24 C.24 - Manufacture of basic metals 758 - 55 27 (15) (2) (13) 1,041,405 577,832 0.08% 549 181 20 9 3 25 C.25 - Manufacture of fabricated metal products, except machinery and equipment 2,292 - 369 258 (112) (12) (97) 1,217,226 896,133 0.01% 1,660 547 59 26 6 26 C.26 - Manufacture of computer, electronic and optical products 1,018 - 61 55 (25) (3) (22) 343,186 325,849 0.13% 737 243 26 12 5 27 C.27 - Manufacture of electrical equipment 1,003 36 63 131 (78) (8) (68) 424,946 395,895 0.12% 727 239 26 11 4 28 C.28 - Manufacture of machinery and equipment n.e.c. 1,230 - 113 102 (63) (7) (55) 800,289 750,915 0.11% 891 293 32 14 6 29 C.29 - Automotive industry 1,418 - 130 114 (62) (7) (54) 1,223,177 1,128,898 0.25% 1,027 338 37 16 4 30 C.30 - Manufacture of other transport equipment 678 20 63 35 (20) (2) (17) 658,789 600,338 0.09% 491 162 17 8 5 31 C.31 - Manufacture of furniture 225 - 49 41 (18) (2) (16) 67,856 58,699 0.00% 163 54 6 3 6 32 C.32 - Other manufacturing industries 382 - 69 36 (21) (2) (18) 86,293 72,985 0.00% 277 91 10 4 7 33 C.33 - Repair and installation of machinery and equipment 701 - 86 64 (32) (3) (28) 198,794 181,765 0.01% 508 167 18 8 9 34 D - Electricity, gas, steam and air conditioning supply 14,077 1,100 1,253 399 (137) (41) (94) 10,987,520 6,755,008 1.61% 6,277 2,853 4,005 942 8 35 D35.1 - Electric power generation, transmission and distribution 12,841 614 1,050 371 (126) (37) (86) 9,198,860 5,587,731 1.41% 5,726 2,603 3,653 859 9 36 D35.11 - Power generation 12,048 587 954 286 (121) (36) (82) 8,421,557 4,999,526 1.29% 5,372 2,442 3,428 806 9 37 D35.2 - Manufacture of gas; distribution of gaseous fuels through mains 1,098 413 180 28 (10) (3) (7) 1,635,671 1,108,478 0.20% 490 223 312 74 5 38 D35.3 - Steam and air conditioning production and supply 138 73 23 0 (1) (0) (1) 152,989 58,799 0.00% 61 28 39 9 10 39 E - Water supply; sewerage, waste management and remediation activities 2,310 - 235 72 (48) (7) (38) 1,010,773 494,134 0.09% 1,092 613 473 133 10 40 F - Construction 17,482 29 5,409 1,810 (1,073) (245) (772) 5,433,298 4,664,623 0.34% 8,434 6,966 1,822 260 8 41 F.41 - Construction of buildings 9,947 - 3,144 907 (593) (136) (427) 2,778,279 2,473,833 0.14% 4,799 3,963 1,037 148 8 42 F.42 - Civil engineering 2,102 29 398 93 (44) (10) (32) 924,271 758,802 0.13% 1,014 837 219 31 6 43 F.43 - Specialized construction activities 5,433 0 1,866 810 (436) (100) (313) 1,730,748 1,431,988 0.07% 2,621 2,165 566 81 10 44 G - Wholesale and retail trade; repair of motor vehicles and motorcycles 37,345 679 5,984 2,110 (1,466) (281) (1,157) 25,949,961 21,864,924 2.54% 25,640 9,460 1,171 1,075 7 45 H - Transportation and storage 10,412 229 1,712 544 (287) (59) (188) 3,019,682 1,598,151 0.50% 5,347 3,693 1,204 168 7 46 H.49 - Land transport and transport via pipelines 6,226 209 1,108 324 (179) (37) (117) 1,232,658 674,576 0.25% 3,197 2,208 720 101 8 47 H.50 - Water transport 766 - 137 108 (33) (7) (21) 112,432 72,393 0.06% 394 272 89 12 5 48 H.51 - Air transport 594 - 112 35 (30) (6) (20) 707,367 114,881 0.07% 305 211 69 10 7 49 H.52 - Warehousing and support activities for transportation 2,580 21 347 72 (44) (9) (29) 905,468 685,361 0.10% 1,325 915 298 42 7 50 H.53 - Postal and courier activities 245 - 8 4 (2) (0) (1) 61,757 50,940 0.02% 126 87 28 4 2 51 I - Accommodation and food service activities 11,587 0 3,175 1,106 (678) (208) (463) 2,355,760 1,808,488 0.11% 5,268 3,821 2,413 85 7 52 L - Real estate activities 131,258 10 27,319 4,412 (2,740) (1,178) (1,418) 4,938,367 4,425,886 2.15% 30,986 37,630 55,075 7,567 11 53 Exposures towards sectors other than those that highly contribute to climate change 97,277 171 12,141 4,063 (2,846) (454) (1,853) - - - 54,875 29,561 10,525 2,317 6 54 K - Financial and insurance activities 32,795 167 3,475 1,028 (774) (139) (591) - - - 23,675 5,758 2,785 577 5 55 Exposures to other sectors (NACE codes J, M – U) 64,482 4 8,666 3,035 (2,072) (315) (1,262) - - - 31,199 23,803 7,740 1,739 7 56 TOTAL 352,596 3,365 62,918 17,091 (10,754) (2,724) (7,188) 85,411,606 60,628,202 9.35% 158,480 102,726 78,529 12,861 - * In accordance with the Commission Delegated Regulation (EU) 2020/1818 supplementing Regulation (EU) 2016/1011 as regards minimum standards for EU Climate Transition Benchmarks and EU Paris Agreement-aligned Benchmarks – Climate Benchmark Indices Regulation – Recital 6: Sectors listed in Sections A to H and Section L of Annex 1 to Regulation (EC) 1893/2006.
The template shows a mapping of exposures by sector with details of those considered to be significant contributors to climate change. The sectoral breakdown of exposures to non-financial counterparties was carried out on the basis of granular information also used for Groupe BPCE’s regulatory reporting.
While the model presents the exposures to sectors of increased sensitivity to transition risk, it does not take into account the specific business model characteristics and transition dynamics of each counterparty and therefore, cannot be interpreted as a presentation of Groupe BPCE’s exposure to transition risk.
As regards exposures to companies excluded from the European Union’s “Paris Agreement” benchmarks, their identification is based on external data as well as on internal monitoring. In the absence of data of sufficient quality, the calculation at December 31, 2025 did not take into account the criterion aimed at excluding companies that cause significant harm to at least one of the six environmental objectives referred to in Article 9 of Regulation (EU) 2020/852.
Regarding Greenhouse Gas (GHG) emissions, for the December 31, 2025 closing, Groupe BPCE publishes the columns relating to Scope 1, 2 and 3 GHG financed based on data from several external data providers. The financed GHG emissions are measured using the Partnership for Carbon Accounting Financials (PCAF) method. The carbon data sources used for the corporate financing are mainly those of data providers (Carbone 4, CDP, Trucost). Groupe BPCE publishes client emissions for which carbon data is available, and when the data is not available at company level, Group carbon data is used. In the absence of client data, Groupe BPCE used sector proxies for the portfolio to estimate emissions:
- – for companies or dedicated financing belonging to sectors with good supplier data coverage, the sectoral carbon data are extrapolated;
- – for companies related to other sectors, the sectoral proxies provided by PCAF are applied (by NACE code and geographic area). As the coverage by the PCAF proxy is significant related in particular to exposures to small- and medium-sized companies, the estimated nature of the measures should be highlighted for this segment.
It should be noted that the carbon data used may be one year behind the closing date of the outstandings.
The data collected, methods and measurements carried out have not been subject to external verification. Differences may exist in the measurements of greenhouse gases from data providers (for example, in terms of geography and scope) as well as inaccuracies or incompleteness of the activities covered by the clients in their publications.
The precision of these measurements may change depending on the work carried out within Groupe BPCE to improve their quality and coverage rate.
GHG emissions could not be allocated to all financing operations due to a lack of information; these operations represent less than 5% of the portfolio.
Template 2: Banking book - Climate change transition risk indicators: Loans collateralized by immovable property – Energy efficiency of the collateral
12/31/2025 a b c d e f g h i j k l m n o p Total gross carrying amount (in millions of euros) Level of energy efficiency (EP score in kWh/m2 of
collateral)Level of energy efficiency (EPC label of collateral) Without EPC label of
collateralCounterparty sector 0; ≤
100> 100; ≤
200> 200; ≤
300> 300; ≤
400> 400; ≤
500> 500 A B C D E F G Of which level
of energy
efficiency (EP
score in kWh/
m2 of
collateral)
estimated1 Total EU area 411,736 13,992 61,846 141,674 21,875 1,332 14,736 4,315 8,531 57,725 93,042 55,955 20,253 15,634 156,281 0.00% 2 Of which loans collateralized by commercial immovable property 56,011 234 289 648 98 5 115 126 106 276 371 299 94 117 54,622 0.00% 3 Of which loans collateralized by residential immovable property 355,724 13,758 61,557 141,026 21,777 1,327 14,621 4,188 8,426 57,449 92,671 55,656 20,159 15,517 101,658 0.00% 4 Of which collateral obtained by taking possession: residential and commercial immovable properties 5 Of which level of energy efficiency (EP score in kWh/m2 of collateral) estimated 231,705 11,709 51,261 135,680 18,219 - 14,836 - 6 Total non-EU area 8,275 96 363 768 147 22 89 28 60 328 496 339 131 102 6,791 0.00% 7 Of which loans collateralized by commercial immovable property 1,823 0 0 - - - - 0 - 0 - - - - 1,823 0.00% 8 Of which loans collateralized by residential immovable property 6,452 96 363 768 147 22 89 27 60 328 496 339 131 102 4,968 0.00% 9 Of which collateral obtained by taking possession: residential and commercial immovable properties 10 Of which level of energy efficiency (EP score in kWh/m2 of collateral) estimated 1,181 83 277 664 91 - 65 -
06/30/2025 a b c d e f g h i j k l m n o p Total gross carrying amount (in millions of euros) Level of energy efficiency (EP score in kWh/m2 of
collateralLevel of energy efficiency (EPC label of collateral) Without EPC label of
collateralCounterparty sector 0; ≤
100> 100; ≤
200> 200; ≤
300> 300; ≤
400> 400; ≤
500> 500 A B C D E F G Of which level
of energy
efficiency (EP
score in kWh/m2
of collateral)
estimated1 Total EU area 410,221 13,295 60,667 139,400 21,564 1,400 14,608 3,931 8,153 56,307 91,471 55,679 19,843 15,550 159,285 0.00% 2 Of which loans collateralized by commercial immovable property 57,191 291 223 653 104 6 121 130 159 210 373 302 99 124 55,794 0.00% 3 Of which loans collateralized by residential immovable property 353,030 13,004 60,445 138,747 21,461 1,394 14,487 3,800 7,995 56,097 91,099 55,377 19,744 15,426 103,492 0.00% 4 Of which collateral obtained by taking possession: residential and commercial immovable properties 5 Of which level of energy efficiency (EP score in kWh/m2 of collateral) estimated 224,897 10,801 49,269 132,560 17,612 - 14,655 - 6 Total non-EU area 6,118 113 357 753 144 23 90 48 55 319 479 345 129 105 4,637 0.00% 7 Of which loans collateralized by commercial immovable property 947 23 5 - - - - 23 - 5 - - - - 920 0.00% 8 Of which loans collateralized by residential immovable property 5,170 90 352 753 144 23 90 26 55 314 479 345 129 105 3,717 0.00% 9 Of which collateral obtained by taking possession: residential and commercial immovable properties 10 Of which level of energy efficiency (EP score in kWh/m2 of collateral) estimated 1,174 98 269 655 85 - 66 - The model shows the breakdown of the gross carrying amount of loans according to the energy performance of their collateral. This breakdown is displayed in two forms: its measurement in kWh/m2 and the Energy Performance Diagnosis (EPD) label (A to G) of the collateral as defined in the directive on the energy performance of buildings and the directive on energy efficiency.
The carbon measurements used for residential loan financing correspond to the carbon emissions related to the use of the building. The data sources are based on Energy Performance Diagnosis (EPDs) when these are available. Otherwise, proxies are used, relying in particular on data from the French Scientific and Technical Center for Building (Centre Scientifique et Technique du Bâtiment - CSTB).
In the absence of such information and for financing property to be built, Groupe BPCE determines the primary energy consumption using the applicable construction standards (RT 2012 regulations applicable to constructions between January 1, 2013 and December 31, 2020 and RE 2020 applicable to constructions from January 1, 2022). In the absence of information on the date on which the building permit for the property financed was filed, Groupe BPCE identifies it from the date on which the financing was granted, applying a margin of two years.
The processes for collecting EPDs from clients are currently being reviewed, which will eventually allow the information presented to be completed and refined.
Template 3: Banking book - Indicators of transition risk potentially linked to climate change: Alignment parameters
12/31/2025 a b c d e f g Sector NACE sectors
(minimum)Gross carrying
amount of the
portfolio (in millions
of euros)Alignment
parameter**Reference
yearDistance from IEA NZE
2050 scenario, in %*Target (reference
year + 3 years)1 Electricity D.35.11 13,225 85 gCO2e/kWh 2024 (38%) 110 2 Combustion of fossil fuels B.06.1; B.06.2 1,024 2.6 MtCO2e 2024 (51%) 3.9 3 Automotive industry C.29.1 2,869 159 gCO2e/km 2024 48% 125 4 Air transport H.51.1 1,715 859 gCO2e/RTK 2024 13% 814 5 Maritime transport 6 Production of cement, clinker and lime C.23.51 49 651 kgCO2e/t cement 2024 41% 579 7 Production of iron and steel, coke and metal ores C.24.10 193 1.9 tCO2e/t steel 2024 58% 1.6 8 Aluminum production C.24.42 121 6.1 tCO2e/t aluminum 2024 (31%) 6.2 06/30/2025 a b c d e f g Sector NACE sectors
(minimum)Gross carrying amount
of the portfolio (in
millions of euros)Alignment parameter Reference
yearDistance from IEA NZE
2050 scenario, in %*Target (reference
year + 3 years)1 Electricity 35.11 10,389 92.6 gCO2e/kWh 2023 (33%) 116 2 Combustion of fossil fuels 6.10; 6.20 870 2.4 MtCO2e 2023 (55%) 4.5 3 Automotive industry 29.10 1,466 162 gCO2e/km 2023 51% 133 4 Air transport 51.10 1,540 870 gCO2e/RTK 2023 14% 835 5 Maritime transport 6 Production of cement, clinker and lime 23.51 145 661 kgCO2e/t cement 2023 43% 597 7 Production of iron and steel, coke and metal ores 24.10 203 1.9 tCO2e/t steel 2023 57% 1.7 8 Aluminum production 24.42 116 6.4 tCO2e/t aluminum 2023 (28%) 6.3 This model presents the Net Zero alignment parameters observed on Groupe BPCE’s financing portfolios.
With the VISION 2030 strategic project, Groupe BPCE has made a long-term commitment to the fight against climate change.
With the aim of making impact accessible to all, the Group has defined specific courses of action to support all its clients in their environmental transition and, in particular, to align its financing portfolios with trajectories based on scientific scenarios compatible with the objectives of the Paris Agreement (detailed in its Sustainability report).
Groupe BPCE has relied in its decarbonization approach on the Net Zero Banking Alliance (NZBA), a financial initiative of the United Nations Environment Program – UNEP FI. This initiative between banking institutions is a decisive step in the mobilization of the financial sector to achieve the objectives of the Paris Agreement.
- align loan books with a carbon neutral trajectory for the global economy;
- define trajectories targeted on priority sectors, i.e. those with the highest carbon emissions within the portfolios;
- aim for intermediate targets no later than 2030;
- publish annual carbon emissions;
- determine a robust and structured action plan to adapt its portfolios to its alignment strategy.
The gross carrying amount is determined on all counterparties in the sectors for which the bank has public decarbonization targets.
Groupe BPCE’s target is to have an average carbon intensity related to the financing of electricity production of less than 90 gCO2eq/kWh by 2030 (compared to a target of 138 gCO2eq/kWh in the IEA NZE 2050 scenario published in 2021). It should be noted that the geographical breakdown of Groupe BPCE’s portfolio is not directly comparable to the global scope of the IEA scenario. The IEA NZE 2050 scenario is adapted to a global portfolio (target of less than 138 gCO2eq/kWh by 2030). Groupe BPCE’s portfolio is not exposed to all geographic areas of the world. It is mainly focused on France, Europe/Middle East and the Americas. The scope used concerns the electricity producers financed by Groupe BPCE (the alignment parameter covers the Scope 1 and 2 emissions of the counterparties). The calculation of the equivalent carbon intensity is the weighted average of exposures.
Groupe BPCE’s objective is to reduce, between 2020 and 2030, the absolute carbon emissions related to the end use of oil and gas by at least 70%, for the scope of financing for oil and gas extraction and production recognized in the balance sheet. When including the credit exposures recognized off-balance sheet (compared to 30% in the IEA NZE 2050 scenario published in 2021), this reduction is equivalent to -50%. The 2020 reference value, calculated on the basis of the assets in the balance sheet, is estimated at 7.7 MtCO2eq. The scope used is that of the financed emissions related to the end use of oil and gas extraction and production (the alignment parameter concerns the Scope 3 “use of products” emissions of the counterparties). The calculation of the equivalent carbon footprint is carried out in accordance with the Partnership for Carbon Accounting Financials (PCAF) method.
Groupe BPCE’s carbon intensity reduction target for the automotive sector is 100 gCO2eq/km, i.e. -40% compared to 2022. The IEA NZE 2050 scenario is a scenario for the global rolling stock. It does not fully correspond to the covered portfolios: the emissions are linked to the annual sales of car manufacturers’ vehicles, so they are not, or only slightly, comparable to an IEA Net Zero target adapted to a (global) fleet - flows vs. stock. The ambition of the targets was calibrated on an internal calculation aiming to derive from the trajectory of the IEA car fleet (stock) an assumption of a reference point for manufacturers’ vehicle sales (flow). The scope of the outstandings used corresponds to all of the Group’s exposures for financing granted to automotive manufacturers and BPCE Lease’s outstandings for leasing activities. The calculation of the equivalent carbon intensity uses the PCAF method.
Groupe BPCE, through Natixis CIB, targets an average carbon intensity related to aviation financing of less than 750 gCO2eq/RTK by 2030 (i.e. lower than the intensity level of 760 gCO2eq/RTK of the IEA NZE 2050 scenario). The reference value in 2022 is 920 gCO2eq/RTK. The IEA NZE 2050 scenario (or that of Mission Possible Partnership) is adapted to a global portfolio. The scope concerns airlines, aircraft leasing and asset financing (the alignment parameter covers the “well-to-wake” Scope 1, 2 and 3 emissions of the counterparties). The calculation of the equivalent carbon intensity is the weighted average of exposures.
The objective for the cement sector is to obtain an average carbon intensity of financing for cement producers of less than 525 kgCO2eq/t of cement by 2030. It should be noted that the main decarbonization levers for the cement sector (e.g. CCUS) will not be fully operational or at scale by 2030, so the reduction target set is ambitious; it is higher than the 2030 metric of the IEA NZE 2050 scenario published in 2021. The scope used thus concerns Groupe BPCE’s cement and clinker producers (the alignment parameter covers the Scope 1 and 2 emissions of the counterparties). The calculation of the equivalent carbon intensity uses the PCAF method.
Groupe BPCE’s steel sector objective is to reach a threshold of 1.4 tCO2eq/t of steel by 2030. It should be noted that the IEA revised the Scope 1 Net Zero target upwards in its last report published in 2023. A possible revision of this reduction target will depend on the progress of new steel production decarbonization technologies and public policies to support their deployment. The scope used therefore concerns Groupe BPCE’s steel producers (the alignment parameter covers the Scope 1 and 2 emissions of the counterparties). The calculation of the equivalent carbon intensity uses the PCAF method.
Groupe BPCE aims to achieve a financed carbon intensity of 6 tCO2eq/t of aluminum by 2030. The 2022 reference value is 6.5 tCO2eq/t of aluminum. The scenario used is the International Aluminum Institute (IAI) 1.5°C scenario which is based on the IEA NZE 2050 scenario. The scope used concerns the aluminum smelting activities (the alignment parameter covers the Scope 1 and 2 emissions of the counterparties) for Groupe BPCE as a whole. The calculation of the equivalent carbon intensity uses the PCAF method.
Sectors Mandatory Pillar III sectors covered by the NZBA by Groupe BPCE with a published decarbonization target for 2030 NACE sectors NACE non-exhaustive list of counterparties included in the NZBA scope. Gross carrying amount of the portfolio This is the gross carrying amount of exposures to non-financial corporations in each of the sectors indicated in columns a) and b) by keeping the perimeter of third parties observed in the reference year (column e). In practice, this corresponds to all financial assets (excluding derivatives) in the Banking Book: debt instruments recognized under IFRS at amortized cost, at fair value through other comprehensive income recyclable to profit or loss and at fair value through profit or loss. Groupe BPCE publishes the balance sheet exposures for the gross carrying amounts at December 31, 2025. Alignment parameter Units of measures of greenhouse gas emissions aligned with the metrics used in the NZBA framework by Groupe BPCE (balance sheet only for oil and gas, balance sheet and off-balance sheet for all other sectors). BPCE uses the metric calculated at the latest available date (reference year). This approach ensures the quality of the alignment parameter and consistency between the alignment scope and the target: with the exception of the oil and gas sector, the target (column “g”) is set with reference to balance sheet and off-balance sheet outstandings. However, it introduces a disconnection between the balance sheet outstandings published in column “c” and the alignment parameter and the target based on balance sheet and off-balance sheet outstandings. Reference year Year of metric calculation. Distance from the IEA NZE 2050 scenario in % Distance of the alignment parameter from the IEA (World Energy Outlook 2021) NZE scenario for 2030. For heavy industry, these scenarios could be recalculated based on IEA data to include Scope 1 and Scope 2 carbon. For oil and gas, calculation of the distance from a 30% reference decline in the IEA NZE vs. 2020. For aluminum, this is the International Aluminum Institute scenario at 1.5 degrees. Target (reference year + 3 years) Intermediate point deducted from the target for 2030. This target covers balance sheet and off-balance sheet outstandings. It is the result of a linear interpolation between the baseline and the target at 2030 when it could not be more precisely estimated (for lack of intermediate data on the counterparties). Linear interpolation is a method that has limitations, as it does not take into account the pace of low-carbon technological advances, which is expected to accelerate around 2030 for many sectors. This intermediate point (reference year + 3 years) does not in any way constitute a commitment made by Groupe BPCE. The target managed by Groupe BPCE is the one set as part of the NZBA approach by 2030. The data collected, methods and measurements carried out have not been subject to external verification. The data used regarding the clients are derived primarily from data providers or publications of Groupe BPCE. Differences may exist in the measurements of greenhouse gases from data providers (for example, in terms of geography and scope) as well as inaccuracies or incompleteness of the activities covered by the clients in their publications. Estimates will evolve as the quality of available data improves. To date and for information purposes, the quality levels of the carbon data measured at December 31, 2024 are estimated, according to the Partnership for Carbon Accounting Financials (PCAF) score, at 3.7 for oil and gas extraction and production, 2.6 for electricity production, 2.4 for the automotive sector, 2 for aviation and 3 for heavy industry (steel, cement and aluminum). It should be noted that with the exception of the aviation sector, for each of these sectors, more than 93% of the outstandings are covered by carbon data. Furthermore, the objectives targeted by Groupe BPCE are conditioned by the commitments of its clients and their ability to meet them over time. These objectives also depend on current government policies and the development of low-carbon technologies, which are critical for long-term horizons. These measurements and targets are based on methodologies known to date and which may change in the future.
Template 4: Banking book - Indicators of transition risk potentially linked to climate change: exposures to top 20 carbon-intensive firms
The identification of the counterparties constituting the list of the 20 companies considered to have the highest emissions is based on the public list provided by the Climate Accountability Institute. This list takes into account the emissions over the 1965-2018 period.
The assets included in the table consist of loans and advances, debt securities and equity instruments not held for trading granted to these counterparties. They are compared to the gross carrying amount of the assets included in the banking book, excluding financial assets held for trading and held for sale.
This amount includes the indirect financing of non-recourse discount type of invoices issued by these companies and aimed at financing their suppliers or the clients of the 20 companies considered to have the highest emissions.
This amount does not take into account off-balance sheet exposures (financial guarantees and other off-balance sheet exposures). It is, therefore, likely to rise due to an increase in drawdowns on loan commitments or an increase in financing needs. Groupe BPCE is committed to supporting its clients in their transition while ensuring that its support is provided in a responsible manner.
Template 5: Banking book - Indicators of the transition risk potentially linked to climate change: Exposures subject to physical risk
12/31/2025 a b c d e f g h i j k l m n o Gross carrying amount (in millions of euros) o/w exposures sensitive to impact from climate change physical events Breakdown by maturity bucket o/w
exposureso/w
exposureso/w
exposures
sensitive to
impact bothAccumulated impairment,
accumulated negative changes in
fair value due to credit risk and
provisionsVariable: Geographic area subject
to climate change physical risk –
acute and chronic events≤ 5 years > 5 years
≤ 10
years> 10
years ≤
20 years> 20
yearsWeighted
average
maturitysensitive to
impact from
chronic
climate
change
eventssensitive to
impact from
acute
climate
change
eventsfrom
chronic and
acute
climate
change
eventso/w Stage 2
exposureso/w non-
performing
exposureso/w Stage 2
exposureso/w non-
performing
exposures1 A - Agriculture, forestry and fishing 5,960 928 555 324 13 8 20 1,528 273 668 128 (116) (37) (76) 2 B - Mining and quarrying 2,767 875 99 6 1 3 112 792 77 180 11 (10) (2) (8) 3 C - Manufacturing 22,267 3,310 499 147 40 6 145 3,185 667 462 309 (195) (21) (167) 4 D - Electricity, gas, steam and air conditioning supply 13,416 3,581 896 2,209 735 8 696 5,947 778 563 183 (90) (20) (64) 5 E - Water supply; sewerage, waste management and remediation activities 2,337 134 44 105 34 10 18 168 131 32 1 (3) (2) (1) 6 F - Construction 17,468 131 37 87 0 6 25 221 9 113 2 (8) (7) (1) 7 G - Wholesale and retail trade; repair of motor vehicles and motorcycles 39,228 4,097 1,269 285 198 6 50 5,256 544 1,056 495 (363) (54) (297) 8 H - Transportation and storage 10,465 2,101 517 240 21 7 20 2,699 161 498 152 (89) (22) (63) 9 L - Real estate activities 132,391 2,287 2,647 4,486 167 10 2,597 6,138 851 1,380 266 (215) (67) (131) 10 Loans collateralized by residential immovable property 362,176 2,271 6,001 28,383 15,735 17 - 52,390 - 7,008 332 (155) (77) (71) 11 Loans collateralized by commercial immovable property - - - - - - - - - - - - - - 12 Repossessed collaterals - - - - - - - - - - - - - - 13 I - Accommodation and food service activities 11,789 538 338 311 2 8 339 641 210 320 52 (58) (25) (31) 14 J - Information and communication 10,508 89 3 - - 2 - 92 0 4 0 (0) (0) (0) 15 K - Financial and insurance activities 36,296 1,492 508 233 86 6 319 1,799 200 241 93 (102) (8) (89) 16 M - Professional, scientific and technical activities 23,829 1,609 176 223 86 8 40 2,008 46 320 54 (35) (14) (17) 17 N - Administrative and support service activities 13,800 759 565 235 13 6 1 1,565 5 24 3 (7) (0) (1) 18 O - Public Administration 300 - - 15 - 14 - 15 - - - - - - 19 P - Education 1,878 22 - - - 3 - 22 - - - (0) - - 20 Q - Human health services and social work activities 9,613 81 16 11 - 4 - 108 - - - (0) - - 21 R - Arts, entertainment and recreation 1,931 13 3 - - 3 - 16 - - - (0) - - 22 S - Other service activities 4,813 19 8 4 - 5 0 30 0 1 0 (0) (0) (0) 06/30/2025 a b c d e f g h i j k l m n o Gross carrying amount (in millions of euros) o/w exposures sensitive to impact from climate change physical events Breakdown by maturity bucket o/w
exposures
sensitive too/w
exposures
sensitive too/w
exposures
sensitive to
impact bothAccumulated impairment,
accumulated negative changes in
fair value due to credit risk and
provisionsVariable: Geographic area
subject to climate change
physical risk – acute and
chronic events≤ 5 years > 5
years ≤
10 years> 10
years ≤
20 years> 20
yearsWeighted
average
maturityimpact from
chronic
climate
change
eventsimpact from
acute
climate
change
eventsfrom chronic
and acute
climate
change
eventso/w Stage 2
exposureso/w non-
performing
exposureso/w Stage 2
exposureso/w non-
performing
exposures1 A - Agriculture, forestry and fishing 5,945 952 530 313 14 8 20 1,507 282 705 124 (119) (41) (76) 2 B - Mining and quarrying 2,499 598 112 6 6 4 102 518 102 159 11 (11) (3) (8) 3 C - Manufacturing 22,404 3,393 543 84 57 5 117 3,391 568 471 270 (178) (19) (152) 4 D - Electricity, gas, steam and air conditioning supply 14,077 4,212 822 2,223 543 8 667 6,401 731 616 148 (75) (19) (50) 5 E - Water supply; sewerage, waste management and remediation activities 2,310 149 83 109 34 9 20 179 174 32 3 (4) (2) (2) 6 F - Construction 17,482 168 41 84 0 6 25 259 9 128 2 (7) (6) (1) 7 G - Wholesale and retail trade; repair of motor vehicles and motorcycles 37,345 4,254 1,208 266 187 6 53 5,350 513 1,026 390 (341) (53) (277) 8 H - Transportation and storage 10,412 2,054 491 206 106 7 20 2,665 173 422 148 (81) (19) (58) 9 L - Real estate activities 131,258 2,263 2,719 4,441 156 10 2,560 6,060 958 1,667 226 (201) (73) (110) 10 Loans collateralized by residential immovable property 358,200 2,216 5,824 27,231 16,706 17 - 51,977 - 8,335 303 (154) (83) (65) 11 Loans collateralized by commercial immovable property - - - - - - - - - - - - - - 12 Repossessed collaterals - - - - - - - - - - - - - - 13 I - Accommodation and food service activities 11,587 658 310 273 2 7 348 643 252 372 51 (60) (26) (32) 14 J - Information and communication 9,941 79 3 - - 1 - 82 0 1 1 (0) (0) (0) 15 K - Financial and insurance activities 32,795 1,245 376 151 86 6 246 1,521 92 266 111 (101) (7) (90) 16 M - Professional, scientific and technical activities 23,063 1,581 142 226 54 7 29 1,919 54 330 35 (27) (11) (13) 17 N - Administrative and support service activities 14,505 617 421 267 0 6 1 1,296 7 56 1 (6) (2) (0) 18 O - Public Administration 406 - - 15 - 14 - 15 - - - - - - 19 P - Education 1,864 21 - - - 3 - 21 - - - (0) - - 20 Q - Human health services and social work activities 9,465 96 15 - 6 4 - 117 - - - (0) - - 21 R - Arts, entertainment and recreation 2,029 0 2 - - 7 - 3 - - - (0) - - 22 S - Other service activities 3,207 11 2 - - 3 - 13 0 2 - (0) (0) - The template shows the amounts of exposure to non-financial corporations as well as the amounts of residential real estate loans in France, potentially exposed to physical risks.
Concerning the amounts of exposure to the Group’s non-financial corporations, the valuation method is based on the geo-sectoral assessment of physical risks carried out during 2024:
- the qualification of the sensitivity of the various sectors of economic activity to six physical risk hazards (four acute hazards: flood, storm, forest fires, extreme hot temperature, and two chronic hazards: drought/shrink-swell and sea level rise);
- the qualification of the severity of the above hazards by geographical location, with regional granularity for France, at the state level for the United States of America, and at the country level for other locations.
Concerning the amounts of residential real estate loans in France, the valuation method is based on an external model that takes into account the individual location of the properties (when available) and covers the flood hazard and the shrink-swell hazard (shrinkage-swelling of clay soils). The shrink-swell hazard was integrated as of June 30, 2025.
For both scopes, the scenario adopted is the most unfavorable IPCC scenario by 2050 (RCP 8.5). The methodology does not take into account the financial impact for the counterparties or other mitigation measures (insurance, programs to combat natural disasters). Consequently, it does not necessarily imply that these exposures are subject to a higher risk of credit loss. The amounts provided in the model reflect a conservative approach and may not be comparable with peers who might have chosen other scenarios and methodologies.
-
17.1 Definition
As a major player in the financial system, Groupe BPCE relies on the notion of a trusted third party for the general public, its clients, investors and all economic players. Damage to Groupe BPCE’s reputation, particularly when associated with an unfavorable media campaign, could compromise the relationship of trust between the Group and both internal and external stakeholders. In such cases, the reputational risk may result in loss of revenue, increased operating costs, including an increase in capital requirements, as well as increased remedial costs in the event of failures in the implementation of regulatory obligations or the fulfillment of our commitments. This risk may also hamper Groupe BPCE when entering into new relationships or continuing relationships with clients or service providers. Moreover, this risk may also make it more difficult for Groupe BPCE to attract employees and candidates, increase its costs relating to refinancing and access to liquidity, or affect its image in the eyes of the marketplace and supervisors.
Groupe BPCE is exposed to reputational risks due to the diversity of its international banking, financial and insurance activities. This risk may arise following allegations concerning the promotion and marketing of its products and services, the nature of the financing and investments made, as well as the reputation of the Group’s partners. In addition, concerns may arise around Groupe BPCE’s environmental strategy and social policies or its governance, as discussed in Section 16. Lastly, Groupe BPCE’s reputation could also be compromised by the actions of external entities, such as cybercrime or cyber-terrorism, internal or external fraud, or the misappropriation of funds.
-
17.2 Governance
The reputation risk management framework is defined and implemented under the responsibility of the ESG Risk department within Groupe BPCE’s Risk division. This framework relies in particular on the expertise of the Communication, Impact and Compliance departments for the design and implementation of the risk management frameworks, as well as on all business lines and functions operating as the first line of defense for its operational implementation. The framework is rolled out within Groupe BPCE’s entities and operated at the local level, under the responsibility of each entity.
Groupe BPCE has set up a Group Reputation Risk Committee, which acts as the final decision-maker for matters posing a significant reputational risk to the Group.
This committee is chaired by the Chairman of the Management Board of Groupe BPCE. It brings together Groupe BPCE’s Risk division, the General Secretariat (including the Legal and Compliance departments), the Impact department and the Communication department of Groupe BPCE, as well as the business lines concerned according to the projects presented. It meets on an ad hoc basis, depending on the requests received from internal stakeholders.
The secretariat of the committee is provided by the ESG Risk department, which also coordinates the preliminary study of the requests received.
Groupe BPCE’s reputational risk policy sets out the framework for identifying, assessing, monitoring and managing reputational risks within Groupe BPCE. It applies to all Groupe BPCE entities as well as to all new and existing Group relationships, products, activities and transactions.
All Groupe BPCE institutions and material entities have applied Groupe BPCE’s reputational risk policy at their own level and have defined the applicable local governance. The local implementation of the reputational risk policy complies with the principles defined in Groupe BPCE’s reputational risk policy and, in particular, with the executive-level decision-making process for all significant reputational risks identified.
-
17.3 Reputational risk management framework
Reputational risk is given particular attention in the main operational decision-making processes (purchasing, entering into new relationships, investment, granting of credit). As part of these processes, significant reputational risks identified by stakeholders in the decision-making chain are escalated for decision-making at the level of the management of the entity concerned or of Groupe BPCE. Similarly, cross-functional frameworks such as the new products/new activities and exceptional operations processes, or the conduct and professional ethics framework, may also lead to the identification of sensitive situations from a reputational risk point of view.
The assessment of reputational risks is based on the monitoring and permanent analysis of the various information channels (press, social media, blogs, etc.) covering all the main Groupe BPCE entities in France and abroad. Based on this monitoring, the impact of each media event affecting Groupe BPCE is assessed and a summary score is produced monthly.
The aim of the reputation incident management framework is to ensure a rapid and relevant response from Groupe BPCE in the event of an incident involving its reputation, in order to limit the impact and implications of the event on its commercial and operational activities.
In general, incidents involving the reputation of Groupe BPCE or its entities are managed within the framework of crisis management frameworks put in place and coordinated by Groupe BPCE’s Communication department and its function, by involving the necessary internal stakeholders such as the Impact department and the relevant business lines.
-
17.4 Reputational risk monitoring and control framework
Reputational risk is included in Groupe BPCE’s internal risk inventory. As part of the risk materiality assessment process, it is subject to a quantitative assessment, based on the estimation of the losses associated with the increase in refinancing costs caused by a reputational event, and to an expert-based adjustment to reflect the other potential impacts of such an event.
Reputational risk is subject to a framework under the RAF. An observation threshold and a limit are set for the monthly level of the summary indicator measuring Groupe BPCE’s reputational risk, as well as for the presence of one or more events associated with a very negative reputation score.
Reputation risk is reported quarterly to Groupe BPCE’s risk governance bodies as part of the monitoring of Groupe BPCE’s risk appetite. In addition, the ESG Risk Committee also carries out quarterly monitoring of the main reputational events related to ESG issues and relations with civil society.
Groupe BPCE’s reputational risk management is based on the various operational processes and existing permanent controls. As part of the overall permanent control framework, specific control points for analyses related to reputational risk have been set up and deployed within Groupe BPCE’s entities.
-
17.5 Employee training and support
An “Identifying and preventing reputational risk” training module is made available to all Groupe BPCE employees and rolled out as a priority to the risk-takers of BPCE SA and Groupe BPCE’s Risk departments. This training module aims to give employees the keys for identifying reputational risk and its challenges, understanding the sources and qualifying the reputational risk in the context of their operational activities.
-
18 Remuneration policy
Information on the policies and practices on pay granted to members of the executive body and persons whose professional activities have a material impact on the corporate risk profile are available at the following address: https://www.groupebpce.com/en/investors/results-and-publications/pillar-iii/. -
19.1 Internal control policy
The internal control system defined by the Group contributes to the control of risks of all kinds and is governed by an umbrella charter – the Group Internal Control Charter – which stipulates that this system is designed, in particular, to ensure “[…] the reliability of financial and non-financial information reported both inside and outside the Group.” In this context, the Group has defined and put in place a permanent control system to ensure the quality of the accounting and financial information in accordance with the requirements defined by the order of November 3, 2014 on internal control and all other regulatory obligations relating to the quality of reporting (in particular those resulting from the application of Regulation (EU) 2019/876, known as “CRR II”).
- a first level exercised by all those involved in the production and reporting process. For Pillar III, the people involved in the process come mainly from the Risk and Finance functions and are coordinated by the Group Finance department (Financial and Non-Financial Communication);
- a second level is handled by independent units within the Risk, Compliance or Permanent Control functions. For Pillar III, this work is carried out by Group Corporate Secretary’s Office (Group Financial Control) and the Risk division (Permanent Risk Control).
Beyond these first two levels, controls may be carried out by the General Inspectorate (internal audit) as part of so-called periodic controls (or third level controls).
Included in the list of main reports published by BPCE (Reports booklet), Pillar III is governed by provisions strictly defined by the Group (in particular the Framework for the preparation and publication of reports and management indicators) aimed at strengthening the environment for producing, controlling and publishing the report and the quality of its underlying indicators.
- documentation and self-checking or control procedures, the drafting and implementation of which are the responsibility of the various contributing departments;
- a detailed mapping of roles and responsibilities in the implementation of controls updated by the Financial and Non-Financial Communication, which also carries out its own consistency checks;
- a steering and coordination system led by the Financial and Non-Financial Communication, and which is based, in particular, on the organization of a Steering Committee bringing together the heads of the main contributing departments and internal control. This committee monitors compliance with the production and control schedule, adjudicates the points submitted to it, and approves the filing of Pillar III with the Autorité des marchés financiers (AMF), the French financial markets authority.
The first-level controls consist of controls defined and implemented by each unit contributing to the production of Pillar III information. They aim in particular to ensure compliance with the rules defined by the CRR II and by the Group, and are carried out throughout the production process of the Pillar III report;
To ensure that the main reports published within the Group comply with all requirements, the Group has defined a procedure for assessing reports based on strict criteria and which aims to ensure that reports are established in a secure production environment and include reliable, clear, useful, and auditable data.
In this context, an independent review of the Pillar III report is carried out by the Group Corporate Secretary’s Office (Group Financial Control) and the Group Risk division (Permanent Risk Control) which mainly rely on:
- an assessment, as part of a risk-based approach, of the information to be published according to three risk levels (low, moderate and high) in order to select those that will require a targeted review;
- the application of an Independent review of deferrals grid based on a scoring method and composed of standard controls assessed on a scale between 1 (requirement not met) and 4 (requirement fully met) relating to:
- – the quality of the documentation,
- – the robustness of the organization relating to the production and publication of the report,
- – the quality of the audit trail of the data and/or indicators included in the report,
- – the effectiveness of the system of level one controls,
- – the accuracy of the data and/or indicators published and their consistency with the information provided in other publications,
- – the clarity of the information;
-
19.2 Statement on the publication of information required under Pillar III
I certify that, to the best of my knowledge, the disclosures provided in this document in relation to Pillar III comply with part 8 of CRR Regulation (EU) No. 575/2013 (and subsequent modifications) and have been prepared in accordance with the internal control framework agreed at BPCE management body level.
-
20.1 Index to Pillar III report tables
Pillar
III report table
numberTitle 2025 Pillar III
report pageOWN FUNDS EU KM1 Key metrics template 9 EU CC2 Transition from accounting balance sheet to prudential balance sheet 41 BPCE01 Phased-in regulatory capital 45 BPCE02 Changes in CET1 capital 46 BPCE03 Breakdown of non-controlling interests (minority interests) 46 BPCE04 Change in AT1 capital 47 BPCE05 Changes in Tier-2 capital 47 EU OV1 Overview of total risk exposure amounts 48 BPCE06 Risk-weighted assets by type of risk and business line 49 EU INS1 Insurance participations 49 EU CMS1 Comparison of the modeled amounts of risk-weighted exposure and standardized approach for risk 49 EU CMS2 Comparison of the modeled amounts of risk-weighted exposure and standardized approach for credit risk broken down by asset class 50 BPCE07 Regulatory capital and Basel III phased-in capital adequacy ratios 51 EU LR1 (LRSum) Summary reconciliation of accounting assets and leverage ratio exposures 52 EU LI3 Summary of the differences between the statutory and prudential scope of consolidation 54 EU LI1 Differences between accounting and regulatory scopes of consolidation and mapping of financial statement categories with regulatory risk categories 68 EU LI2 Main sources of differences between the regulatory exposure amounts and the carrying amounts in the financial statements 71 EU CC1 Composition of regulatory own funds 72 BPCE08 Additional Tier-1 capital 75 BPCE09 Issues of deeply subordinated notes 75 BPCE10 Tier-2 capital 75 BPCE11 Issues of subordinated notes 76 EU CCYB1 Geographical distribution of credit exposures relevant for the calculation of the countercyclical buffer 77 EU CCYB2 Amount of institution-specific countercyclical capital buffer 78 EU PV1 Prudent valuation adjustments (PVA) 79 EU LR2 (LRCom) Leverage ratio common disclosure 80 EU LR3 (LRSpl) Split-up of on balance sheet exposures (excluding derivatives, SFTs and exempted exposures) 82 EU INS2 Financial conglomerates information on own funds and capital adequacy ratio 82 EU KM2 Key indicators – TLAC ratio 82 EU TLAC1 Composition TLAC ratio 83 EU TLAC3a Rank in the hierarchy of creditors – Resolution group 85 CREDIT RISK BPCE12 Scope of standardized and IRB methods used by the Group 92 BPCE13 EAD breakdown by approach for the main segments 92 BPCE14 Concentration by borrower 101 BPCE15 Hedging of non-performing loans 102 EU CQ1 Credit quality of forborne exposures 103,111 EU CR1 Performing and non-performing exposures and related provisions 104,112 EU CQ3 Credit quality of performing and non-performing exposures by past due days 106,114 EU CQ4 Quality of non-performing exposures by geography 108,116 EU CQ5 Credit quality of loans and advances to non-financial corporations by industry 109,117 EU CR3 Disclosure of the use of credit risk mitigation techniques 110,118 EU CR1-A Maturity of exposures 120 EU CQ7 Collateral obtained by taking possession and execution processes 120 EU CR4 Standardised approach – Credit risk exposure and CRM effects 121 EU CR5 Standardised approach – Exposures by asset class and by risk weighting coefficient, after application of credit risk mitigation techniques 123 EU CR6 IRB approach – Credit risk exposures by exposure class and PD range 126 EU CR6-A Scope of the use of IRB and SA approaches 144 EU CR7 IRB approach – Effect on the RWEAs of credit derivatives used as CRM techniques 146 EU CR7-A IRB approach – Disclosure of the extent of the use of CRM techniques 147 EU CR8 RWEA flow statements of credit risk exposures under the IRB approach 149 EU CR9 IRB approach – Back-testing of PD per exposure class (fixed PD scale) 150 BPCE16 Average PD and LGD broken down by geographic area 164 BPCE17 Ex-post control of LGDs by exposure class 165 EU CR10 Specialised lending and equity exposures under the simple riskweighted approach 166 COUNTERPARTY RISK BPCE18 Breakdown of gross counterparty risk exposures by asset class (excluding other assets) and method 173 BPCE19 Breakdown by exposure class of risk-weighted assets for the credit valuation adjustment (CVA) 173 BPCE20 Securities exposed to counterparty risk on derivative transactions and repurchase agreements 174 BPCE21 Notional amount of derivatives 174 EU CVA1 Credit valuation adjustment risk under the reduced basic approach (R-BA) 175 EU CVA2 Credit valuation adjustment risk under the full basic approach (F-BA) 175 EU CCR1 Analysis of CCR exposure by approach 176 EU CCR3 Standardised approach – CCR exposures by regulatory exposure class and risk weights 177 EU CCR4 IRB approach – CCR exposures by exposure class and PD scale 178 EU CCR5 Composition of collateral for CCR exposures 182 EU CCR6 Credit derivatives exposures 183 EU CCR7 RWEA flow statements of CCR exposures under the IMM 183 EU CCR8 Exposures to CCPs 184 SECURITIZATION BPCE22 Breakdown of exposures by type of securitization 189 BPCE23 Breakdown of EAD and RWA by type of portfolio 189 BPCE24 Breakdown of investor securitization exposures in the banking book 190 BPCE25 Breakdown of investor and sponsor securitization exposures in the trading book 191 EU SEC1 Securitisation exposures in the non-trading book 192 EU SEC3 Securitisation exposures in the non-trading book and associated regulatory capital requirements - institution acting as originator or as sponsor 193 EU SEC4 Securitisation exposures in the non-trading book and associated regulatory capital requirements - institution acting as investor 194 BPCE26 Banking book – Breakdown of securitization outstandings 194 EU SEC2 Securitisation exposures in the trading book 195 EU SEC5 Exposures securitised by the institution - Exposures in default and specific credit risk adjustments 196 MARKET RISKS BPCE27 Groupe BPCE VaR – Breakdown by risk class 203 BPCE28 VaR – Evolution 203 BPCE29 Group stress test average 204 BPCE30 RWA and capital requirements by type of risk 204 BPCE31 Change in risk-weighted assets by impact 204 EU MR1 Market risk under the standardised approach 205 EU MR3 IMA values for trading portfolios 205 EU MR4 Comparison of VaR estimates with profit/loss 206 EU MR2-A Market risk under the internal Model Approach (IMA) 206 EU MR2-B RWA flow statements of market risk exposures under the IMA 207 BPCE32 Natixis Global VaR with guarantee – Trading book (VaR 99% 1-day) 207 BPCE33 Breakdown by risk class and netting 208 BPCE34 Natixis stressed VaR 208 BPCE35 IRC indicator 209 BPCE36 Natixis stress test results 209 LIQUIDITY, INTEREST RATE AND FOREIGN EXCHANGE RISKS BPCE37 Liquidity reserves 216 BPCE38 Liquidity gap 216 BPCE39 Sources and uses of funds by maturity 217 BPCE40 Interest rate gap 224 EU IRRBB1 Interest rate risks of non-trading book activities 224 EU LIQ1 Quantitative information of LCR 227 EU LIQ2 Net Stable Funding Ratio 228 EU AE1 Encumbered and unencumbered assets 230 EU AE2 Collateral received and own debt securities issued 231 EU AE3 Sources of encumbrance 232 OPERATIONAL RISKS EU OR1 Losses due to operational risk 260 EU OR2 Activity indicator, components and sub-components 261 EU OR3 Operational risk own funds requirements and risk-weighted exposure amounts 261 INSURANCE, ASSET MANAGEMENT AND FINANCIAL CONGLOMERATE RISKS BPCE41 Amount of CEGC regulated commitments 267 BPCE42 CEGC investment portfolio 267 ENVIRONMENTAL, SOCIAL AND GOVERNANCE RISKS TEMPLATE 1 Banking book - Indicators of transition risk potentially linked to climate change: Credit quality of exposures by sector, issues and residual maturity 296 TEMPLATE 2 Banking book - Indicators of transition risk potentially linked to climate change: Loans secured by real estate assets - Energy efficiency of collateral 302 TEMPLATE 3 Banking book - Indicators of transition risk potentially linked to climate change: Alignment parameters 304 TEMPLATE 4 Banking book - Indicators of the transition risk potentially linked to climate change: Exposures to the 20 companies that emit the most carbon in the world 307 TEMPLATE 5 Banking book - Indicators of the transition risk potentially linked to climate change: Exposures subject to physical risk 308 -
20.2 Pillar III cross-reference table
CRR
ArticleTopic Pillar III report reference Pillar III
report pages435 Objectives and risk management policy 4 Governance and risk management framework 26-36 436 Scope of consolidation 3 Capital management and capital adequacy 41,54-71 437 Capital 3 Capital management and capital adequacy 45-47,72-74 438 Capital requirements 3 Capital management and capital adequacy 48-50 439 Exposure to counterparty credit risk 6 Counterparty risk 172-184 440 Capital buffers 3 Capital management and capital adequacy 40,77 441 Global systemically important indicators BPCE website – Investment/regulated information section
Regulatory publications
442 Credit risk adjustments 5 Credit risk 90-91,100-107 443 Encumbered assets 9 Liquidity risk 230-232 444 Use of external credit rating agencies 5 Credit risk 94-96 445 Exposure to market risk 8 Market risks 200-209 446 Operational risk 11 Operational risk 256-262 447 Banking book equity exposures 5 Credit risk 166-168 448 Exposure to interest rate risk for banking book positions 9 Liquidity, interest rate and foreign exchange risks 223-224 449 Exposure to securitization positions 7 Securitization transactions 188-196 449 bis Prudential information on ESG risks 16 Environmental, social and governance risks 276-309 450 Remuneration policy BPCE website – Investment/regulated information section
Other information
451 Leverage 3 Capital management and capital adequacy 52 452 Use of the IRB approach for credit risk 5 Credit risk 92-96,126-165 453 Use of credit risk mitigation techniques 5 Credit risk 92-96,121-125 454 Use of advanced measurement approaches for operational risk 11 Operational risk N/A 455 Use of internal market risk models 8 Market risks 92-96,121-125 458 Macroprudential supervision measures 3 Capital management and capital adequacy 77-78 -
20.3 Glossary
Acronyms EBA The European Banking Authority, established by an EU Regulation on November 24, 2010. It came into being on January 1, 2011 in London, superseding the Committee of European Banking Supervisors (CEBS). This new body has an expanded mandate. It is in charge of harmonizing prudential standards, ensuring coordination among the various national supervisory authorities and performing the role of mediator. The goal is to establish a Europe-wide supervision mechanism without compromising the ability of the national authorities to conduct the day-to-day supervision of credit institutions ABS See securitization ACPR Autorité de contrôle prudentiel et de résolution (ACPR): French prudential supervisory authority for the banking and insurance sector (formerly the CECEI, or Comité des établissements de crédit et des entreprises d’investissement/Credit Institutions and Investment Firms Committee) Afep-Medef Association française des entreprises privées – Mouvement des entreprises de France/French Association of Private Sector Companies – French Business Confederation AFS Available For Sale ALM Asset/Liability management AMF Autorité des marchés financiers (AMF), the French financial markets authority AT1 Additional Tier-1 BCBS Basel Committee on Banking Supervision, an organization comprised of the central bank governors of the G20 countries, tasked with strengthening the global financial system and improving the efficacy of prudential supervision and cooperation among bank regulators ECB European Central Bank EIB European Investment Bank BMTN Negotiable medium-term notes BRRD Banking Recovery and Resolution Directive CCF Credit conversion factor CDO See securitization CDPC Credit Derivatives Products Company, i.e. a business specializing in providing protection against credit default through credit derivatives CDS Credit Default Swap, a credit derivative contract under which the party wishing to buy protection against a credit event (e.g. counterparty default) makes regular payments to a third party and receives a pre-determined payment from this third party should the credit event occur LTD Loan-to-Deposit ratio, i.e. a liquidity indicator that enables a credit institution to measure its autonomy with respect to the financial markets CLO See securitization CMBS See securitization CEGC Compagnie Européenne de Garanties et de Cautions CET1 Common Equity Tier-1 CFP Contingency Funding Plan CNCE Caisse Nationale des Caisses d’Epargne CPM Loan book Management CRD Capital Requirements Directive CRR Capital Requirements Regulation (European regulation) CVA Credit Valuation Adjustment: the expected loss related to the risk of default by a counterparty. The CVA aims to take into account the fact that the full market value of the transactions may not be recovered. The method for determining the CVA is primarily based on the use of market inputs in connection with the practices of market professionals CvaR Credit Value at Risk, i.e. the worst loss expected to be suffered after eliminating the 1% worst-case scenarios, used to determine individual counterparty limits DVA Debit Valuation Adjustment (DVA), symmetrical to the CVA. Represents the expected loss, from the counterparty’s perspective, on valuations of derivative liabilities. It reflects the impact of the entity’s own credit quality on the valuation of these instruments EAD Exposure at Default, i.e. the amount owed by the client at the effective default date. It is the sum of the remaining principal, past due payments, accrued interest not yet due, fees and penalties OFR Own Funds Requirements: i.e. 8% of risk-weighted assets (RWA) EL Expected Loss, i.e. the value of the loss likely to be incurred given the quality of the structure of the transaction and any measures taken to mitigate risk, such as real guarantees. It is calculated by multiplying Exposure at Risk (EAD) by Probability of Default (PD) and by Loss Given Default (LGD) DVA Debit Valuation Adjustment (DVA), symmetrical to the CVA. Represents the expected loss, from the counterparty’s perspective, on valuations of derivative liabilities. It reflects the impact of the entity’s own credit quality on the valuation of these instruments EURIBOR Euro Interbank Offered Rate, the benchmark interest rate on the Euro-zone’s money market FBF Fédération bancaire française (French Banking Federation), a professional body representing all banking institutions in France FCPR Fonds commun de placement à risque/Venture capital investment fund FGAS Fonds de garantie à l’accession sociale/French State guarantee fund for subsidized loans FINREP FINancial REPorting SRF Single Resolution Fund FSB Financial Stability Board: whose mandate is to identify vulnerabilities in the global financial system and to implement principles for regulation and supervision in the interest of financial stability. Its members are central bank governors, finance ministers and supervisors from the G20 countries GAP Asset/Liability management G-SIBs Global Systemically Important Banks: financial institutions whose distress or failure, because of their size, complexity and systemic inter-dependence, would cause significant disruption to the financial system and economic activity. These institutions meet the criteria established by the Basel Committee and are identified in a list published in November 2011 and updated every year. The constraints applicable to G-SIBs increase with their level of capital HQLA High-Quality Liquid Assets Non-life insurance policies (IARD) Incendie, accidents et risques divers/property and casualty Insurance IASB International Accounting Standards Board ICAAP Internal Capital Adequacy Assessment Process: Process provided for in Pillar II of the Basel Accords to ensure that firms have sufficient capital to cover all their risks ILAAP Internal Liquidity Adequacy Assessment Process: Process provided for in Pillar II of the Basel Accords through which the Group ensures the adequacy of its liquidity level and its management with regard to all its liquidity risks IFRS International Financial Reporting Standards IRB Internal-Ratings Based: an approach to capital requirements based on the financial institution’s internal rating systems IRBA Advanced IRB approach IRBF Foundation IRB approach IRC Incremental Risk Charge: the capital requirement for an issuer’s credit migration and default risks, covering a period of one year for fixed income and loan instruments in the trading book (bonds and CDSs). The IRC is a 99.9% Value at Risk measurement; i.e. the greatest risk obtained after eliminating the 0.1% worst-case scenarios L&R Loans and receivables LCR Liquidity Coverage Ratio (one month liquidity ratio): a measurement introduced to improve the short-term resilience of banks’ liquidity risk profiles. The LCR requires banks to maintain a reserve of risk-free assets that can be converted easily into cash on the market in order to cover its cash outflows minus cash inflows over a 30-day stress period without the support of central banks LBO Leveraged Buyout AML-CTF Anti-Money Laundering and Counter Terrorism Financing LGD Loss Given Default, a Basel II credit risk indicator corresponding to loss in the event of default MDA Maximum Distributable Amount, a new provision for banks placing restrictions on their dividend, Additional Tier-1 (AT1) coupon and bonus payments (under a rule that tightens restrictions as banks deviate from their requirements), if the capital buffers are not met. As these buffers are on top of Pillars I and II, they apply immediately if the bank fails to comply with the combined requirements SSM Single Supervisory Mechanism MREL Minimum Requirement for own funds and Eligible Liabilities MRU Single Resolution Mechanism NPE Non-Performing Exposure NPL Non-Performing Loan NSFR Net Stable Funding Ratio: this ratio is intended to strengthen the longer-term resilience of banks through additional incentives meant to encourage banks to finance their operations using more structurally stable resources. This long-term structural liquidity ratio, applicable to a one-year period, was formulated to provide a viable structure for asset and liability maturities OH Obligations de financement de l’habitat/Housing financing bond BCP Business Continuity Plan PD Probability of Default: the likelihood that a counterparty of the bank will default within a one-year period RMBS See securitization RSSI Head of Information Systems Security RWA Risk-Weighted Assets (RWA): the calculation of credit risks is further refined using a more detailed risk weighting that incorporates counterparty default risk and debt default risk S&P Standard & Poor’s SCF Compagnie de Financement Foncier, the Group’s covered bond issuer SEC US Securities and Exchange Commission SFH Housing Finance Company IS Information System SREP Supervisory Review and Evaluation Process:
Methodology for assessing and measuring the risks weighing on each bank. SREP gives the prudential authorities a set of harmonized tools to analyze a bank’s risk profile from four different angles: business model, governance and risk management, risk to capital, and risk to liquidity and funding.
The supervisor sends the bank the SREP decisions at the end of the process and sets key objectives. The bank must then “correct” these within a specific time
SRM Single Resolution Mechanism: an EU-level system to ensure an orderly resolution of non-viable banks with a minimal impact on taxpayers and the real economy. The SRM is one of the pillars of the European Banking Union and consists of an EU-level resolution authority (Single Resolution Board – SRB) and a common resolution fund financed by the banking sector (Single Resolution Fund – SRF) SVaR Stressed Value at Risk: the SVaR calculation method is identical to the VaR approach (historical or Monte Carlo method, scope – position, risk factors – choices and modeling – model approximations and numerical methods identical to those used for VaR) and involves a historical simulation (with “one-day” shocks) calculated over a one-year stressed period, at a 99% confidence level scaled up to 10 days. The goal is to assess the impacts of stressed scenarios on the portfolio and current market levels T1/T2 Tier-1/Tier-2 TLAC Total Loss Absorbing Capacity: a ratio applicable to G-SIBs that aims to ensure that each G-SIB has the capacity to continue its essential operations for the economy even after a loss has consumed all of its capital. In November 2015, the FSB published the final TLAC calibration: all TLAC-eligible instruments will have to be equivalent to at least 16% of risk-weighted assets at January 1, 2019 and at least 6% of the leverage ratio denominator. TLAC will subsequently have to be equivalent to 18% of risk-weighted assets and 6.75% of the leverage ratio denominator from January 1, 2022 TRS Total Return Swap, i.e. a transaction whereby two parties exchange the income generated and any change in value on two different assets over a given time period TSS Titres super subordonnés/deeply subordinated notes, i.e. perpetual bonds with no contractual redemption commitment that pay interest in perpetuity. In the event of liquidation, they are repaid after other creditors (subordinated loans). These securities pay annual interest contingent on the payment of a dividend or the achievement of a specific result VaR Value at Risk: a measurement of market risk on a bank’s trading book expressed as a monetary value. It allows the entity performing the calculation to appraise the maximum losses liable to be incurred on its trading book. A statistical variable, VaR is always associated with a confidence interval (generally 95% or 99%) and a specific time frame (in practice, one day or ten days, as the trading positions involved are meant to be unwound within a few days) Key technical terms Netting agreement A contract whereby two parties to a forward financial instrument (financial contract, securities loan or repurchase agreement) agree to settle their reciprocal claims under these contracts through a single consolidated net payment, particularly in the event of default or contract termination. A master netting agreement extends this mechanism to different transactions through one all-encompassing contract Equities An equity security issued by a corporation, representing a certificate of ownership and entitling the holder (the “shareholder”) to a proportional share in the distribution of any profits or net assets, as well as a voting right at the General Meeting Rating agency An organization that specializes in assessing the creditworthiness of issuers of debt securities, i.e. their ability to honor their commitments (repayment of capital and interest within the contractual period) Risk appetite Level of risk, expressed through quantitative or qualitative criteria, by type of risk and business line, that the Group is prepared to accept given its strategy. The risk appetite exercise is one of the key strategic oversight tools available to the Group’s management team Standardized approach An approach used to determine capital requirements relative to credit risk, pursuant to Pillar I of Basel II. Under this approach, the risk weightings used when calculating capital requirements are determined by the regulator Basel II (the Basel Accords) A supervisory framework aimed at better anticipating and limiting the risks borne by credit institutions. It focuses on banks’ credit risk, market risk and operational risk. The terms drafted by the Basel Committee were adopted in Europe through a European directive and have been applicable in France since January 1, 2008 Basel III (the Basel Accords) Changes in banking prudential standards which incorporated the lessons of the financial crisis of 2007-2008. They complement the Basel II Accords by strengthening the quality and quantity of minimum own funds that institutions must hold. Basel III also establishes minimum requirements for liquidity risk management (quantitative ratios), defines measures aimed at limiting procyclicality in the financial system (capital buffers that vary according to the economic cycle) and reinforces requirements for financial institutions deemed to be systemically important “Bank acting as originator” See securitization “Bank acting as sponsor” See securitization “Bank acting as investor” See securitization CRD IV/CRR (See acronyms) Directive 2013/36/EU (CRD IV) and Regulation (EU) 575/2013 (CRR), which transpose Basel II in Europe. In conjunction with the EBA’s (European Banking Authority) technical standards, they define European regulations for the capital, major risk, leverage and liquidity ratios Cost/income ratio A ratio indicating the portion of net banking income (used to cover operating expenses (the company’s operating costs). It is calculated by dividing operating costs by net banking income Collateral A transferable asset or guarantee pledged to secure reimbursement on a loan in the event the borrower fails to meet its payment obligations. Haircut The percentage by which a security’s market value is reduced to reflect its value in a stressed environment (counterparty risk or market stress) Derivative A financial security or financial contract whose value changes based on the value of an underlying asset, which may be either financial (equities, bonds, currencies, etc.) or non-financial (commodities, agricultural products, etc.) in nature. This change may coincide with a multiplier effect (leverage effect). Derivatives can take the form of either securities (warrants, certificates, structured EMTNs, etc.) or contracts (forwards, options, swaps, etc.). Exchange-traded derivative contracts are called futures Credit derivative A financial product whose underlying asset is a credit obligation or debt security (bond). The purpose of the credit derivative is to transfer credit risk without transferring the asset itself for hedging purposes. One of the most common forms of credit derivatives is the credit default swap (CDS) Senior debt
Non-preferred
Senior non-preferred debt is a category of securities, advances, instruments or rights introduced by Directive (EU) 2017/2399 amending Directive 2014/59/EU (BRRD) that, in the event of the insolvency of the credit institution, rank higher than the securities, advances, instruments or rights considered as subordinated, but lower than that of the other securities, advances, instruments or rights considered as senior (including senior preferred debt) Senior preferred debt Senior preferred debt is a category of securities, advances, instruments or rights that, in the event of the insolvency of the credit institution, rank higher than other securities, advances, instruments or rights considered as senior and subordinated (including senior non-preferred debt) Gross exposure Exposure before the impact of provisions, adjustments and risk mitigation techniques Tier-1 capital Core capital including the financial institution’s consolidated shareholders’ equity minus regulatory deductions Tier-2 capital Supplementary capital mainly consisting of subordinated securities minus regulatory deduction Fair value The price that would be received to sell an asset or paid to transfer a liability in a standard arm’s length transaction between market participants at the valuation date. The fair value is therefore based on the exit price Liquidity In a banking context, liquidity refers to a bank’s ability to cover its short-term commitments. Liquidity also refers to the degree to which an asset can be quickly bought or sold on a market without a substantial reduction in value Rating An appraisal by a financial rating agency (Fitch Ratings, Moody’s, Standard & Poor’s) of the creditworthiness of an issuer (company, government or other public entity) or a transaction (bond issue, securitization, covered bond). The rating has a direct impact on the cost of raising capital Bond A portion of a loan issued in the form of an exchangeable security. For a given issue, a bond grants the same debt claims on the issuer for the same nominal value, the issuer being a company, a public sector entity or a government Pillar I Pillar I sets minimum requirements for capital. It aims to ensure that banking institutions hold sufficient capital to provide a minimum level of coverage for their credit risk, market risk and operational risk. The bank can use standardized or advanced methods to calculate its capital requirement Pillar II Pillar II establishes a process of prudential supervision that complements and strengthens Pillar I.
It consists of:
• an analysis by the bank of all of its risks, including those already covered by Pillar I;
• an estimate by the bank of the capital requirement for these risks;
• a comparison by the banking supervisor of its own analysis of the bank’s risk profile with the analysis conducted by the bank, in order to adapt its choice of prudential measures where applicable, which may take the form of capital requirements exceeding the minimum requirements or any other appropriate technique
Pillar III Pillar III is concerned with establishing market discipline through a series of reporting requirements. These requirements – both qualitative and quantitative – are intended to improve financial transparency in the assessment of exposure to risks, risk assessment procedures and capital adequacy Common Equity Tier-1 ratio Ratio of Common Equity Tier-1 (CET1) capital to risk-weighted assets. The CET1 ratio is a solvency indicator used in the Basel III prudential accords Leverage ratio Tier-1 capital divided by exposures, which consist of assets and off-balance sheet items, after restatements of derivatives, funding transactions and items deducted from capital. Its main goal is to serve as a supplementary risk measurement for capital requirements Total capital ratio Ratio of total capital (Tier 1 and 2) to risk-weighted assets (RWAs) Re-securitization The securitization of an exposure that is already securitized where the risk associated with an underlying pool of exposures is tranched and at least one of the underlying exposures is a securitization position Credit and counterparty risk The risk of loss from the inability of clients, issuers or other counterparties to honor their financial commitments. Credit risk includes counterparty risk related to market transactions and securitization Market risks The risk of loss of value on financial instruments resulting from changes in market inputs, from the volatility of these inputs or from the correlations between these inputs Operational risk Risks of losses or penalties due in particular to failures of internal procedures and systems, human error or external events Structural interest rate and foreign exchange risk The risk of losses or impairment on assets arising from changes in interest rates or exchange rates. Structural interest rate and foreign exchange risks are associated with commercial activities and proprietary transactions Liquidity risk The risk that a bank will be unable to honor its payment commitments as they fall due and replace funds when they are withdrawn Swap An agreement between two counterparties to exchange different assets, or revenues from different assets, until a given date Securitization A transaction whereby credit risk on loans and advances is transferred to investors by an entity through the issuance of negotiable securities. This may involve the transfer of advances (physical securitization) or the transfer of risks only (credit derivatives). Some securitization transactions are subordinated through the creation of tranches:
• ABS – Asset-Backed Securities, i.e. instruments representing a pool of financial assets (excluding mortgage loans), whose performance is linked to that of the underlying asset or pool of assets;
• CDOs – Collateralized Debt Obligations, i.e. debt securities backed by a pool of assets which can be either bank loans (mortgages) or corporate bonds. Interest and principal payments may be subject to subordination (i.e. through the creation of tranches);
• CLO – Collateralized Loan Obligations, i.e. credit derivatives backed by a homogeneous pool of commercial loans;
• CMBS – Commercial Mortgage-Backed Securities;
• RMBS – Residential Mortgage-Backed Securities, i.e. debt securities backed by a pool of assets consisting of residential mortgage loans;
• Bank acting as originator: the securitization exposures are the retained positions, even where not eligible for the securitization framework due to the absence of significant and effective risk transfer;
• Bank acting as investor: investment positions purchased in third-party deals;
• Bank acting as sponsor: a bank is considered a “sponsor” if it, in fact or in substance, manages or advises the program, places securities into the market, or provides liquidity and/or credit enhancements. The program may include, for example, asset-backed commercial paper (ABCP) conduit programs and structured investment vehicles. The securitization exposures include exposures to ABCP conduits to which the bank provides program-wide enhancements, liquidity and other facilities
Net value Total gross value less allowances/impairment Volatility A measurement of the magnitude of an asset’s price fluctuation and thus a measurement of its risk. Volatility corresponds to the standard deviation of the asset’s immediate returns over a given period Other terms Back office Support or back office department, in charge of administrative functions at a financial intermediary Backtesting Method consisting of verifying that the actual result rarely exceeds the VaR (Value at Risk) loss Bail-in Tool to limit any assistance from public funds to a troubled institution that is still in operation or in the process of liquidation. The bail-in grants to the prudential supervisory authorities the power to impose on certain creditors of a credit institution that may have solvency problems, the conversion of their receivables into shares of this institution and/or the reduction of the amount of these receivables. The European agreement of June 26, 2015 provides for priority requests, in the event of insufficient equity (following losses), from creditors holding subordinated debt, then senior creditors, then unsecured deposits of large companies, then those of SMEs and finally those of individuals above €100,000. However, guaranteed deposits, covered bonds, employee compensation, liabilities related to the institution’s vital activities and interbank liabilities with a maturity of less than seven days must not be affected Broker Broker Brokerage Brokerage Co-lead Co-lead Commodities Commodities Corporate Corporate Coverage Hedging (in the sense of client follow-up) Covered bonds Covered or collateralized bond: bond for which the repayment and payment of interest are ensured by income flows from a portfolio of high-quality assets that serves as collateral, often a portfolio of mortgages, and the issuing institution is often the manager of the payment of flows to investors (obligations foncières in France, Pfandbriefe in Germany) Datacenter Datacenter Equity (tranche) In a securitization arrangement, refers to the tranche that bears the first losses due to defaults in the underlying portfolio Fully-loaded Expresses full compliance with the Basel III solvency requirements (which became mandatory in 2019) Front office Customer service (team of market operators) Hedge funds Alternative management funds: speculative investment funds that aim for an absolute return and have a great deal of freedom in their management Holding Parent company Investment grade Long-term rating provided by an external agency ranging from AAA/Aaa to BBB-/Baa3 of a counterparty or underlying issue. A rating equal to or lower than BB+/ Ba1 qualifies the instrument as non-investment grade Joint venture Joint venture Loss ratio Ratio between claims/premiums collected Mark-to-market A method that consists of regularly or even continuously valuing a position on the basis of its market value at the time of the valuation Mark-to-model Method which consists of valuing a position on the basis of a financial model and therefore assumptions made by the valuer Monoline Companies that provide credit enhancement to financial market participants New Deal Strategic plan implemented by Natixis Phase-in Refers to compliance with current solvency requirements, taking into account the transitional period for the implementation of Basel III Reporting Reporting Spread Actuarial margin: difference between the actuarial rate of return of a bond and that of a risk-free loan of identical duration Trading Trading Watchlist Watchlist -

-