PILLAR III 2021
-
Foreword
Regulation (EU) No. 2019/876 (CCR2) includes new provisions relating to the calculation of risk-weighted assets and new ratio requirements, applicable from June 28, 2021. The main impacts for Groupe BPCE are as follows:
•the leverage ratio and net stable funding ratio (NSFR) requirements become effective, with a minimum of 3% for leverage and 100% for the NSFR;
•a new Standardized Approach (SA-CCR), corresponding to the sum of the replacement cost and the calculated potential future exposure, is now applied to the calculation of the exposure value of derivatives; until now, this exposure was modeled using the mark-to-market method.
This report presents information on Groupe BPCE’s risks; the format of the Pillar III tables changed on June 30, 2021 according to the technical standards defined by implementing regulation (EU) No. 2021/637.
-
Structure of the Pillar III report
-
1 KEY FIGURES
(1)
CRR/CRD IV without transitional measures; additional Tier 1 capital takes into account subordinated issues that have become ineligible at the phase-out rate in force.
in millions of euros
12/31/2021
09/30/2021
06/30/2021
03/31/2021
12/31/2020
AVAILABLE CAPITAL
Common Equity Tier 1 (CET1)
69,764
69,897
68,440
69,743
68,969
Tier 1 capital
69,764
69,897
68,440
69,743
68,978
Total capital
82,715
78,093
76,991
78,933
78,235
RISK-WEIGHTED ASSETS
Total risk-weighted assets
441,428
442,119
439,589
434,082
431,222
CAPITAL RATIOS (AS A PERCENTAGE OF RISK-WEIGHTED ASSETS)
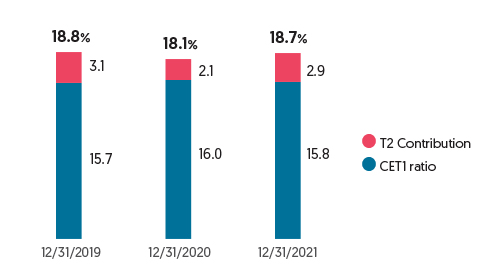
Common Equity Tier 1 ratio
15.80%
15.81%
15.57%
16.07%
15.99%
Equity Tier 1 ratio
15.80%
15.81%
15.57%
16.07%
16.00%
Total capital ratio
18.74%
17.66%
17.51%
18.18%
18.14%
ADDITIONAL CAPITAL REQUIREMENTS TO ADDRESS RISKS OTHER THAN THE EXCESSIVE LEVERAGE RISK (AS A PERCENTAGE OF THE RISK-WEIGHTED ASSETS)
Additional capital requirements to address risks other than excessive leverage risk
1.75%
1.75%
1.75%
1.75%
1.75%
of which: to be met with CET 1 capital
1.31%
1.31%
1.31%
1.31%
1.31%
of which: to be met with Tier 1 capital
1.31%
1.31%
1.31%
1.31%
1.31%
Total SREP capital requirement
9.75%
9.75%
9.75%
9.75%
9.75%
OVERALL BUFFER REQUIREMENT AND OVERALL CAPITAL REQUIREMENT (AS A PERCENTAGE OF THE RISK-WEIGHTED ASSETS)
Capital conservation buffer
2.50%
2.50%
2.50%
2.50%
2.50%
Conservation buffer due to macro-prudential or systemic risk at the level of a Member State
0.00%
0.00%
0.00%
0.00%
0.00%
Institution-specific countercyclical capital buffer
0.02%
0.01%
0.01%
0.01%
0.01%
Systemic risk buffer
0.00%
0.00%
0.00%
0.00%
0.00%
Global systemically important institution buffer
1.00%
1.00%
1.00%
1.00%
1.00%
Other systemically important institution buffer
0.00%
0.00%
0.00%
0.00%
0.00%
Overall buffer requirement
3.52%
3.51%
3.51%
3.51%
3.51%
Total capital requirements
13.27%
13.26%
13.26%
13.26%
13.26%
CET1 capital available after compliance with total SREP(1) capital requirements
9.99%
10.00%
9.76%
10.25%
10.18%
LEVERAGE RATIO
Total exposure measure
1,212,857
1,208,391
1,198,965
1,283,262
1,238,142
Leverage ratio
5.75%
5.78%
5.71%
5.43%
5.57%
ADDITIONAL CAPITAL REQUIREMENTS TO ADDRESS THE EXCESSIVE LEVERAGE RISK (AS A PERCENTAGE OF THE TOTAL EXPOSURE MEASURE)
Additional capital requirements to address the excessive leverage risk
0.00%
0.00%
0.00%
of which: to be met with CET 1 capital
0.00%
0.00%
0.00%
Total SREP leverage ratio requirement
3.23%
3.23%
3.23%
LEVERAGE RATIO BUFFER REQUIREMENT AND OVERALL LEVERAGE RATIO REQUIREMENT (AS A PERCENTAGE OF TOTAL EXPOSURE MEASURE)
Leverage ratio buffer requirement
-
-
-
Overall leverage ratio requirement
3.23%
3.23%
3.23%
LIQUIDITY COVERAGE RATIO
Total High Quality Liquid Assets (HQLA) (weighted average)
222,399
230,746
202,842
227,186
203,029
Cash outflows – Total weighted value
205,973
215,817
191,004
203,894
191,463
Cash inflows – Total weighted value
67,903
69,934
70,047
71,610
70,495
Total net cash outflows (adjusted value)
138,069
145,883
120,957
132,284
120,968
Liquidity coverage ratio
161.08%
158.17%
167.70%
171.74%
167.84%
NET STABLE FUNDING REQUIREMENT
Total available stable funding (ASF)
875,323
845,049
841,840
Total RSF
756,669
734,732
726,414
NSFR ratio
115.68%
115.01%
115.89%
-
1.1 Types of risk
Risk macro-categories
Definition
Credit and counterparty risks
The risk of loss resulting from the inability of clients, issuers or other counterparties to honor their financial commitments. It includes counterparty risk related to market transactions (replacement risk) and securitization activities. It can be exacerbated by concentration risk.
Financial risks
•Market risk
The risk of loss of value on financial instruments resulting from changes in market inputs, from the volatility of these inputs or from the correlations between these inputs. Inputs include exchange rates, interest rates and prices of securities (equities, bonds), commodities, derivatives or any other assets, such as real estate assets.
•Liquidity risk
Risk that the Group cannot meet its cash requirements or collateral requirements when they fall due and at a reasonable cost.
•Structural interest rate risk
Risk of loss in interest income or in the value of a fixed-rate structural position in the event of changes in interest rates. Structural interest rate risks are associated with commercial activities and proprietary transactions.
•Credit spread risk
Risk associated with a decline in the creditworthiness of a specific issuer or a specific category of issuers.
•Exchange rate risk
The risk of loss in interest income or in the value of a fixed-rate structural position in the event of changes in exchange rates. Structural interest rate and foreign exchange risks are associated with commercial activities and proprietary transactions.
Non-financial risks
•Non-compliance risk
The risk of a legal, administrative or disciplinary penalty, material financial loss or reputational risk arising from a failure to comply with the provisions specific to banking and financial activities (whether these are stipulated by directly applicable national or European laws or regulations), with professional or ethical standards, or instructions from the executive body, notably issued in accordance with the policies of the supervisory body.
•Operational risk
The risk of loss resulting from inadequacies or malfunctions attributable to procedures, employees and internal systems (including in particular information systems) or external events, including events with a low probability of occurrence, but with a risk of high loss.
Insurance underwriting risks
In addition to asset-liability risk management (interest rate, valuation, counterparty and foreign exchange risks), these risks include pricing risk in respect of mortality risk premiums and structural risks related to life and non-life insurance activities, including pandemics, accidents and disasters (earthquakes, hurricanes, industrial accidents, terrorist acts and military conflicts).
Strategic business and ecosystem risks
•Solvency risk
The risk that the company will be unable to honor its long-term commitments and/or ensure the continuity of its ordinary operations in the future.
•Climate risks
Vulnerability of banking activities to climate change, where a distinction can be made between physical risk directly relating to climate change and transition risk associated with efforts to combat climate change.
-
1.2 Regulatory changes
Fragmentation and withdrawal accentuated by the health crisis in Europe
At its meetings in June and July 2021, the Financial Services Committee of the European Union, composed of high-level representatives of the Member States and the European Commission, presented an overview of the measures intended to support the banking sector and borrowers faced with the pandemic-related crisis, and proposed that the Member States consider new measures that could be implemented, in particular in terms of regulatory flexibility and supervision.
However, these meetings took place in a general context of mistrust between Member States that do not share the same vision of the Banking Union, which poses the risk of a major political and economic “split” in Europe.
The Franco-German duo no longer imposes its vision on the rest of Europe and its ability to "make common cause" on certain issues appears fragile, after two months of bitter discussions in Germany this autumn to form a coalition government between the Social Democrats of the SPD, the Liberals of the FPD and the Greens, and the early launch ‒ and not without turbulence ‒ of the electoral campaign in France, which will end with the first round of the presidential election on April 10, 2022.
-
2 RISK FACTORS
The banking and financial environment in which Groupe BPCE operates is exposed to numerous risks which obliges it to implement an increasingly demanding and strict policy to control and manage these risks.
Some of the risks to which Groupe BPCE is exposed are set out below. However, this is not a comprehensive list of all of the risks incurred by Groupe BPCE in the course of conducting its business or given the environment in which it operates. The risks presented below are those identified to date as significant and specific to Groupe BPCE, and liable to have a material adverse impact on its business, financial position and/or results. For each of the risk sub-classes listed below, the risk factor considered to date by Groupe BPCE as the most significant is listed first.
-
Strategic, business and ecosystem risks
The ongoing coronavirus (Covid-19) pandemic and its economic consequences may adversely impact the Group’s operations, results and financial position.
The emergence of Covid-19 in late 2019 and rapid spread of the pandemic across the globe led to a deterioration in economic conditions in multiple business sectors, a deterioration in the financial position of economic players, while also disrupting the financial markets. In response, many affected countries were forced to implement preventive health measures (closed borders, lockdown measures, restrictions on certain economic activities, etc.). In particular, the sudden recession gripping affected countries and the drop in global trade have had and will continue to have negative effects on global economic conditions for as long as global production, investments, supply chains and consumer spending are impacted, in turn impacting the business operations of the Group, its customers and its counterparties.
The persistence of the Covid-19 pandemic and the emergence of new strains of the virus have led to new restrictions, even if these have not been as drastic as in 2020 (notably, a new lockdown in France and in a number of European countries, local and national curfews, border closures, or severe travel restrictions) and, after a rebound, the economic environment could deteriorate further. Despite the favorable development of vaccination, the Covid-19 pandemic still remains the master of economic recovery time, with the spread of new variants such as the “Delta” variant in the second half of 2021 or the “Omicron” variant detected in late November 2021 threatening the pace of economic expansion. The epidemic continues to profoundly disrupt international and French economic momentum. Its duration does not cease to surprise, fueling both uncertainty and fatigue in the face of ongoing health restrictions. This situation could last several months, and thus adversely affect the Group’s business, financial performance and results.
Massive fiscal and monetary policy measures to support activity have been put in place since 2020, notably by the French government (State-guaranteed loans for businesses and professional customers, for individual customers, short-time working measures as well as numerous other fiscal, social and bill-paying measures) and by the European Central Bank (more abundant and cheaper access to very large refinancing packages). Groupe BPCE has actively participated in the French State-guaranteed loan program in the interest of financially supporting its customers and helping them overcome the effects of this crisis on their activities and income (e.g. automatic six-month deferral on loans to certain professional customers and micro-enterprises/SMEs). There is no way to guarantee, however, that such measures will be enough to offset the negative impacts of the pandemic on the economy or to fully stabilize the financial markets over the long term.
The lockdown or restriction measures taken at the beginning of this crisis, particularly in France, where the Group mainly operates (84% of exposures (in gross value) as of December 31, 2021 are located in France), have significantly reduced the activity of many economic players. In 2021, the global economy rebounded strongly, but the health crisis continued to affect community services specifically, due to the relative maintenance of health restrictions. The Group’s results and financial position are impacted by such measures, due to decreased income and a decline in the quality of assets both in general and in certain particularly hard-hit sectors. Within the Corporate and Professional portfolios, the sectors most likely to be affected at present are mainly the Wholesale and non-food retail sectors (gross exposure on December 31, 2021 of €16.7 billion), Tourism-Hotels-Catering (gross exposure on December 31, 2021 of €15.5 billion), Automotive (gross exposure on December 31, 2021 of €5.6 billion), Consumer goods excluding cosmetics and personal care (gross exposure on December 31, 2021 of €5.2 billion) and Real Estate Professionals excluding residential exposure (gross exposure on December 31, 2021 of €1.9 billion).
In 2020, this environment resulted in a very significant increase in the cost of risk to nearly €3 billion (equal to 41 basis points compared to 19 basis points in 2019), mainly due to the impact of the Covid-19 crisis on the inclusion of forward-looking information in the assessment of expected losses and to the increase in individual provisions concentrated on the Energy and Natural Resources sector, and more particularly Oil and Gas, in Corporate & Investment Banking. In 2021, the cost of risk fell by 40.5% compared to the cost of risk recorded for 2020 (equivalent to 23 basis points), in a context of low level of defaults, and maintaining the levels of provisions allocated under Stages 1 and 2 in anticipation of potential future defaults. The credit risk impairment methodology applied and the assumptions taken into account in the scenarios are described in § 7.1.2. in the paragraph “Methodology for assessing the deterioration of credit risk and expected credit losses” of Groupe BPCE’s consolidated financial statements included in the 2021 Universal Registration Document.
The Group’s results and financial position may also be impacted by adverse financial market developments (extreme volatility, equity market and index slump, spread tensions, steep and unforeseen decline in dividends, etc.). This was the case in the first half of 2020, as the valuation of certain products was affected by market illiquidity, in particular Natixis’ Corporate & Investment Banking operations, which were exposed to significant adjustment effects of certain valuation parameters such as the “dividend” component.
A deterioration in the economic environment and its impact on the Group could increase the risk of its external ratings being downgraded. Furthermore, the French government’s ratings may end up being downgraded, due in large part to an increase in the national debt and public deficits. These factors could have a negative impact on the Group’s funding cost on the financial markets.
More generally, the Covid-19 epidemic poses a risk to Groupe BPCE, insofar as it (i) causes organizational changes (remote working, for example) that may cause an operational risk; (ii) it induces a slowdown in money market transactions and could have an impact on the supply of liquidity; (iii) it increases the liquidity needs of customers and therefore the amounts loaned to these customers to enable them to withstand the crisis; (iv) it could lead to an increase in business failures, particularly among the most vulnerable companies or in the most exposed sectors; and (v) it causes sudden movements in the valuation of market assets, which could have an impact on the market activities or on the investments of the institutions.
Changes in the situation related to Covid-19 (uncertainty as to the duration, extent and future trajectory of the pandemic, the introduction of new lockdown measures or restrictions in the event of additional epidemic waves related to the emergence of new strains of the virus, the speed of vaccination rollout or the efficacy of vaccines against variants) are a major source of uncertainty and make it difficult to predict the overall impact on the Group’s main markets and, more generally, the global economy; on the filing date (publication) of this Pillar III report, the impact of this situation, taking into account the aforementioned support measures, on Groupe BPCE’s business lines (Retail banking, Insurance, Asset Management, Corporate & Investment Banking), its results (net banking income and cost of risk in particular) and its financial position (liquidity and solvency) remains difficult to quantify.
On July 8, 2021, Groupe BPCE announced its BPCE 2024 strategic plan. It is structured around the following three strategic priorities: (i) a winning spirit, with €1.5 billion in additional revenues in five priority areas, (ii) customers, by offering them the highest quality service with an adapted relationship model, and (iii) the climate, through concrete and measurable commitments that are part of a Net zero trajectory. The BPCE 2024 strategic plan is based on the following three pillars: (i) simplicity: because Groupe BPCE seeks efficiency and customer satisfaction, it aims for greater simplicity; (ii) innovation: because Groupe BPCE is driven by an entrepreneurial spirit and is aware of the reality of the changes underway, it is strengthening its capacity for innovation; and (iii) security, because Groupe BPCE is committed to the long term, it gives priority to the security of its development model. These strategic objectives were developed in the context of the Covid-19 crisis, which has acted as an indicator and accelerator of fundamental trends (in particular, digitization, hybrid work, energy transition) and reflects Groupe BPCE’s desire to accelerate its development by supporting its customers in their economic recovery and their projects to emerge from the health crisis. The success of the BPCE 2024 strategic plan is based on a very large number of initiatives to be implemented within the various business lines of Groupe BPCE. Although many of these targets can be achieved, it is possible that not all of them will be, nor is it possible to predict which of these goals will not. The BPCE 2024 strategic plan also calls for significant investments, but if the plan’s objectives are not met, the return on these investments may be lower than expected. If Groupe BPCE does not achieve the targets defined in its BPCE 2024 strategic plan, its financial position and results could be more or less significantly affected.
The physical and transition components of climate risk, together with their repercussions for economic players, could adversely affect the activities, income and financial position of Groupe BPCE.
The risks associated with climate change are factors that exacerbate existing risks, including credit risk, operational risk and market risk. In particular, BPCE is exposed to physical and transition climate risk. They potentially carry an image and/or reputation risk.
Physical risk leads to increased economic costs and financial losses resulting from the severity and increased frequency of extreme weather events related to climate change (such as heat waves, landslides, floods, late frosts, fires and storms), as well as long-term gradual changes in climate (such as changes in rainfall patterns, extreme weather variability, and rising sea levels and average temperatures). It could have an extensive impact in terms of scope and magnitude, that may affect a wide variety of geographic areas and economic sectors relevant to Groupe BPCE. For example, the Cévennes episodes that affect the south-east of France every year can cause buildings, factories and offices to flood, slowing down or even making it impossible for some of the Group’s customers to carry out their activities. For example, an SME customer of Groupe BPCE producing a component essential to the opening of buildings was flooded at the end of 2019, causing it to file for bankruptcy. Moreover, this SME was supplying a real estate project whose construction had to stop while a new supplier was found. The real estate project was delayed, which led to a credit risk on the transaction for the bank financing it: late penalties, late opening for sale or rent, etc. Thus, physical climate risk can spread along the value chain of Groupe BPCE’s corporate customers, which can lead to default and thus generate financial losses for Groupe BPCE. These physical climate risks are likely to increase and could lead to significant losses for Groupe BPCE.
The transition risk is connected to the process of adjusting to a low-carbon economy. The process of reducing emissions is likely to have a significant impact on all sectors of the economy by affecting the value of financial assets and the profitability of companies. The increase in costs related to this energy transition for economic players, whether corporates or individual customers, could lead to an increase in defaults and thus significantly increase Groupe BPCE’s losses. For example, the French law “Energie-Climat” of November 8, 2019 is expected to limit from 2028 the sale and rental of real estate with very low energy performances. Some of Groupe BPCE’s customers will therefore have to plan renovation work for a possible future sale or lease of such type of properties. The risk lies in the impossibility for Groupe BPCE’s customers to carry out this costly work and consequently being unable to complete the financial transaction necessary to balance their budget. These customers of Groupe BPCE could therefore become insolvent, which would result in significant financial losses for Groupe BPCE.
A persistently low interest rate environment may have an adverse impact on Groupe BPCE’s profitability and financial position.
The global markets have been subject to low interest rates in recent years, and it appears this situation will not be changing anytime soon. When interest rates are low, credit spreads tend to tighten, meaning Groupe BPCE may not be able to sufficiently lower interest rates paid on deposits to offset the drop in revenues associated with issuing loans at lower market rates. Groupe BPCE’s efforts to reduce the cost of deposits may be restricted by the high volumes of regulated products, especially on the French market, including in particular Livret A passbook savings accounts and PEL home savings plans, which earn interest above the current market rate. In addition, Groupe BPCE may incur an increase in prepayments and renegotiations of home loans and other fixed-rate loans to individuals and businesses, as customers seek to take advantage of lower borrowing costs. Combined with the issuance of new loans at low interest rates prevailing on the markets, Groupe BPCE may see an overall decrease in the average interest rate in the loan book. Reduced credit spreads and weaker retail banking revenues stemming from this decrease may undermine the profitability of the retail banking activities and overall financial position of Groupe BPCE. Furthermore, if market rates begin climbing again and Groupe BPCE’s hedging strategies prove ineffective or only partially offset this fluctuation in value, its profitability may be affected. An environment of persistently low interest rates may also cause the market yield curve to flatten more generally, which in turn may lower the premium generated by Groupe BPCE’s financing activities and have an adverse impact on its profitability and financial position. The flattening of the yield curve may also encourage financial institutions to enter into higher-risk activities in an effort to obtain the targeted level of return, which may heighten risk and volatility on the market.
The stress tests carried out by Groupe BPCE on its capital markets activities show that, at December 31, 2021, the most sensitive hypothetical stress test is the “emerging market crisis” scenario and that the most impacting historical scenario is the “2011 sovereign crisis” scenario.
For information purposes, the change in Groupe BPCE’s projected one-year net interest income calculated under four scenarios (“rate increase,” “rate decrease,” “steepening of the curve,” “flattening of the curve”) compared to the core scenario showed the “rate decrease” to be the most adverse scenario.
Groupe BPCE may be vulnerable to political, macro-economic and financial environments or to specific circumstances in its countries of operation.
Some Groupe BPCE entities are exposed to country risk, which is the risk that economic, financial, political or social conditions in a foreign country (particularly in countries where the Group conducts business) may affect their financial interests. Groupe BPCE predominantly does business in France (81% of net banking income for the fiscal year ended December 31, 2021) and North America (11% of net banking income for the fiscal year ended December 31, 2021), with other European countries and the rest of the world accounting for 5% and 3%, respectively, of net banking income for the fiscal year ended December 31, 2021. Note 12.6 to the consolidated financial statements of Groupe BPCE “Locations by country,” contained in the 2021 Universal Registration Document lists the entities established in each country and gives a breakdown of net banking income and income before tax by country of establishment.
A significant change in the political or macro-economic environment of such countries or regions may generate additional expenses or reduce profits earned by Groupe BPCE.
A major economic disruption, such as the 2008 financial crisis, the 2011 sovereign debt crisis in Europe or the development of a new epidemic like the coronavirus (the magnitude and length of which are still unknown), may have a material adverse impact on all Groupe BPCE activities, particularly if the disruption encompasses a lack of liquidity on the market, making it difficult for Groupe BPCE to obtain funding. In particular, some risks do not occur in the normal economic cycle because they are externally generated. Examples include the very short-term consequences of Brexit, the increase in credit risk associated with corporate debt around the world (leveraged loans market) and the threat of the Covid-19 epidemic growing even worse, or the longer term impacts of climate change. During the financial crisis of 2008 and 2011, the financial markets were subject to strong volatility in response to various events, including but not limited to the decline in oil and commodity prices, the slowdown in emerging economies and turbulence on the equity markets, which directly or indirectly impacted several Groupe BPCE businesses (primarily securities transactions and financial services).
More recently, the armed conflict triggered by the Russian Federation following its invasion of Ukraine, which led the international community to impose sanctions against the Russian Federation, constitutes a significant change that could directly or indirectly penalize the economic activity of the counterparties financed by Groupe BPCE, resulting in additional expenses or reducing the profits earned by Groupe BPCE. For information, Groupe BPCE’s direct on- and off-balance sheet exposures, net of guarantees, to Russian and Ukrainian customers as of February 28, 2022 amounted to €788 million and €63 million respectively (management data). These exposures are very limited in view of Groupe BPCE’s €889 billion in gross outstanding loans and advances at amortized cost at December 31, 2021 (customers and banks).
For more detailed information, see Sections 4.2.1 “Economic and financial environment” and 4.7 “Outlook for Groupe BPCE” of the 2021 Universal Registration Document.
Groupe BPCE may encounter difficulties in adapting, implementing and incorporating its policy governing acquisitions or joint ventures.
Although acquisitions are not a major part of Groupe BPCE’s current strategy, the Group may nonetheless consider acquisition or partnership opportunities in the future. Although Groupe BPCE carries out an in-depth analysis of any potential acquisitions or joint ventures, in general it is impossible to carry out an exhaustive appraisal in every respect. As a result, Groupe BPCE may have to manage initially unforeseen liabilities. Similarly, the results of the acquired company or joint venture may prove disappointing and the expected synergies may not be realized in whole or in part, or the transaction may give rise to higher-than-expected costs. Groupe BPCE may also encounter difficulties with the consolidation of new entities. The failure of an announced acquisition or failure to consolidate a new entity or joint venture may place a strain on Groupe BPCE’s profitability. This situation may also lead to the departure of key personnel. In the event that Groupe BPCE is obliged to offer financial incentives to its employees in order to retain them, this situation may also lead to an increase in costs and a decline in profitability. Joint ventures expose Groupe BPCE to additional risks and uncertainties in that it may depend on systems, controls and persons that are outside its control and may, in this respect, see its liability incurred, suffer losses or incur damage to its reputation. Moreover, conflicts or disagreements between Groupe BPCE and its joint venture partners may have a negative impact on the targeted benefits of the joint venture. At December 31, 2021, total investments accounted for using equity method amounted to €1.6 billion, including following the sale of BPCE’s entire stake in CNP Assurances(1). For further information, please refer to Note 12.4 “Partnerships and associates” to the consolidated financial statements of Groupe BPCE, included in the 2021 Universal Registration Document.
Intense competition in France, Groupe BPCE’s main market, or internationally, may cause its net income and profitability to decline.
Groupe BPCE’s main business lines operate in a very competitive environment both in France and other parts of the world where it is does substantial business. This competition is heightened by consolidation, either through mergers and acquisitions or cooperation and arrangements. Consolidation has created a certain number of companies which, like Groupe BPCE, can offer a wide range of products and services ranging from insurance, loans and deposits to brokerage, investment banking and asset management. Groupe BPCE is in competition with other entities based on a number of factors, including the execution of transactions, products and services offered, innovation, reputation and price. If Groupe BPCE is unable to maintain its competitiveness in France or in its other major markets by offering a range of attractive and profitable products and services, it may lose market share in certain key business lines or incur losses in some or all of its activities.
For example, at December 31, 2021, in France, Groupe BPCE is the number one bank for SMEs(2), and the second-ranked bank for individual and professional customers(3). It has a 25.9% market share in home loans(4). In Retail Banking and Insurance, loan outstandings totaled €650 billion and deposits and savings(5) €861 billion (for more information on the contribution of each business line, and each network, see Section 1.4 “Groupe BPCE’s business lines” of the 2021 Universal Registration Document). Moreover, a slowdown in the global economy or the economic environment of Groupe BPCE’s main markets is likely to increase competitive pressure, in particular through greater pricing pressure and a slowdown in business volume for Groupe BPCE and its competitors. New, more competitive rivals subject to separate or more flexible regulation or other prudential ratio requirements could also enter the market. These new market participants would thus be able to offer more competitive products and services. Advances in technology and the growth of e-commerce have made it possible for institutions other than custodians to offer products and services that were traditionally considered as banking products, and for financial institutions and other companies to provide electronic and internet-based financial solutions, including electronic securities trading. These new entrants may put downward pressure on the price of Groupe BPCE’s products and services or affect Groupe BPCE’s market share. Advances in technology could lead to rapid and unexpected changes on Groupe BPCE’s markets of operation. Groupe BPCE’s competitive position, net earnings and profitability may be adversely affected should it prove unable to adequately adapt its activities or strategy in response to such changes.
Groupe BPCE’s ability to attract and retain skilled employees is paramount to the success of its business and failing to do so may affect its performance.
The employees of Groupe BPCE entities are the Group’s most valuable resource. Competition to attract qualified employees is fierce in many areas of the financial services sector. Groupe BPCE’s earnings and performance depend on its ability to attract new employees and retain and motivate existing employees. Changes in the economic environment (in particular tax and other measures aimed at limiting the pay of banking sector employees) may compel Groupe BPCE to transfer its employees from one unit to another, or reduce the workforce in certain business lines, which may cause temporary disruptions due to the time required for employees to adapt to their new duties, and may limit Groupe BPCE’s ability to benefit from improvements in the economic environment. This may prevent Groupe BPCE from taking advantage of potential opportunities in terms of sales or efficiency, which could in turn affect its performance.
At December 31, 2021, Groupe BPCE’s registered headcount totaled 99,900 employees. 6,688 permanent employees were recruited during the year (for further information, please refer to Section 2.4 “Designing the work of the future” of the 2021 Universal Registration Document).
(1)
On December 16, 2021, BPCE sold its entire stake in CNP Assurances, i.e. 16.11%, to Banque Postale.
(3)
Retail market share: 22% in household savings and 25.9% in mortgage loans to households (Banque de France Q3-2021). Overall penetration rate of 29.6% (rank 2) among retail customers (SOFIA Kantar study, March 2020). For professionals: 39.9% (rank 2) penetration rate among professionals and individual entrepreneurs (Pépites CSA 2019-2020 survey).
-
Credit and counterparty risks
Groupe BPCE is exposed to credit and counterparty risks that could have a material adverse effect on the Group’s business, financial position and income.
Groupe BPCE is significantly exposed to credit and counterparty risk through its financing or market activities. The Group could thus incur losses in the event of default by one or more counterparties, in particular if the Group encounters legal or other difficulties in exercising its collateral or if the value of the collateral does not allow it to fully cover the exposure in the event of a default. Despite the due diligence carried out by the Group, aimed at limiting the effects of having a concentrated credit portfolio, counterparty defaults may be amplified within a specific economic sector or world region by the effects of interdependence between these counterparties. Default by one or more major counterparties could thus have a material adverse effect on the Group’s cost of risk, income and financial position.
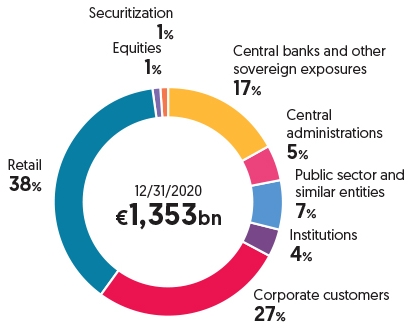
For information, on December 31, 2021, Groupe BPCE’s gross exposure to credit risk amounted to €1,435 billion, with the following breakdown for the main types of counterparty: 38% for retail customers, 27% for corporates, 19% for central banks and other sovereign exposures, and 6% for the public sector and similar entities. Credit risk-weighted assets amounted to €384 billion (including counterparty risk).
The main economic sectors to which the Group is exposed in its Non-Financial Corporations portfolio are Real Estate (36% of gross exposures at December 31, 2021), Finance/Insurance (11%), Wholesale and Retail Trade (11%) and Manufacturing industry (7%).
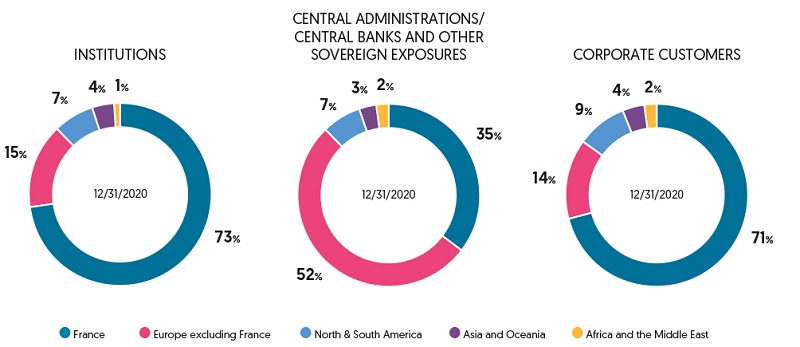
Groupe BPCE develops its activities mainly in France. The Group’s gross exposure (gross carrying amount) to France is €990 billion, representing 84% of the total gross exposure. The remaining exposures are mainly concentrated in the United States 4%, with other countries accounting for 12% of total gross exposures.
For further information, please see Chapters 5 “Credit risk” and 6 “Counterparty risk” in this document.
A substantial increase in impairments or provisions for expected credit losses recognized in respect of Groupe BPCE’s portfolio of loans and advances could have a material adverse effect on its income and financial position.
In the course of its lending activities, Groupe BPCE regularly recognizes charges for asset impairments in order to reflect, if necessary, actual or potential losses on its portfolio of loans and advances. Such impairments are booked in the income statement under “Cost of risk.” Groupe BPCE’s total charges for asset impairments are based on the Group’s measurement of past losses on loans, volumes and types of loans granted, industry standards, loans in arrears, economic conditions and other factors associated with the recoverability of various types of loans. While Groupe BPCE makes every effort to set aside a sufficient level of provisions for asset impairment expenses, its lending activities may cause it in the future to have to increase its expenses for losses on loans, due to a rise in non-performing loans or for other reasons such as the deterioration of market conditions or factors affecting certain countries. Any substantial increase in charges for losses on loans, material change in Groupe BPCE’s estimate of the risk of loss associated with its portfolio of loans, or any loss on loans exceeding past impairment expenses, could have an adverse impact on Groupe BPCE’s results and financial position.
Note: Groupe BPCE’s cost of risk amounts to €1,783 million in 2021 compared to €2,998 million in 2020, with credit risks accounting for 88% of Groupe BPCE’s risk-weighted assets. On the basis of gross exposures, 38% relate to retail customers and 27% to corporate customers (of which 69% of exposures are located in France).
Consequently, the risk associated with a significant increase in impairment expenses on assets booked to Groupe BPCE’s loans and advances portfolio is significant for Groupe BPCE in terms of impact and probability, and is therefore monitored carefully and proactively.
A decline in the financial strength and performance of other financial institutions and market players may have an unfavorable impact on Groupe BPCE.
Groupe BPCE’s ability to execute transactions may be affected by a decline in the financial strength of other financial institutions and market players. Institutions are closely interconnected owing to their trading, clearing, counterparty and financing operations. A default by a sector player, or even mere rumors or concerns regarding one or more financial institutions or the financial industry in general, may lead to a general contraction in market liquidity and subsequently to losses or further defaults in the future. Groupe BPCE is directly or indirectly exposed to various financial counterparties, such as investment service providers, commercial or investment banks, clearing houses and CCPs, mutual funds, hedge funds, and other institutional clients, with which it regularly conducts transactions. The default or failure of any such counterparties may have an adverse impact on Groupe BPCE’s financial position. Moreover, Groupe BPCE may be exposed to the risk associated with the growing involvement of operators subject to little or no regulation in its business sector and to the emergence of new products subject to little or no regulation (including in particular crowdfunding and trading platforms). This risk would be exacerbated if the assets held as collateral by Groupe BPCE could not be sold or if their selling price would not cover all of Groupe BPCE’s exposure to defaulted loans or derivatives, or in the event of fraud, embezzlement or other misappropriation of funds committed by financial sector participants in general to which Groupe BPCE is exposed, or if a key market operator such as a CCP defaults.
-
Financial risks
Groupe BPCE is dependent on its access to funding and other sources of liquidity, which may be limited for reasons outside its control, thus potentially having a material adverse impact on its results.
Access to short-term and long-term funding is critical for the conduct of Groupe BPCE’s business. Non-collateralized sources of funding for Groupe BPCE include deposits, issues of long-term debt and short/medium-term negotiable debt securities, banks loans and credit lines. Groupe BPCE also uses funding secured in particular by reverse repurchase agreements. If Groupe BPCE were unable to access the secured and/or unsecured debt market at conditions deemed acceptable, or incurred an unexpected outflow of cash or collateral, including a significant decline in customer deposits, its liquidity may be negatively affected. Furthermore, if Groupe BPCE were unable to maintain a satisfactory level of customer deposits (e.g. in the event its competitors offer higher rates of return on deposits), it may be forced to obtain funding at higher rates, which would reduce its net interest income and results.
Groupe BPCE’s liquidity, and therefore its results, may also be affected by unforeseen events outside its control, such as general market disruptions, operational hardships affecting third parties, negative opinions on financial services in general or on the short/long-term outlook for Groupe BPCE, changes in Groupe BPCE’s credit rating, or even the perception of the position of Groupe BPCE or other financial institutions among market operators.
Groupe BPCE’s access to the capital markets, and the cost of long-term unsecured funding, are directly related to changes in its credit spreads on the bond and credit derivatives markets, which it can neither predict nor control. Liquidity constraints may have a material adverse impact on Groupe BPCE’s financial position, results and ability to meet its obligations to its counterparties.
Groupe BPCE’s liquidity reserves include cash placed with central banks and securities and receivables eligible for central bank funding. Groupe BPCE’s liquidity reserve amounted to €329 billion on December 31, 2021, covering 247% short-term funding and short-term maturities of MLT debt. The one-month LCR (Liquidity Coverage Ratio) averaged 161% over 12 months on December 31, 2021 versus 156% on December 31, 2020. Any restriction on Groupe BPCE’s access to funding and other sources of liquidity could have a material adverse impact on its results. Given the significance these risks hold for Groupe BPCE in terms of impact and probability, they are carefully and proactively monitored.
Significant changes in interest rates may have a material adverse impact on Groupe BPCE’s net banking income and profitability.
Net interest income earned by Groupe BPCE during a given period has a material influence on net banking income and profitability for the period. In addition, material changes in credit spreads may influence Groupe BPCE’s earnings. Interest rates are highly sensitive to various factors that may be outside the control of Groupe BPCE. In the last decade, interest rates have tended to be low but may increase, and Groupe BPCE may not be able to immediately pass on the impacts of this change. Changes in market interest rates may have an impact on the interest rate applied to interest-bearing assets, different from those of interest rates paid on interest-bearing liabilities. Any adverse change in the yield curve may reduce net interest income from associated lending and funding activities and thus have a material adverse impact on Groupe BPCE’s net banking income and profitability.
Any period of inflation could affect Groupe BPCE’s revenues if it resulted in an increase in regulated savings rates without impacting the cost of credit, thus affecting the net interest margin and income. The sensitivity of the net present value of Groupe BPCE’s balance sheet to a +/-200 bps variation in interest rates remains below the 15% Tier 1 limit. At December 31, 2021, Groupe BPCE’s sensitivity to interest rate increases stood at -11.37% compared to Tier 1 versus -6.21% at December 31, 2020. The measurement of the change in Groupe BPCE’s projected net interest margin over one year according to four scenarios (“rising rates”, “falling rates”, “steepening of the curve”, “flattening of the curve”) in relation to the central scenario, indicates that “falling rates” (shock of -25bp) is the most unfavorable scenario, with a negative impact, as of September 30, 2021, of -0.88% (€82 million) over a sliding year.
Market fluctuations and volatility expose Groupe BPCE (in particular Natixis) to losses in its trading and investment activities, which may adversely impact Group’s BPCE’s results and financial position.
In the course of its third-party trading or investment activities, Groupe BPCE may carry positions in the bond, currency, commodity and equity markets, and in unlisted securities, real estate assets and other asset classes. These positions may be affected by volatility on the markets (especially the financial markets), i.e. the degree of price fluctuations over a given period on a given market, regardless of the levels on the market in question. Certain market configurations and fluctuations may also generate losses on a broad range of trading and hedging products used, including swaps, futures, options and structured products, which could adversely impact Groupe BPCE’s results and financial position. Similarly, extended market declines and/or major crises may reduce the liquidity of certain asset classes, making it difficult to sell certain assets and in turn generating material losses.
Market risk-weighted assets totaled €15.1 billion, i.e. around 3% of Groupe BPCE’s total risk-weighted assets, on December 31, 2021. For information, the weight of Corporate & Investment Banking activities in the Group’s net banking income was 14% for the year 2021. For more detailed information and examples, see Note 10.1.2 (“Analysis of financial assets and liabilities classified in Level 3 of the fair value hierarchy”) to the consolidated financial statements of Groupe BPCE, included in the 2021 Universal Registration Document.
Changes in the fair value of Groupe BPCE’s portfolios of securities and derivative products, and its own debt, are liable to have an adverse impact on the net carrying amount of these assets and liabilities, and as a result on Groupe BPCE’s net income and equity.
The net carrying amount of Groupe BPCE’s securities, derivative products and other types of assets at fair value, and of its own debt, is adjusted (at balance sheet level) at the date of each new financial statement. These adjustments are predominantly based on changes in the fair value of assets and liabilities during an accounting period, i.e. changes taken to profit or loss or recognized directly in other comprehensive income. Changes recorded in the income statement, but not offset by corresponding changes in the fair value of other assets, have an impact on net banking income and thus on net income. All fair value adjustments have an impact on equity and thus on Groupe BPCE’s capital adequacy ratios. Such adjustments are also liable to have an adverse impact on the net carrying amount of Groupe BPCE’s assets and liabilities, and thus on its net income and equity. The fact that fair value adjustments are recorded over an accounting period does not mean that additional adjustments will not be necessary in subsequent periods.
On December 31, 2021, financial assets at fair value totaled €199 billion (with approximately €187 billion in financial assets at fair value held for trading purposes) and financial liabilities at fair value totaled €192 billion (with €162 billion in financial liabilities at fair value held for trading purposes). For more detailed information, see also Note 4.3 (“Net gains or losses on financial instruments at fair value through profit or loss”), Note 4.4 (“Net gains or losses on financial instruments at fair value through other comprehensive income”), Note 5.1 (“Financial assets and liabilities at fair value through profit or loss”) and Note 5.2 (“Financial assets at fair value through other comprehensive income”) to the consolidated financial statements of Groupe BPCE in the 2021 Universal Registration Document.
Groupe BPCE’s revenues from brokerage and other activities associated with fee and commission income may decrease in the event of market downturns.
A market downturn is liable to lower the volume of transactions (particularly financial services and securities transactions) executed by Groupe BPCE entities for their customers and as a market maker, thus reducing net banking income from these activities. In particular, in the event of a decline in market conditions, Groupe BPCE may record a lower volume of customer transactions and a drop in the corresponding fees, thus reducing revenues earned from this activity. Furthermore, as management fees invoiced by Groupe BPCE entities to their customers are generally based on the value or performance of portfolios, any decline in the markets causing the value of these portfolios to decrease or generating an increase in the amount of redemptions would reduce the revenues earned by these entities through the distribution of mutual funds or other investment products (for the Caisses d’Epargne and the Banques Populaires) or through Asset Management activities (for Natixis).
Even where there is no market decline, if funds managed for third parties throughout Groupe BPCE and other Groupe BPCE products underperform the market, redemptions may increase and/or inflows decrease as a result, with a potential corresponding impact on revenues from the Asset Management business.
In 2021, the total net amount of fees and commissions received was €10,323 million, representing 40% of Groupe BPCE’s net banking income. Revenues earned from fees and commissions for financial services came to €582 million and revenues earned from fees and commissions for securities transactions amounted to €258 million. For more detailed information on the amounts of fees and commissions received by Groupe BPCE, see Note 4.2 (“Fee and commission income and expenses”) to the consolidated financial statements of Groupe BPCE in the 2021 Universal Registration Document.
Downgraded credit ratings could have an adverse impact on BPCE’s funding cost, profitability and business continuity.
Groupe BPCE’s long-term ratings on December 31, 2021 were A+ for Fitch Ratings, A1 for Moody’s, A+ for R&I and A+ for Standard & Poor’s. The decision to downgrade these credit ratings may have a negative impact on the funding of BPCE and its affiliates active in the financial markets (including Natixis). A ratings downgrade may affect Groupe BPCE’s liquidity and competitive position, increase funding costs, limit access to financial markets and trigger obligations under some bilateral contracts governing trading, derivative and collateralized funding transactions, thus adversely impacting its profitability and business continuity.
Furthermore, BPCE and Natixis’ unsecured long-term funding cost is directly linked to their respective credit spreads (the yield spread over and above the yield on government issues with the same maturity that is paid to bond investors), which in turn are heavily dependent on their ratings. An increase in credit spreads may materially raise BPCE and Natixis’ funding cost. Shifts in credit spreads are correlated to the market and sometimes subject to unforeseen and highly volatile changes. Credit spreads are also influenced by market perception of issuer solvency and are associated with changes in the purchase price of Credit Default Swaps backed by certain BPCE or Natixis debt securities. Accordingly, a change in perception of an issuer solvency due to a rating downgrade could have an adverse impact on that issuer’s profitability and business continuity.
-
Insurance risks
Groupe BPCE generates 12.9% of its net banking income from its insurance businesses. Net banking income from life and non-life insurance activities amounted to €2,860 million for the year 2021, compared to €2,550 million for 2020.
A deterioration in market conditions, and in particular excessive interest rate increases or decreases, could have a material adverse impact on the personal insurance business and income of the Group.
The main risk to which Groupe BPCE insurance subsidiaries are exposed in their personal insurance business is market risk. Exposure to market risk is mainly related to the capital guarantee as applicable to euro-denominated savings products.
Among market risks, interest rate risk is structurally significant for Natixis Assurances, as its general funds consist primarily of bonds. Interest rate fluctuations may:
•in the case of higher rates: reduce the competitiveness of the euro-denominated offer (by making new investments more attractive) and trigger waves of redemptions and major arbitrages on unfavorable terms with unrealized capital losses on outstanding bonds;
•in the case of lower rates: in the long term, make the return on general funds too low to enable them to honor their capital guarantees.
As a result of the allocation of general funds, the widening of spreads and the decline in the equity markets could also have a significant unfavorable impact on the results of Groupe BPCE’s life and health insurance business, through the recording of provisions for impairment due to the decline in the valuation of investments at fair value through profit or loss.
A mismatch between the loss experience expected by the insurer and the amounts actually paid by the Group to policyholders could have a significant adverse impact on its non-life insurance business and on the personal protection insurance portion of its insurance business, as well as its results and its financial position.
The main risk to which Groupe BPCE’s insurance subsidiaries are exposed in connection with these latter activities is underwriting risk. This risk results from a mismatch between i) claims actually recorded and benefits actually paid as compensation for these claims and ii) the assumptions used by the subsidiaries to set the prices for their insurance products and to establish technical reserves for potential compensation.
The Group uses both its own experience and industry data to develop estimates of future policy benefits, including information used in pricing insurance products and establishing the related actuarial liabilities. However, actual experience may not match these estimates, and unforeseen risks such as pandemics or natural disasters could result in higher-than-expected payments to policyholders. In this respect, changes in climate phenomena (known as “physical” climate risks) are subject to particular vigilance.
In the event that the amounts actually paid by the Group to policyholders are greater than the underlying assumptions initially used to establish provisions, or if events or trends lead the Group to modify the underlying assumptions, the Group may be exposed to more significant liabilities than expected, which could have a negative impact on the non-life insurance business for the personal protection portion, as well as on the results and financial position of the Group.
In the continuing context of the Covid-19 pandemic, fiscal year 2021 was marked by very dynamic commercial activity in both business lines.
Commercial activity for 2021 shows significant growth compared to 2020. At €14.6 billion, revenues at the end of 2021 were up by 32% compared to the end of 2020. This growth was observed in all insurance activities, and was mainly driven by savings (+39%), which benefited from strong momentum in contrast to the very low inflows in the first half of 2020 linked to the first lockdown. As a result, collection is higher than before the health crisis: +11% compared to 2019.
The 2021 result benefited in particular from the 12% increase in outstandings in the savings business, as well as the good performance of the personal protection and borrower insurance activities. It also benefited from a favorable base effect, as fiscal year 2020 was marked by the economic consequences of the health crisis and in particular the decline in the equity markets.
•in non-life insurance: the loss ratio is at higher levels than in 2020, a year marked by several lockdowns that led to a drop in automotive claims. The deterioration in multi-risk home insurance claims is mainly explained by the recording of serious claims and by climatic events;
•in personal insurance: the loss ratio in personal protection and in borrower insurance improved in 2021, due to reversals of provisions.
In addition, the SCR (Solvency Capital Requirement) is covered at December 31, 2021, thanks in particular to a favorable economic and financial environment. The various actions taken over the last few years, particularly in terms of financial coverage, reinsurance, business diversification and management of investments, have also contributed to the solidity and resilience of the solvency of Natixis Assurances. It should be noted that the deterioration of the economic and financial environment, in particular the decline in the equity markets and the level of interest rates, could adversely affect the solvency of Natixis Assurances, by adversely affecting future margins.
-
Non-financial risks
In the event of non-compliance with applicable laws and regulations, Groupe BPCE could be exposed to significant fines and other administrative and criminal penalties that could have a material adverse effect on its financial position, activities and reputation.
The risk of non-compliance is defined as the risk of sanction – judicial, administrative or disciplinary – but also of financial loss or damage to reputation, resulting from non-compliance with laws and regulations, professional standards and practices, and ethical standards specific to banking and Insurance activities, whether national or international.
The banking and Insurance sectors are subject to increased regulatory oversight, both in France and internationally. Recent years have seen a particularly substantial increase in the volume of new regulations that have introduced significant changes affecting both the financial markets and the relationships between investment service providers and customers or investors (e.g. MIFID II, PRIIPS, the directive on the Insurance Distribution, Market Abuse Regulation, Fourth Anti-Money Laundering and Terrorism Financing directive, Personal Data Protection Regulation, Benchmark Index Regulation, etc.). These new regulations have major impacts on the company’s operational processes.
The realization of the risk of non-compliance could result, for example, in the use of inappropriate means to promote and market the bank’s products and services, inadequate management of potential conflicts of interest, the disclosure of confidential information, or privileged, failure to comply with due diligence on entering into relations with suppliers and customers, particularly in terms of financial security (in particular the fight against money laundering and the financing of terrorism, compliance with embargoes, the fight against fraud or corruption).
Within BPCE, the Compliance function is responsible for overseeing the system for preventing and managing non-compliance risks. Despite this system, Groupe BPCE remains exposed to the risk of fines or other significant sanctions from the regulatory and supervisory authorities, as well as civil or criminal legal proceedings that could have a significant adverse impact on its financial position, activities and reputation.
Any interruption or failure of the information systems belonging to Groupe BPCE or third parties may generate losses (including commercial losses) and may have a material adverse impact on Groupe BPCE’s results.
As is the case for the majority of its competitors, Groupe BPCE is highly dependent on information and communication systems, as a large number of increasingly complex transactions are processed in the course of its activities. Any failure, interruption or malfunction in these systems may cause errors or interruptions in the systems used to manage customer accounts, general ledgers, deposits, transactions and/or to process loans. For example, if Groupe BPCE’s information systems were to malfunction, even for a short period, the affected entities would be unable to meet their customers’ needs in time and could thus lose transaction opportunities. Similarly, a temporary failure in Groupe BPCE’s information systems despite back-up systems and contingency plans could also generate substantial information recovery and verification costs, or even a decline in its proprietary activities if, for example, such a failure were to occur during the implementation of a hedging transaction. The inability of Groupe BPCE’s systems to adapt to an increasing volume of transactions may also limit its ability to develop its activities and generate losses, particularly losses in sales, and may therefore have a material adverse impact on Groupe BPCE’s results.
Groupe BPCE is also exposed to the risk of malfunction or operational failure by one of its clearing agents, foreign exchange markets, clearing houses, custodians or other financial intermediaries or external service providers that it uses to carry out or facilitate its securities transactions. As interconnectivity with its customers continues to grow, Groupe BPCE may also become increasingly exposed to the risk of the operational malfunction of customer information systems. Groupe BPCE’s communication and information systems, and those of its customers, service providers and counterparties, may also be subject to failures or interruptions resulting from cybercriminal or cyberterrorist acts. For example, as a result of its digital transformation, Groupe BPCE’s information systems are becoming increasingly open to the outside (cloud computing, big data, etc.). Many of its processes are gradually going digital. Use of the Internet and connected devices (tablets, smartphones, apps used on tablets and mobiles, etc.) by employees and customers is on the rise, increasing the number of channels serving as potential vectors for attacks and disruptions, and the number of devices and applications vulnerable to attacks and disruptions. Consequently, the software and hardware used by Groupe BPCE’s employees and external agents are constantly and increasingly subject to cyberthreats. As a result of any such attacks, Groupe BPCE may face malfunctions or interruptions in its own systems or in third-party systems that may not be adequately resolved. Any interruption or failure of the information systems belonging to Groupe BPCE or third parties may generate losses (including commercial losses) due to the disruption of its operations and the possibility that its customers may turn to other financial institutions during and/or after any such interruptions or failures.
The risk associated with any interruption or failure of the information systems belonging to Groupe BPCE or third parties is significant for Groupe BPCE in terms of impact and probability, and is therefore carefully and proactively monitored.
Reputational and legal risks could unfavorably impact Groupe BPCE’s profitability and business outlook.
Groupe BPCE’s reputation is of paramount importance when it comes to attracting and retaining customers. Use of inappropriate means to promote and market Group products and services, inadequate management of potential conflicts of interest, legal and regulatory requirements, ethical issues, money laundering laws, economic sanctions, data policies and sales and trading practices could adversely affect Groupe BPCE’s reputation. Its reputation could also be harmed by inappropriate employee behavior, cybercrime or cyber terrorist attacks on Groupe BPCE’s information and communication systems, or any fraud, embezzlement or other misappropriation of funds committed by financial sector participants to which Groupe BPCE is exposed, or any legal ruling or regulatory action with a potentially unfavorable outcome. Any such harm to Groupe BPCE’s reputation may have a negative impact on its profitability and business outlook.
Ineffective management of reputational risk could also increase Groupe BPCE’s legal risk, the number of legal disputes in which it is involved and the amount of damages claimed, or may expose the Group to regulatory sanctions. For more information, see Chapter 10 “Legal risks” of this document. The financial consequences of these disputes may have an impact on the financial position of the Group, in which case they may also adversely impact Groupe BPCE’s profitability and business outlook.
Unforeseen events, such as a serious natural disaster, events related to climate risk (physical risk directly associated with climate change), pandemics, attacks or any other emergency situation can cause an abrupt interruption in the operations of Groupe BPCE entities, affecting in particular the Group’s core business lines (liquidity, payment instruments, securities services, loans to individual and corporate customers, and fiduciary services) and trigger material losses, if the Group is not covered or not sufficiently covered by an insurance policy. These losses could relate to material assets, financial assets, market positions or key personnel, and have a direct and potentially material impact on Groupe BPCE’s net income. Moreover, such events may also disrupt Groupe BPCE’s infrastructure, or that of a third party with which Groupe BPCE does business, and generate additional costs (relating in particular to the cost of re-housing the affected personnel) and increase Groupe BPCE’s costs (such as insurance premiums). Such events may invalidate insurance coverage of certain risks and thus increase Groupe BPCE’s overall level of risk.
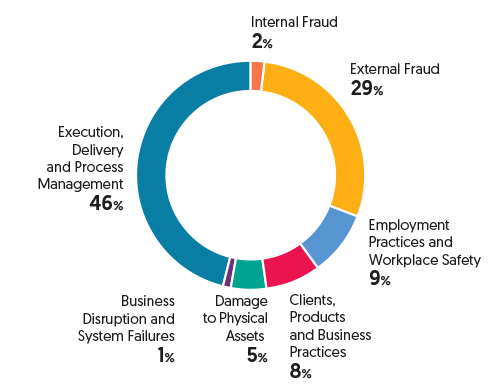
On December 31, 2021, operational risks accounted for 9% of Groupe BPCE’s risk-weighted assets, as on December 31, 2020. At December 31, 2021, Groupe BPCE’s losses in respect of operational risk can be primarily attributed to the “Corporate items” business line (38%). They are concentrated in the Basel category “execution, delivery and process management” for 46%.
The failure or inadequacy of Groupe BPCE’s risk management and hedging policies, procedures and strategies may expose it to unidentified or unexpected risks which may trigger unforeseen losses.
Groupe BPCE’s risk management and hedging policies, procedures and strategies may not succeed in effectively limiting its exposure to all types of market environments or all kinds of risks, and may even prove ineffective for some risks that the Group was unable to identify or anticipate. Furthermore, the risk management techniques and strategies employed by Groupe BPCE may not effectively limit its exposure to risk and do not guarantee that overall risk will actually be lowered. These techniques and strategies may prove ineffective against certain types of risk, in particular risks that Groupe BPCE had not already identified or anticipated, given that the tools used by Groupe BPCE to develop risk management procedures are based on assessments, analyses and assumptions that may prove inaccurate. Some of the indicators and qualitative tools used by Groupe BPCE to manage risk are based on the observation of past market performance. To measure risk exposures, the heads of risk management carry out a statistical analysis of these observations.
These tools or indicators may not be capable of predicting future exposure to risk. For example, these risk exposures may be due to factors that Groupe BPCE may not have anticipated or correctly assessed in its statistical models or due to unexpected or unprecedented shifts in the market. This would limit Groupe BPCE’s risk management capability. As a result, losses incurred by Groupe BPCE may be higher than those anticipated on the basis of past measurements. Moreover, the Group’s quantitative models cannot factor in all risks. While no significant problem has been identified to date, the risk management systems are subject to the risk of operational failure, including fraud. Some risks are subject to a more qualitative analysis, which may prove inadequate and thus expose Groupe BPCE to unexpected losses.
Actual results may vary compared to assumptions used to prepare Groupe BPCE’s financial statements, which may expose it to unexpected losses.
In accordance with current IFRS standards and interpretations, Groupe BPCE must base its financial statements on certain estimates, in particular accounting estimates relating to the determination of provisions for non-performing loans, provisions for potential claims and litigation, and the fair value of certain assets and liabilities. If the values used for the estimates by Groupe BPCE prove to be materially inaccurate, in particular in the event of major and/or unexpected market trends, or if the methods used to calculate these values are modified due to future changes in IFRS standards or interpretations, Groupe BPCE may be exposed to unexpected losses.
-
Regulatory risks
Groupe BPCE is subject to significant regulation in France and in several other countries around the world where it operates; regulatory measures and changes could have a material adverse impact on Groupe BPCE’s business and results.
The business and results of Group entities may be materially impacted by the policies and actions of various regulatory authorities in France, other governments of the European Union, the United States, foreign governments and international organizations. Such constraints may limit the ability of Groupe BPCE entities to expand their businesses or conduct certain activities. The nature and impact of future changes in such policies and regulatory measures are unpredictable and are beyond Groupe BPCE’s control. Moreover, the general political environment has evolved unfavorably for banks and the financial industry, resulting in additional pressure on the part of legislative and regulatory bodies to adopt more stringent regulatory measures, despite the fact that these measures may have adverse consequences on lending and other financial activities, and on the economy. Because of the continuing uncertainty surrounding the new legislative and regulatory measures, it is not possible to predict what impact they will have on Groupe BPCE; however, this impact may be highly adverse.
For example, legislation and regulations have recently been enacted or proposed with a view to introducing a number of changes, some permanent, in the global financial environment. While the objective of these new measures is to avoid a recurrence of the global financial crisis, the impact of the new measures could substantially change, and may continue to change, the environment in which Groupe BPCE and other financial institutions operate.
As a result of some of these measures, Groupe BPCE has reduced, and may further reduce, the size of certain activities in order to comply with the new requirements. These measures are also liable to increase the cost of compliance with new regulations. This could cause revenues and consolidated profit to decline in the relevant business lines, sales to decline in certain activities and asset portfolios, and asset impairment expenses.
The purpose of the 2019 adoption of the final versions of the Banking Package was to align prudential requirements for banks with Basel III standards. The implementation of these reforms may result in higher capital and liquidity requirements, which could impact Groupe BPCE funding costs.
On November 11, 2020, the Financial Stability Board (“FSB”), in consultation with the Basel Committee on Banking Supervision and national authorities, reported the 2020 list of global systemically important banks (“G-SIBs”). Groupe BCPE is classified as a G-SIB by the FSB. Groupe BPCE also appears on the list of global systematically important financial institutions (“G-SIFIs”).
These regulatory measures, which may apply to various Groupe BPCE entities, and any changes in such measures may have a material adverse impact on Groupe BPCE’s business and results.
Legislation and regulations have recently been enacted or proposed with a view to introducing a number of changes, some permanent, in the global financial environment. These new measures, aimed at avoiding a new global financial crisis, have significantly altered the operating environment of Groupe BPCE and other financial institutions, and may continue to alter this environment in the future. Groupe BPCE is exposed to the risk associated with changes in legislation and regulations. These include the new prudential backstop rules, which measure the difference between the actual provisioning levels of defaulted loans and guidelines including target rates, depending on the age of the default and the presence of guarantees.
In today’s evolving legislative and regulatory environment, it is impossible to foresee the impact of these new measures on Groupe BPCE. The development of programs aimed at complying with these new legislative and regulatory measures (and updates to existing programs), and changes to the Group’s information systems in response to or in preparation for new measures generates significant costs for the Group, and may continue to do so in the future. Despite its best efforts, Groupe BPCE may also be unable to fully comply with all applicable laws and regulations and may thus be subject to financial or administrative penalties. Furthermore, new legislative and regulatory measures may require the Group to adapt its operations and/or may affect its results and financial position. Lastly, new regulations may require Groupe BPCE to strengthen its capital or increase its total funding costs.
The risk associated with regulatory measures and subsequent changes to such measures is significant for Groupe BPCE in terms of impact and probability, and is therefore carefully and proactively monitored.
BPCE may have to help entities belonging to the financial solidarity mechanism in the event they experience financial difficulties, including entities in which BPCE holds no economic interest.
As the central institution of Groupe BPCE, BPCE is responsible for ensuring the liquidity and solvency of each regional bank (Banques Populaires and Caisses d’Epargne) and the other members of the group of affiliates which are credit institutions subject to French regulations. The group of affiliates includes BPCE subsidiaries, such as Natixis, Crédit Foncier de France and Banque Palatine. For Groupe BPCE, all entities affiliated with the central institution of Groupe BPCE benefit from a guarantee and solidarity mechanism, the aim of which, in accordance with Articles L. 511-31 and L. 512-107-6 of the French Monetary and Financial Code, is to ensure the liquidity and solvency of all affiliated entities and to organize financial solidarity throughout the Group.
This financial solidarity is based on legislative provisions establishing a legal principle of solidarity obliging the central institution to restore the liquidity or solvency of affiliates in difficulty, and/or of all the affiliates of the Group, by mobilizing, if necessary, all of the affiliates’ liquid assets and equity.
The three guarantee funds created to cover Groupe BPCE’s liquidity and insolvency risks are described in Note 1.2 “Guarantee mechanism” to the consolidated financial statements of Groupe BPCE included in the 2021 Universal Registration Document. On December 31, 2021, the Banque Populaire and Caisse d’Epargne funds each contained €450 million. The Mutual Guarantee Fund holds €172 million in deposits per network. The regional banks are obligated to make additional contributions to the guarantee fund on their future profits. While the guarantee fund represents a substantial source of resources to fund the solidarity mechanism, there is no guarantee these revenues will be sufficient. If the guarantee funds prove insufficient, BPCE, by virtue of its role as central institution, will be obliged to make up the shortfall by mobilizing its own resources and, if necessary, all of the affiliates’ liquid assets and capital.
As a result of this obligation, if a member of the Group were to encounter major financial difficulties, the event underlying these financial difficulties could have a negative impact on the financial position of BPCE and that of the other affiliates thus called upon to provide support under the principle of financial solidarity.
Investors in BPCE’s securities could suffer losses if BPCE and all of its affiliates were to be subject to liquidation or resolution procedures.
The EU regulation on the Single Resolution Mechanism No. 806/214 and the EU directive for the recovery and resolution of banks No. 2014/59, as amended by the EU directive No. 2019/879 (the “BRRD”), as transposed into French law in Book VI of the French Monetary and Financial Code, give the resolution authorities the power to impair BPCE securities or, in the case of debt securities, to convert them to equity.
Resolution authorities may write down or convert capital instruments, such as BPCE’s Tier 2 subordinated debt securities, if the issuing institution or the group to which it belongs is failing or likely to fail (and there is no reasonable prospect that another measure would avoid such failure within a reasonable time period), becomes non-viable, or requires extraordinary public support (subject to certain exceptions). They shall write down or convert capital instruments before opening a resolution proceeding, or if doing so is necessary to maintain the viability of an institution. Any write-down or conversion of capital instruments shall be effected in order of seniority, so that Common Equity Tier 1 instruments are to be written down first, then additional Tier 1 instruments are to be written down or converted to equity, followed by Tier 2 instruments. If the write-down or conversion of capital instruments is not sufficient to restore the financial health of the institution, the bail-in power held by the resolution authorities may be applied to write down or convert eligible liabilities, such as BPCE’s senior non-preferred and senior preferred securities.
On December 31, 2021, total Tier 1 capital amounted to €69.8 billion and Tier 2 prudential capital to €13.0 billion. Senior non-preferred debt instruments amounted to €25.2 billion at that date, of which €22.4 billion had a maturity of more than one year and were therefore eligible for TLAC and MREL at December 31, 2021.
As a result of the complete legal solidarity, and in the extreme case of a liquidation or resolution proceeding, one or more affiliates may not find itself subject to court-ordered liquidation, or be affected by resolution measures within the meaning of the “BRRD,” without all affiliates also being affected. In accordance with Article L. 613-29 of the French Monetary and Financial Code, court-ordered liquidation proceedings are therefore brought in a coordinated manner with regard to the central institution and all of its affiliates.
The same article provides that, in the event of court-ordered liquidation proceedings being brought against all affiliates, the external creditors (of the same rank or enjoying identical rights) of all affiliates would be treated equally according to the ranking of the creditors and regardless of whether they are attached to a particular affiliated entity. As a result, investors in AT1 instruments and other pari passu securities would be more affected than investors in Tier 2 instruments and other pari passu securities, which in turn would be more affected than investors in external senior non-preferred debt, which in turn would be more affected than investors in external senior preferred debt. In the event of resolution, and in accordance with article L. 613-55-5 of the French Monetary and Financial Code, identical depreciation and/or conversion rates would be applied to debts and receivables of the same rank, regardless of their attachment to a particular affiliated entity in the order of the hierarchy recalled above.
Due to the systemic nature of Groupe BPCE and the assessment currently made by the resolution authorities, resolution measures would be more likely to be taken than the opening of judicial liquidation proceedings. A resolution procedure may be initiated against BPCE and all affiliated entities if (i) the default of BPCE and all affiliated entities is proven or foreseeable, (ii) there is no reasonable expectation that another measure could prevent this failure within a reasonable timeframe and (iii) a resolution measure is required to achieve the objectives of the resolution: (a) guarantee the continuity of critical functions, (b) avoid material adverse impacts to financial stability, (c) protect State resources by minimizing the use of exceptional public financial support and (d) protect client funds and assets, particularly those of depositors. Failure of an institution means that it does not respect requirements for continuing authorization, it is unable to pay its debts or other liabilities when they fall due, it requires extraordinary public financial support (subject to limited exceptions), or the value of its liabilities exceeds the value of its assets.
In addition to the bail-in power, resolution authorities are provided with broad powers to implement other resolution measures with respect to failing institutions or, under certain circumstances, their groups, which may include (without limitation): the total or partial sale of the institution’s business to a third party or a bridge institution, the separation of assets, the replacement or substitution of the institution as obligor in respect of debt instruments, modifications to the terms of debt instruments (including altering the maturity and/or the amount of interest payable and/or imposing a temporary suspension on payments), discontinuing the listing and admission to trading of financial instruments, the dismissal of managers or the appointment of a temporary administrator (administrateur spécial) and the issuance of new equity or own funds.
The exercise of the powers described above by resolution authorities could result in the partial or total write-down or conversion to equity of the capital instruments and the debt instruments issued by BPCE, or may substantially affect the amount of resources available to BPCE to make payments on such instruments, potentially causing BPCE investors to incur losses.
Tax legislation and its application in France and in countries where Groupe BPCE operates are likely to have an adverse impact on Groupe BPCE’s profits.
As a multinational banking group that carries out large and complex international transactions, Groupe BPCE (particularly Natixis) is subject to tax legislation in a large number of countries throughout the world, and structures its activity in compliance with applicable tax rules. Changes in tax schemes by the competent authorities in these countries could materially impact Groupe BPCE’s profits. Groupe BPCE manages its activities with a view to creating value from the synergies and sales capabilities of its various constituent entities. It also works to structure financial products sold to its customers from a tax efficiency standpoint. The structure of intra-group transactions and financial products sold by entities of Groupe BPCE are based on its own interpretations of applicable tax regulations and laws, generally based on opinions given by independent tax experts, and, as needed, on decisions or specific interpretations by the competent tax authorities. It is possible that in the future tax authorities may challenge some of these interpretations, as a result of which the tax positions of Groupe BPCE entities may be disputed by the tax authorities, potentially resulting in tax re-assessments, which may in turn have an adverse impact on Groupe BPCE’s results.
-
3.1 Adequacy of risk management systems
The Group Risk and Compliance Committee, chaired by the Chairman of the Management Board, met five times in 2021 to review the adequacy of Groupe BPCE’s risk management systems, and validated the annual review of the Group’s risk policies. These systems cover all risks, as described in the Ministerial Order of November 3, 2014 on internal control as amended by the Order of February 25, 2021.
-
3.2 Risk appetite
All risks are covered by central and local risk management systems, in line with the Group’s risk appetite and strategy.
Groupe BPCE’s Supervisory Board unanimously approved the Group’s risk appetite framework: quantitative indicators, resilience threshold for each indicator and associated governance. During its annual review, the Supervisory Board examined the Group’s risk appetite in September 2021 and December 2020 and its deliberation was unanimously approved.
Risk appetite guidelines
As a decentralized and united cooperative group, Groupe BPCE structures its activity around share capital, held predominantly by the regional institutions, and centralized market funding, optimizing the resources allocated to the entities.
•through its cooperative nature, is firmly committed to generating recurring and resilient income for its cooperative shareholders and investors by offering the best service to its customers;
•must preserve the solvency, liquidity and reputation of each Group entity – a duty assumed by the central institution through the oversight of consolidated risks, a risk policy and shared tools;
•consists of regional banks, which own the Group and its subsidiaries. In addition to normal management operations, in the event of a crisis, solidarity mechanisms between Group entities ensure the circulation of capital and prevent the entities or the central institution from defaulting;
•focuses on the structural risks of its full-service banking model, with a predominant retail banking component in France, while incorporating other business lines necessary to provide quality service to all of its customers;
–international expansion (predominantly Corporate & Investment Banking and Asset Management, with a more targeted approach for retail banking customers).
Groupe BPCE’s risk appetite is defined as the level of risk it is willing to accept with the goal of increasing its profitability while maintaining solvency. This risk appetite must be aligned with the institution’s operating environment, strategy and business model, while making customer interests the top priority. In determining its risk appetite, Groupe BPCE aims to steer clear of any major pockets of concentration and to optimize capital allocation.
In terms of risk profile, Groupe BPCE incurs risks intrinsically associated with its retail banking and Corporate & Investment Banking activities. Changes to its business model are increasing exposure to some types of risks, particularly risks related to Asset Management and international businesses.
-
3.3 Risk management
Governance of risk management
Risk management is governed by two main bodies at Group level: the Supervisory Board, which is supported by the Board’s Risk Committee, and the Executive Management Committee, of which the Head of Risk Management is a member.
Chaired by the Chairman of the Management Board, the Group Risk and Compliance Committee, an umbrella committee, sets the broad outlines of the risk policy and examines issues related to non-financial risks (specifically those related to banking, insurance and investment service compliance, and to financial security), annually reviews the risk appetite system, and approves a prospective risk analysis twice a year.
-
3.4 Internal control
The Group control system relies on three levels of controls, in accordance with banking regulations and sound management practices (two levels of permanent controls and one level of periodic control), as well as the establishment of consolidated control processes in accordance with provisions approved by BPCE’s Management Board.
Permanent control system
The organization of permanent control in the Group is specified in the Internal Control Charter (updated on July 23, 2020) in paragraph 3 and in the DRCCP Charter (updated on December 9, 2021) in paragraphs 2 and 5 in accordance with the decree of November 3, 2014 (revised on February 25, 2021), in particular in article 12.
The permanent control system is based on the taxonomy of controls, which includes definitions of control methods.
The system comprises two types of level 1 controls (first line of defense LOD1) carried out by employees carrying out operational activities. These employees identify the risks associated with their activity and comply with the procedures and limits set:
•level 1.1 consists of production controls (detection of production anomalies, compliance with internal rules and procedures) usually carried out on an ongoing basis;
•level 1.2 consists of controls aimed at identifying risks/compliance with rules/procedures carried out by line managers (a line manager control implies a control distinct from the person who carried it out) or by a separate team dedicated to level 1 control. The formalization of procedures and operating modes describing the controlled operational activities are the responsibility of the first line of defense.
The system also includes two types of level 2 controls (second line of defense LOD2) performed by agents at the central and local levels:
•level 2.1 consists of controls aimed at verifying that the risks have been identified and managed by the first level of control in accordance with the rules and procedures provided for. They are carried out by employees of departments dedicated exclusively to risk management, compliance, security, permanent control or specialized functions that do not perform level 1 controls: These controls are formalized and assessed;
•level 2.2 concerns overall system controls or quality controls performed by each business line of an institution as the head of the group or of BPCE as the central institution. These controls are formalized and assessed.
In accordance with the Group’s Risk, Compliance and Permanent Control Charter, it is recommended that a permanent control coordination function be set up in each institution or Group head office covering the entire Risk/Compliance/Security area. In the absence of a dedicated department, these missions are the responsibility of the Head of Risk, Compliance and Permanent Control or the Chief Risk Officer and the Head of Compliance, it being understood that the designated Executive Officer remains responsible for the consistency and effectiveness of the control, within the meaning of the decree of November 3, 2014 as amended by the decree of February 25, 2021.
In the Corporate Secretary’s Office, the main role of the Group Coordination of Permanent Controls division is to coordinate the Group’s Level 1 and 2 permanent control system. In this context, it:
•proposes standards and methodological guides for the exercise of permanent control in Groupe BPCE;
•monitors the application of control standards, i.e. the framework document governing the Group’s permanent control system – operational adaptation of the Internal Control Charter – and the control sampling standard, which is based on random, representative samples. To that end, all annual control plans of retail banking institutions are centralized and analyzed each year;
•assists the business lines in the review of controls and to ensure their risk coverage is complete. The various permanent control standards are overseen and constantly updated and expanded in the tool;
The main changes to the permanent control system for 2021 concern:
•the continued automation of the annual control plans in the Group tool and the introduction of a module in Priscop to monitor the reliability of Level 1 controls by Level 2;
•the extension of the coverage of risk-control links, notably with the inclusion of controls in other Group tools (Drive, Norkom, Vigiclient);
•strengthening the body of permanent control standards, in particular by updating the Permanent Control Framework note, the Control Taxonomy standard, the Annual Control Plan standard, the Permanent Control Action Plans standard and the Control Documentation standard. Measures to support the business lines and manage change are also being implemented;
•the construction of a rating for the permanent control system at Groupe BPCE level in order to provide a summary and consolidated view of the results of the Group’s permanent controls in 2022.
-
3.5 Recovery Plan
The plan is in line with European regulatory measures on the recovery and resolution of banks and investment firms, and with the provisions of the French Monetary and Financial Code.
The objective of the Recovery Plan is to identify measures to restore the Group’s financial solidity in the event it deteriorates significantly.
The plan presents the options available to the Group to launch a crisis management system. It assesses the relevance of the different options in various crisis scenarios and the methods and resources available for their implementation.
•identification of options impacting the restoration of the Group’s financial position and their impacts on the Group’s business model;
The Recovery Plan is kept up to date and approved by the Supervisory Board, aided by its Risk Committee for these purposes.
-
4.1 Regulatory framework
Credit institutions’ capital is regularly monitored in accordance with regulations defined by the Basel Committee.
These regulations were reinforced following the introduction of Basel III, with an increase in the level of regulatory capital requirements and the introduction of new risk categories.
Basel III recommendations were incorporated in EU directive 2013/36/EU (Capital Requirements Directive – CRD IV) and regulation No. 575/2013 (Capital Requirements Regulation – CRR) of the European Parliament and of the Council amended by Regulation (EU) 2019/876 (the "CRR2"). As of January 1, 2014, all EU credit institutions are subject to compliance with the prudential requirements set out in these texts.
•as of January 1, 2016, the capital buffers which can be used to absorb losses in the event of tensions.
–a capital conservation buffer, comprised of Common Equity Tier 1, aimed at absorbing losses in times of serious economic stress,
–a countercyclical buffer, aimed at protecting the banking sector from periods of excess aggregate credit growth. This Common Equity Tier 1 surcharge is supposed to be adjusted over time in order to increase capital requirements during periods in which credit growth exceeds its normal trend and to relax them during slowdown phases,
–a systemic risk buffer for each Member State aimed at preventing and mitigating the systemic risks that are not covered by regulations (low for Groupe BPCE given its countries of operation),
–the different systemic risk buffers aimed at reducing the risk of failure of systemically important financial institutions. These buffers are specific to each bank. Groupe BPCE is on the list of other systemically important institutions (O-SIIs) and global systemically important banks (G-SIBs). As these buffers are not cumulative, the highest buffer applies.
•capital requirements for the prudential supervision of market risk and operational risk, multiplied by 12.5.
Through December 31, 2019, these ratios were subject to a phase-in calculation aimed at gradually transitioning from Basel 2.5 to Basel III.
In 2021, Groupe BPCE is required to observe a minimum Common Equity Tier 1 ratio of 4.5% under Pillar I, a minimum Tier 1 capital ratio of 6% and lastly, a minimum total capital ratio of 8%.
Alongside Pillar 1 minimum capital requirements, Groupe BPCE is subject to additional Tier 1 capital requirements:
•as of January 1, 2019, the Tier 1 capital conservation buffer is 2.5% of the total amount of risk exposures;
•Groupe BPCE’s countercyclical buffer equals the EAD-weighted average of the buffers defined for each of the Group’s countries of operation. Groupe BPCE’s maximum countercyclical buffer as from January 1, 2019 is 2.5%. With the majority of Groupe BPCE’s exposure being located in countries whose countercyclical buffer was set at zero, the Group considers that this rate will be very close to 0%;
•the systemic risk buffer is applied to all exposures located in the Member State setting this buffer and/or to sectoral exposures located in the same Member State. As most of Groupe BPCE’s exposures are located in countries whose systemic risk buffer has been set at 0%, the Group considers that this rate will be very close to 0%.
Hybrid debt instruments eligible for inclusion in own funds under Basel II are still subject to phase-in measures in 2021. This applies to instruments that are no longer eligible under the new regulation, which under certain conditions may be eligible for the grandfathering clause. In accordance with this clause, they are gradually excluded over an eight-year period, with a 10% decrease each year. As of January 1, 2021, 10% of the overall stock reported as of December 31, 2013 is still recognized, to be no longer recognized in 2022. The unrecognized share may be included in the lower equity tier if it meets the relevant criteria.
Credit institutions must comply with prudential requirements, which are based on three pillars that form an indivisible whole:
Pillar I
Pillar I sets minimum requirements for capital. It aims to ensure that banking institutions hold sufficient capital to provide a minimum level of coverage for their credit risk, market risk and operational risk. The bank can use standardized or advanced methods to calculate its capital requirement.
2020
2021
Minimum regulatory capital requirements
Common Equity Tier 1 (CET1)
4.5%
4.5%
Total Tier 1 capital (T1 = CET1 + AT1)
6.0%
6.0%
Regulatory capital (T1 + T2)
8.0%
8.0%
Additional requirements
Capital conservation
2.5%
2.5%
G-SIB buffer applicable to Groupe BPCE(1)
1.0%
1.0%
Maximum countercyclical buffer applicable to Groupe BPCE(2)
2.5%
2.5%
Maximum total capital requirements for Groupe BPCE
Common Equity Tier 1 (CET1)
10.5%
10.5%
Total Tier 1 capital (T1 = CET1 + AT1)
12.0%
12.0%
Regulatory capital (T1 + T2)
14.0%
14.0%
(1)G-SIB buffer: global systemic buffer.
(2)The countercyclical buffer requirement is calculated quarterly.
-
4.2 Scope of application
Regulatory scope
Groupe BPCE is required to submit consolidated regulatory reports to the European Central Bank (ECB), the supervisory authority for euro zone banks. Pillar III is therefore prepared on a consolidated basis.
The regulatory scope of consolidation is established based on the statutory scope of consolidation. The main difference between these two scopes lies in the consolidation method for insurance companies, which are accounted for by the equity method within the regulatory scope, regardless of the statutory consolidation method.
The following insurance companies are accounted for by the equity method within the regulatory scope of consolidation:
The following insurance companies are accounted for by the equity method within both the statutory and regulatory scopes of consolidation:
In addition, since the second quarter of 2020, the Versailles entity is consolidated using the equity method. This change, which concerns only the regulatory scope, since the entity is still considered to be under control within the meaning of IFRS, follows a detailed analysis of the regulatory texts. The latter stipulate that non-financial entities that do not constitute ancillary services within the meaning of the standard are accounted for using the equity method for the purposes of reporting ratios. This decision, approved by the Group’s bodies, allows for an alignment of the scopes used to calculate liquidity and solvency.
EU CC2 ‒ RECONCILIATION BETWEEN REGULATORY CAPITAL AND THE BALANCE SHEET IN THE AUDITED FINANCIAL STATEMENTS
The table below shows the transition from an accounting balance sheet to a regulatory balance sheet for Groupe BPCE at December 31, 2021.
The differences between the statutory and regulatory scopes of consolidation can be attributed to restatements for subsidiaries excluded from the regulatory scope of consolidation (see description of regulatory scope of consolidation below) and the reincorporation of intra-group transactions associated with these subsidiaries.
in millions of euros
12/31/2021
Balance sheet in the
published financial
statements
According to the
regulatory scope of
consolidation
References
At end of period
At end of period
ASSETS ‒ BREAKDOWN BY ASSET CLASSES ACCORDING TO THE BALANCE SHEET IN THE PUBLISHED FINANCIAL STATEMENTS
Cash and amounts due from central banks
186,317
186,460
Financial assets at fair value through profit or loss
198,919
198,707
•o/w debt instruments
30,451
30,181
•o/w equity instruments
47,617
47,617
•o/w loans (excluding repurchase agreements)
7,497
7,497
•o/w repurchase agreements
56,170
56,183
•o/w trading derivatives
43,712
43,756
•o/w security deposits paid
13,473
13,473
Hedging derivatives
7,163
7,163
Financial assets at fair value through other comprehensive income
48,598
48,753
Securities at amortized cost
24,986
24,982
Loans and advances due from banks at amortized cost
94,140
93,827
Loans and advances to customers at amortized cost
781,097
781,825
Revaluation differences on interest rate risk-hedged portfolios
5,394
5,394
Insurance business investments
135,228
669
Current tax assets
465
464
Deferred tax assets
3,524
3,541
1
Accrued income and other assets
13,830
13,764
Non-current assets held for sale
2,241
2,241
Investments accounted for using equity method
1,525
5,378
Investment property
758
758
Property, plant and equipment
6,396
6,361
Intangible assets
997
816
2
Goodwill
4,443
4,393
2
TOTAL ASSETS
1,516,021
1,385,495
LIABILITIES ‒ BREAKDOWN BY LIABILITY CLASSES ACCORDING TO THE BALANCE SHEET IN THE PUBLISHED FINANCIAL STATEMENTS
Central banks
6
6
Financial liabilities at fair value through profit or loss
191,768
189,303
3
•o/w securities sold short
25,974
25,974
•o/w other liabilities issued for trading purposes
86,424
86,424
•o/w trading derivatives
40,434
40,457
•o/w security deposits received
9,616
9,646
•o/w financial liabilities designated at fair value through profit or loss
29,320
26,802
Hedging derivatives
12,521
12,521
Debt securities
237,419
235,088
Amounts due to banks
155,391
152,020
Amounts due to customers
665,317
668,421
Revaluation differences on interest rate risk-hedged portfolios
184
184
Current tax liabilities
1,313
1,299
Deferred tax liabilities
1,049
838
1
Accrued expenses and other liabilities
20,115
19,956
Liabilities associated with non-current assets held for sale
1,946
1,946
Liabilities related to insurance contracts
125,081
Provisions
5,330
5,276
Subordinated debt
18,990
18,786
3
TOTAL LIABILITIES
1,436,429
1,305,645
EQUITY
Equity attributable to equity holders of the parent
78,884
78,881
4
Share capital and additional paid-in capital
28,240
28,240
Consolidated reserves
45,126
45,119
Gains and losses recognized directly in other comprehensive income
1,516
1,518
Net income for the period
4,003
4,004
Non-controlling interests
707
969
5
TOTAL SHAREHOLDERS’ EQUITY
79,591
79,850
in millions of euros
12/31/2020
Balance sheet in the
published financial
statements
According to the regulatory
scope of consolidation
References
At end of period
At end of period
ASSETS ‒ BREAKDOWN BY ASSET CLASSES ACCORDING TO THE BALANCE SHEET IN THE PUBLISHED FINANCIAL STATEMENTS
Cash and amounts due from central banks
153,403
153,685
Financial assets at fair value through profit or loss
196,260
196,362
•o/w debt instruments
30,055
29,805
•o/w equity instruments
38,529
38,529
•o/w loans (excluding repurchase agreements)
6,154
6,134
•o/w repurchase agreements
65,947
66,255
•o/w trading derivatives
40,233
40,292
•o/w security deposits paid
15,340
15,347
Hedging derivatives
9,608
9,608
Financial assets at fair value through other comprehensive income
49,630
49,786
Securities at amortized cost
26,732
26,729
Loans and advances due from banks at amortized cost
90,018
89,656
Loans and advances to customers at amortized cost
746,809
747,661
Revaluation differences on interest rate risk-hedged portfolios
8,941
8,941
Insurance business investments
124,566
715
Current tax assets
747
711
Deferred tax assets
3,667
3,712
1
Accrued income and other assets
16,366
16,357
Non-current assets held for sale
2,599
2,599
Investments accounted for using equity method
4,586
8,220
Investment property
770
770
Property, plant and equipment
6,222
6,215
Intangible assets
1,038
841
2
Goodwill
4,307
4,256
2
TOTAL ASSETS
1,446,269
1,326,826
LIABILITIES ‒ BREAKDOWN BY LIABILITY CLASSES ACCORDING TO THE BALANCE SHEET IN THE PUBLISHED FINANCIAL STATEMENTS
Central banks
Financial liabilities at fair value through profit or loss
191,371
190,706
3
•o/w securities sold short
22,474
22,475
•o/w other liabilities issued for trading purposes
93,528
93,528
•o/w trading derivatives
37,276
37,294
•o/w security deposits received
10,312
10,312
•o/w financial liabilities designated at fair value through profit or loss
27,782
27,098
Hedging derivatives
15,262
15,262
Debt securities
228,201
226,263
Amounts due to banks
138,416
134,007
Amounts due to customers
630,837
633,387
Revaluation difference on interest rate risk-hedged portfolios, liabilities
243
243
Current tax liabilities
485
466
Deferred tax liabilities
1,239
1,024
1
Accrued expenses and other liabilities
22,662
22,551
Liabilities associated with non-current assets held for sale
1,945
1,945
Liabilities related to insurance contracts
114,608
Provisions
6,213
6,171
Subordinated debt
16,375
16,162
3
TOTAL LIABILITIES
1,367,857
1,248,185
EQUITY
Equity attributable to equity holders of the parent
72,683
72,672
4
Share capital and additional paid-in capital
27,481
27,481
Consolidated reserves
42,547
42,540
Gains and losses recognized directly in other comprehensive income
1,045
1,042
Net income for the period
1,610
1,610
Non-controlling interests
5,728
5,968
5
TOTAL SHAREHOLDERS’ EQUITY
78,412
78,641
-
4.3 Composition of regulatory capital
Regulatory capital
Regulatory capital is determined in accordance with Regulation No. 575/2013 of the European Parliament of June 26, 2013 on capital (“CRR”) amended by EU Regulation 2019/876 (“CRR2”).
It is divided into three categories: Common Equity Tier 1, Additional Tier 1 capital and Tier 2 capital. Deductions are made from these categories.
These categories are broken down according to decreasing degrees of solidity and stability, duration and degree of subordination.
in millions of euros
12/31/2021
Basel III Phased-in (1)
12/31/2020
Basel III Phased-in (1)
Share capital and additional paid-in capital
28,240
27,481
Consolidated reserves
45,119
42,540
Net income for the period
4,004
1,610
Gains and losses recognized directly in other comprehensive income
1,518
1,042
Consolidated equity attributable to equity holders of the parent
78,881
72,672
Perpetual deeply subordinated notes classified as other comprehensive income
-
-
Consolidated equity attributable to equity holders of the parent excluding perpetual deeply subordinated notes classified as other comprehensive income
78,881
72,672
Non-controlling interests
193
4,229
•o/w prudential filters
-
-
Deductions
(4,825)
(4,835)
•o/w goodwill(2)
(4,176)
(4,095)
•o/w intangible assets(2)
(649)
(740)
•o/w irrevocable payment commitments
-
-
Prudential restatements
(4,485)
(3,097)
•o/w shortfall of credit risk adjustments to expected losses
(203)
(391)
•o/w prudent valuation
(702)
(512)
•o/w insufficient coverage for non-performing exposures ‒ Pillar II
(613)
-
Common Equity Tier 1(3)
69,764
68,969
Additional Tier 1 capital
-
8
Tier 1 capital
69,764
68,977
Tier 2 capital
12,951
9,257
TOTAL REGULATORY CAPITAL
82,715
78,234
(1)Phased-in: after taking phase-in arrangements into account.
(2)Including non-current assets and entities held for sale classified as held for sale.
(3)Common Equity Tier 1 included €27,924 million in cooperative shares (after taking allowances into account) on December 31, 2021 and €26,851 million on December 31, 2020.
-
4.4 Regulatory capital requirements and risk-weighted assets
In accordance with Regulation No. 575/2013 (CRR) of the European Parliament as amended by Regulation (EU) 2019/876 (the "CRR2"), credit risk exposures can be measured using two approaches:
•the “standardized” approach, based on external credit ratings and specific risk weightings according to Basel exposure classes;
•the “internal ratings based” (IRB) approach, based on the financial institution’s internal ratings system, broken down into two categories:
–the Foundation IRB approach – banks use only their probability of default estimates for this approach,
–the Advanced IRB approach – banks use all their internal component estimates for this approach, i.e. probability of default, loss given default, exposure at default and maturity.
The methodology applied for IRB approaches is described in greater detail in section 5 “Credit risk.”
In addition to requirements related to counterparty risk in market transactions, the regulation of June 26, 2013 provides for the calculation of an additional charge to hedge against the risk of loss associated with counterparty credit risk (CCR). Capital requirements for the Credit Valuation Adjustment (CVA) are determined using the Standardized Approach.
The table below complies with the CRR format, presenting capital requirements for credit and counterparty risks, before the CVA and after the application of risk mitigation techniques.
in millions of euros
Risk-weighted assets
Total capital
requirements
12/31/2021
12/31/2020
12/31/2021
Credit risk (excluding CCR)
368,035
361,527
29,443
•o/w standardized approach
149,609
142,651
11,969
•o/w simple IRB approach (F-IRB)
62,865
62,118
5,029
•o/w referencing approach
40
20
3
•o/w equities under the simple risk-weighted approach
36,372
44,358
2,910
•o/w advanced IRB approach (A-IRB)
111,765
106,585
8,941
Counterparty credit risk – CCR
14,399
12,052
1,152
•o/w standardized approach
3,468
-
277
•o/w internal model method (IMM)
4,357
-
349
•o/w mark-to-market
-
9,829
-
•o/w exposures on a CCP
328
253
26
•o/w credit valuation adjustment – CVA
2,536
1,969
203
•o/w other CCRs
3,711
-
297
Settlement risk
11
6
1
Securitization exposures in the banking book (after cap)
4,100
4,880
328
•o/w SEC-IRBA approach
387
788
31
•o/w SEC-ERBA (including IAA)
1,781
2,885
142
•o/w SEC-SA approach
1,596
1,206
128
•o/w 1,250%/deduction
336
-
27
Market risk
15,142
14,439
1,211
•o/w standardized approach
9,571
7,292
766
•o/w internal models approach
5,571
7,147
446
Large exposures
-
-
-
Operational risk
39,741
38,318
3,179
•o/w basic indicator approach
-
-
-
•o/w standardized approach
39,741
38,318
3,179
•o/w advanced measurement approach
-
-
-
Amounts below the deduction thresholds (before weighting of risk of 250%)
5,258
4,533
421
TOTAL
441,428
431,222
35,314
in millions of euros
Basel III phased-in
Total
Credit risk(1)
CVA
Market risk
Operational
risk
Retail banking
December 31, 2020
265,889
27
1,209
24,517
291,643
December 31, 2021
282,824
56
1,563
25,377
309,821
Global Financial Services(2)
December 31, 2020
60,466
1,822
10,199
10,657
83,144
December 31, 2021
62,187
2,248
10,465
10,788
85,688
Other
December 31, 2020
50,141
120
3,031
3,144
56,436
December 31, 2021
38,998
231
3,114
3,576
45,918
TOTAL RISK-WEIGHTED ASSETS
DECEMBER 31, 2020
376,496
1,969
14,439
38,318
431,222
DECEMBER 31, 2021
384,009
2,536
15,142
39,741
441,428
(1)Including settlement-delivery risk.
(2)Combination of the Asset & Wealth Management & Corporate & Investment Banking divisions.
-
4.5 Management of capital adequacy
The methods used by Groupe BPCE to calculate risk-weighted assets are described in section 4.4 “Regulatory capital requirements and risk-weighted assets.”
Regulatory capital and capital ratios
in millions of euros
12/31/2021
Basel III phased-in
12/31/2020
Basel III phased-in
Common Equity Tier 1 (CET1)
69,764
68,969
Additional Tier 1 (AT1) capital
-
8
TOTAL TIER 1 (T1) CAPITAL
69,764
68,977
Tier 2 (T2) capital
12,951
9,257
TOTAL REGULATORY CAPITAL
82,715
78,234
Credit risk exposure
383,998
376,490
Settlement/delivery risk exposure
11
6
CVA risk exposure
2,536
1,969
Market risk exposure
15,142
14,439
Operational risk exposure
39,741
38,318
TOTAL RISK EXPOSURE
441,428
431,222
Capital adequacy ratios
Common Equity Tier 1 ratio
15.8%
16.0%
Tier 1 ratio
15.8%
16.0%
Total capital ratio
18.7%
18.1%
•the deduction in respect of the additional Pillar 2 requirements of the insufficient provisioning of non-performing loans granted before April 26, 2019 (-12 basis points).
•the increase in Common Equity Tier 1 capital, driven in particular by earnings taken to reserves (+85 basis points) and cooperative share inflows (+25 basis points);
At 15.8%, Groupe BPCE’s Common Equity Tier 1 ratio on December 31, 2021 was also significantly higher than the ECB’s minimum requirement, as defined by the European Central Bank (ECB) during the 2021 Supervisory Review and Evaluation Process (SREP). The total capital ratio stood at 18.7% at December 31, 2021, i.e. above the ECB’s minimum requirement, compared with 18.1% at December 31, 2020.
Capital and total loss absorbing capacity (TLAC) targets are determined according to Groupe BPCE’s target ratings, in line with prudential constraints.
Capital adequacy management is therefore subject to a high management buffer which not only greatly exceeds prudential constraints on capital adequacy ratios, but is also well below the trigger for the Maximum Distributable Amount.
Capital and TLAC management is thus less sensitive to prudential changes (e.g. not dependent on G-SIB classification). As a result, the Group very predominantly builds its total loss absorbing capacity from CET1 and additionally from subordinated MREL-eligible and TLAC-eligible debt (mainly Tier 2 capital and senior non-preferred debt). The issues of these eligible debts are carried out by BPCE.
Finally, in addition to TLAC, Groupe BPCE carries bail-inable debt, the majority of which is accepted for the calculation of MREL: accordingly, senior preferred debt issued by BPCE is eligible for MREL, with Groupe BPCE leaving the possibility of meeting MREL requirements open, beyond its total loss absorbing capacity, with any bail-inable debt instrument.
The Single Resolution Board set the Group’s MREL requirement in March 2021 (equivalent to 25% of risk-weighted assets), which has now been met with room to spare. As a result, the Group does not need to modify or increase its issuance program. This requirement will be updated in the first half of 2022.
With regard to the subordination constraint, Groupe BPCE complies with Articles 92a 1.(a) and 494 of CRR Regulation No. 575/2013 providing for a requirement of 21.5% of RWA since 2022. The subordination requirement in the leverage base is set at 6.75% since 2022 pursuant to Article 92a 1.(b) of the CRR.
The Group implemented action plans over the course of 2021 aimed specifically at ensuring the capital adequacy of its networks and its subsidiaries. BPCE thus subscribed to two "Additional Tier 1" loans from Natixis (€500 million and US$430 million) and two "Tier 2" loans from Natixis (two times €900 million, i.e. €1.8 billion in total).
The entry into force of the Capital Requirements Regulation, CRR2, makes the leverage ratio a binding requirement as from June 28, 2021. The minimum requirement for this ratio to be met at all times is 3%.
This regulation authorizes certain exemptions in the calculation of exposures concerning regulated savings transferred to Caisse des Dépôts et Consignation for the totality of the centralized outstandings and Central Bank exposures for a limited period (pursuant to ECB decision 2021/27 of June 18, 2021).
This last exemption makes it possible to avoid the impact of the increase in central bank assets that began with the Covid-19 crisis. The reference date for the calculation of this adjusted requirement was set at December 31, 2019. The Group’s adjusted requirement is 3.23%.
The leverage ratio is not sensitive to risk factors and as such, it is considered as a measure that complements the solvency and liquidity management system, which already limits the size of the balance sheet. The leverage ratio is projected and managed at the same time as Groupe BPCE’s solvency trajectory. The risk of excessive leverage is also measured in the internal stress test via the projection of the regulatory leverage ratio.
Groupe BPCE’s leverage ratio, as calculated under the rules of the Commission Delegated Regulation of October 10, 2014, was 5.75% on December 31, 2021 based on phased-in Tier 1 capital and with the application of the CCR2 regulation allowing the exclusion of central bank exposures.
in millions of euros
Applicable amount
12/31/2021
12/31/2020
TOTAL ASSETS AS PER PUBLISHED FINANCIAL STATEMENTS
1,516,021
1,446,269
Adjustment for entities which are consolidated for accounting purposes but are outside the scope of regulatory consolidation
(130,526)
(119,443)
(Adjustment for securitized exposures that meet the operational requirements for the recognition of risk transference)
-
-
(Adjustment for temporary exemption of exposures to central bank (if applicable))
(172,768)
(130,523)
(Adjustment for fiduciary assets recognized on the balance sheet pursuant to the applicable accounting framework but excluded from the leverage ratio total exposure measure in accordance with paragraph 1 of point (i) of Article 429a of CRR)
-
-
Adjustment for regular-way purchases and sales of financial assets subject to trade date accounting
-
-
Adjustment for eligible cash pooling transactions
-
-
Adjustments for derivative financial instruments
(17,374)
(32,459)
Adjustment for securities financing transactions (SFTs)
7,766
(5,098)
Adjustment for off-balance sheet items (i.e. conversion to credit equivalent amounts of off-balance sheet exposures)
92,026
85,085
(Adjustment for prudent valuation adjustments and specific and general provisions which have reduced Tier 1 capital)
-
-
(Adjustment for exposures excluded from the leverage ratio total exposure measure in accordance with paragraph 1 of point (c) of Article 429a of CRR)
-
-
(Adjustment for exposures excluded from the leverage ratio total exposure measure in accordance with paragraph 1 of point (j) of Article 429a of CRR)
(76,596)
-
Other adjustments
(5,693)
(5,688)
TOTAL EXPOSURE MEASURE
1,212,857
1,238,143
Without applying the phase-in measures (in particular the exclusion of central banks) and without taking into account subordinated debt issues not eligible as additional Tier 1 capital, Groupe BPCE’s leverage ratio came to 5.03% on December 31, 2021.
As an institution exercising banking and Insurance activities, Groupe BPCE is also required to comply with a financial conglomerate ratio. This ratio is determined by comparing the financial conglomerate’s total capital against all the regulatory capital requirements for its banking and Insurance activities.
The financial conglomerate ratio demonstrates that the institution’s prudential capital sufficiently covers the total regulatory capital requirements for its banking activities (in accordance with CRR2) and insurance sector activities, in accordance with the Solvency 2 regulation.
The calculation of surplus capital is based on the statutory scope. Insurance company capital requirements, determined for the banking capital adequacy ratio by weighting the equity-method value, are replaced with capital requirements based on the solvency margin. Capital requirements within the banking scope are determined by multiplying risk-weighted assets by the applicable rate under Pillar II, i.e. 14.26% at December 31, 2021, unchanged from December 31, 2020.
-
4.6 Detailed quantitative disclosures
The detailed quantitative disclosures relating to capital management and capital requirements in the following tables enhance the information in the previous section under Pillar III.
Entity name
12/31/2021
Accounting
consolidation
method
Prudential consolidation method(1)
Description
of the entity
Full conso-
lidation
Proportionate
consolidation
Equity
method
Not conso-
lidated or
deducted
Dedu-
cted
I) CONSOLIDATING ENTITY
I-1 Banque Populaire banks
BANQUE POPULAIRE ALSACE LORRAINE CHAMPAGNE
FC
X
Banking
BANQUE POPULAIRE AQUITAINE CENTRE ATLANTIQUE
FC
X
Banking
BANQUE POPULAIRE AUVERGNE RHÔNE ALPES
FC
X
Banking
BANQUE POPULAIRE BOURGOGNE FRANCHE-COMTÉ
FC
X
Banking
BANQUE POPULAIRE DU NORD
FC
X
Banking
BANQUE POPULAIRE DU SUD
FC
X
Banking
BANQUE POPULAIRE GRAND OUEST
FC
X
Banking
BANQUE POPULAIRE MÉDITERRANÉE
FC
X
Banking
Banque Populaire Méditerranée Monaco branch
FC
X
Banking
BANQUE POPULAIRE OCCITANE
FC
X
Banking
BANQUE POPULAIRE RIVES DE PARIS
FC
X
Banking
BANQUE POPULAIRE VAL DE FRANCE
FC
X
Banking
BRED BANQUE POPULAIRE
FC
X
Banking
CASDEN BANQUE POPULAIRE
FC
X
Banking
CRÉDIT COOPÉRATIF
FC
X
Banking
I-2 Caisses d’Epargne
CAISSE D’EPARGNE AQUITAINE POITOU-CHARENTES
FC
X
Banking
CAISSE D’EPARGNE BRETAGNE PAYS DE LOIRE
FC
X
Banking
CAISSE D’EPARGNE CÔTE D’AZUR
FC
X
Banking
Caisse d’Epargne Côte d’Azur, Monaco branch
FC
X
Banking
CAISSE D’EPARGNE D’AUVERGNE ET DU LIMOUSIN
FC
X
Banking
CAISSE D’EPARGNE DE BOURGOGNE FRANCHE-COMTÉ
FC
X
Banking
CAISSE D’EPARGNE DE MIDI-PYRÉNÉES
FC
X
Banking
CAISSE D’EPARGNE HAUTS DE FRANCE
FC
X
Banking
Caisse d’Epargne Hauts de France, Belgium branch
FC
X
Banking
CAISSE D’EPARGNE ÎLE-DE-FRANCE
FC
X
Banking
CAISSE D’EPARGNE LANGUEDOC-ROUSSILLON
FC
X
Banking
CAISSE D’EPARGNE LOIRE-CENTRE
FC
X
Banking
CAISSE D’EPARGNE LOIRE DRÔME ARDÈCHE
FC
X
Banking
CAISSE D’EPARGNE GRAND EST EUROPE
FC
X
Banking
CAISSE D’EPARGNE NORMANDIE
FC
X
Banking
CAISSE D’EPARGNE PROVENCE-ALPES-CORSE
FC
X
Banking
CAISSE D’EPARGNE RHÔNE ALPES
FC
X
Banking
I-3 BPCE SA
BPCE SA
FC
X
Banking
I-4 Mutual Guarantee Companies
32 MUTUAL GUARANTEE COMPANIES
FC
X
Guarantee companies
I-5 Affiliated institutions
CRÉDIT MARITIME DE MÉDITERRANEE REGIONAL CAISSE
FC
X
Banking
II) “ASSOCIATE” INSTITUTIONS
GEDEX DISTRIBUTION
NI
X
Financial company
SOCIÉTÉ FINANCIÈRE DE LA NEF
NI
X
Financial company
SOCOREC
NI
X
Financial company
SOFISCOP SUD EST
NI
X
Guarantee company
SOMUDIMEC
NI
X
Guarantee company
C.M.G.M.
NI
X
Guarantee company
EDEL
EQ
X
Banking
III) SUBSIDIARIES, JOINT VENTURES AND ASSOCIATES
III-1 Banque Populaire subsidiaries
ACLEDA
EQ
X
Banking
ADRAXTRA CAPITAL
FC
X
Private equity
AURORA
EQ
X
Holding company
BANQUE CALÉDONIENNE D’INVESTISSEMENT
EQ
X
Banking
BANQUE DE SAVOIE
FC
X
Banking
BANQUE DE TRANSITION ÉNERGETIQUE
FC
X
Financial investment advisory services
BANQUE FRANCO LAO
FC
X
Banking
BCEL
EQ
X
Banking
BCI MER ROUGE
FC
X
Banking
BCP LUXEMBOURG
FC
X
Banking
BIC BRED
FC
X
Banking
BIC BRED (Suisse) SA
FC
X
Banking
BP DÉVELOPPEMENT
FC
X
Private equity
BPA ATOUTS PARTICIPATIONS
FC
X
Private equity
BRD CHINA LTD
FC
X
Private equity
BRED BANK CAMBODIA PLC
FC
X
Financial company
BRED BANK FIJI LTD
FC
X
Banking
BRED COFILEASE
FC
X
Non-real estate leasing
BRED GESTION
FC
X
Banking
BRED IT
FC
X
IT services
BRED SALOMON ISLAND
FC
X
Banking
BRED VANUATU
FC
X
Banking
BTP BANQUE
FC
X
Banking
BTP CAPITAL CONSEIL
FC
X
Financial investment advisory services
BTP CAPITAL INVESTISSEMENT
FC
X
Private equity
CADEC
EQ
X
Private equity
CAISSE DE GARANTIE IMMOBILIÈRE DU BÂTIMENT
EQ
X
Insurance
CAISSE SOLIDAIRE
FC
X
Financial company
CLICK AND TRUST
FC
X
Data processing
COFEG
FC
X
Consulting
COFIBRED
FC
X
Holding company
COOPEST
EQ
X
Private equity
COOPMED
EQ
X
Private equity
CREPONORD
FC
X
Non-real estate and real estate leasing
ECOFI INVESTISSEMENT
FC
X
Portfolio management
EPBF
FC
X
Payment institution
ESFIN
EQ
X
Private equity
ESFIN GESTION
FC
X
Portfolio management
EURO CAPITAL
FC
X
Private equity
FCC ELIDE
FC
X
French securitization fund (FCT)
FINANCIÈRE DE LA BP OCCITANE
FC
X
Holding company
FINANCIÈRE IMMOBILIÈRE DERUELLE
FC
X
Real estate investment
FONCiÈRE BFCA
FC
X
Real estate development/
management, real estate investmentFONCIÈRE DU VANUATU
FC
X
Real estate investment
FONCIÈRE VICTOR HUGO
FC
X
Holding company
GARIBALDI CAPITAL DÉVELOPPEMENT
FC
X
Private equity
GARIBALDI PIERRE
FC
X
Real estate operations
GESSINORD
FC
X
Real estate operations
GROUPEMENT DE FAIT
FC
X
Services company
IBP INVESTISSEMENT
FC
X
Real estate operations
IMMOCARSO SNC
FC
X
Investment property
INFORMATIQUE BANQUES POPULAIRES
FC
X
IT services
INGEPAR
FC
X
Financial investment advisory services
IRR INVEST
FC
X
Private equity
MULTICROISSANCE SAS
FC
X
Portfolio management
NAXICAP RENDEMENT 2018
FC
X
Private equity
NAXICAP RENDEMENT 2022
FC
X
Private equity
NAXICAP RENDEMENT 2024
FC
X
Private equity
NJR INVEST
FC
X
Private equity
OUEST CROISSANCE SCR
FC
X
Private equity
PARNASSE GARANTIES
EQ
X
Insurance
PARTICIPATIONS BP ACA
FC
X
Holding company
PERSPECTIVES ENTREPRISES
FC
X
Holding company
PLUSEXPANSION
FC
X
Holding company
PREPAR COURTAGE
FC
X
Insurance brokerage
PRÉPAR-IARD
FC
X
Non-life insurance
PRÉPAR-VIE
FC
X
Life insurance and endowment
PROMEPAR GESTION
FC
X
Portfolio management
RIVES CROISSANCE
FC
X
Holding company
SAS ALPES DÉVELOPPEMENT DURABLE INVESTISSEMENT
FC
X
Private equity
SAS GARIBALDI PARTICIPATIONS
FC
X
Real estate operations
SAS SOCIETE IMMOBILIERE DE LA REGION RHONE ALPES
FC
X
Real estate operations
SAS SUD CROISSANCE
FC
X
Private equity
SAS TASTA
FC
X
Services company
SASU BFC CROISSANCE
FC
X
Private equity
SAVOISIENNE
FC
X
Holding company
SBE
FC
X
Banking
SCI BPSO
FC
X
Real estate operations
SCI BPSO BASTIDE
FC
X
Real estate operations
SCI BPSO MÉRIGNAC 4 CHEMINS
FC
X
Real estate operations
SCI BPSO TALENCE
FC
X
Real estate operations
SCI DU CRÉDIT COOPÉRATIF DE SAINT-DENIS
FC
X
Real estate operations
SCI FAIDHERBE
FC
X
Real estate operations
SCI POLARIS
FC
X
Real estate operations
SCI PYTHÉAS PRADO 1
FC
X
Real estate operations
SCI PYTHEAS PRADO 2
FC
X
Real estate operations
SCI SAINT-DENIS
FC
X
Real estate operations
SEGIMLOR
FC
X
Real estate operations
SI ÉQUINOXE
FC
X
Holding company
SIPMÉA
FC
X
Real estate development/
management, real estate investmentSOCIÉTÉ CENTRALE DU CRÉDIT MARITIME MUTUEL
FC
X
Services company
SOCIÉTÉ D’EXPANSION BOURGOGNE FRANCHE-COMTÉ
FC
X
Holding company
SOCIÉTÉ IMMOBILIÈRE PROVENÇALE ET CORSE
FC
X
Holding company
SOCREDO
EQ
X
Banking
SOFIAG
FC
X
Financial company
SOFIDER
FC
X
Financial company
SPIG
FC
X
Property leasing
SUD PARTICIPATIONS IMMOBILIÈRES (formerly SAS FINANCIERE IMMOBILIERE 15)
FC
X
Housing real estate development
TISE(2)
FC
X
Private equity
TRANSIMMO
FC
X
Real estate agent
UNION DES SOCIÉTÉS DU CRÉDIT COOPÉRATIF (GIE)
FC
X
Services company
VAL DE FRANCE IMMO
FC
X
Real estate operations
VAL DE FRANCE TRANSACTIONS
FC
X
Services company
VIALINK
FC
X
Data processing
III-2 Caisses d’Epargne subsidiaries
339 UNITED STATES
FC
X
Real estate operations
ADOUR SERVICES COMMUNS
FC
X
Real estate operations
AFOPEA
FC
X
Real estate operations
APOUTICAYRE LOGEMENTS
FC
X
Real estate operations
BANQUE BCP SAS
FC
X
Banking
BANQUE DE NOUVELLE-CALÉDONIE
FC
X
Banking
BANQUE DE TAHITI
FC
X
Banking
BANQUE DU LÉMAN
FC
X
Banking
BATIMAP
FC
X
Non-real estate leasing
BATIMUR
FC
X
Non-real estate leasing
BATIROC BRETAGNE PAYS DE LOIRE
FC
X
Non-real estate and real estate leasing
BCEF 64
FC
X
Real estate operations
BDR IMMO 1
FC
X
Real estate operations
BEAULIEU IMMO
FC
X
Real estate operations
BLEU RÉSIDENCE LORMONT
FC
X
Real estate operations
BRETAGNE PARTICIPATIONS
FC
X
Private equity
BURODIN
FC
X
Real estate operations
CAPITOLE FINANCE
FC
X
Non-real estate leasing
CE DÉVELOPPEMENT
FC
X
Private equity
CE DÉVELOPPEMENT II
FC
X
Private equity
CEBIM
FC
X
Holding company
CEPAC FONCIERE
FC
X
Real estate operations
CEPAC INVESTISSEMENT ET DÉVELOPPEMENT
FC
X
Private equity
CEPAIM SA
FC
X
Real estate operations
CEPRAL
FC
X
Investments in real estate development
CRISTAL IMMO
FC
X
Real estate operations
EUROTERTIA
FC
X
Real estate operations
FERIA PAULMY
FC
X
Real estate operations
G IMMO
FC
X
Real estate operations
G102
FC
X
Real estate operations
GIE CE SYNDICATION RISQUES
FC
X
Guarantee company
IMMOCEAL
FC
X
Investment property
INCITY
FC
X
Real estate operations
IT-CE
FC
X
IT services
LABEGE LAKE H1
FC
X
Real estate operations
LANGLADE SERVICES
FC
X
Real estate operations
LEVISEO
FC
X
Real estate operations
MIDI COMMERCES
FC
X
Real estate operations
MIDI FONCIÈRE
FC
X
Real estate operations
MIDI MIXT
FC
X
Real estate operations
MONTAUDRAN PLS
FC
X
Real estate operations
MURET ACTIVITÉS
FC
X
Real estate operations
NOVA IMMO
FC
X
Real estate operations
PHILAE SAS
FC
X
Real estate operations
RIOU
FC
X
Real estate operations
ROISSY COLONNADIA
FC
X
Real estate operations
SAS FONCIÈRE DES CAISSES D’EPARGNE
FC
X
Investment property
SAS FONCIÈRE ECUREUIL II
FC
X
Investment property
SAS LOIRE CENTRE IMMO
FC
X
Real estate investment
SAS NSAVADE
FC
X
Investment property
SC RES. AILES D’ICARE
EQ
X
Real estate operations
SC RES. CARRÉ DES PIONNIERS
EQ
X
Real estate operations
SC RES. ILOT J
EQ
X
Real estate operations
SC RES. LATECOERE
EQ
X
Real estate operations
SC RES. MERMOZ
EQ
X
Real estate operations
SC RES. SAINT EXUPERY
EQ
X
Real estate operations
SCI AVENUE WILLY BRANDT
FC
X
Investment property
SCI DANS LA VILLE
FC
X
Investment property
SCI FONCIÈRE 1
FC
X
Investment property
SCI DANS LA VILLE
FC
X
Real estate operations
SCI FONCIÈRE 1
FC
X
Investment property
SCI GARIBALDI OFFICE
FC
X
Real estate operations
SCI LA FAYETTE BUREAUX
FC
X
Real estate operations
SCI LE CIEL
FC
X
Real estate operations
SCI LE RELAIS
FC
X
Real estate operations
SCI LOIRE CENTRE MONTESPAN
FC
X
Real estate operations
SCI SHAKE HDF
FC
X
Real estate operations
SCI TOURNON
FC
X
Real estate operations
SNC ECUREUIL 5 RUE MASSERAN
FC
X
Investment property
SOCIÉTÉ HAVRAISE CALÉDONIENNE
FC
X
Real estate operations
SODERO PARTICIPATIONS
FC
X
Private equity
SPPICAV AEW FONCIÈRE ECUREUIL
FC
X
Real estate operations
TECHNOCITÉ TERTIA
FC
X
Real estate operations
TÉTRIS
FC
X
Real estate operations
VIVALIS INVESTISSEMENTS
FC
X
Real estate operations
III-3 BPCE subsidiaries
ALBIANT-IT
FC
X
IT systems and software consulting
BATILEASE
FC
X
Real estate leasing
BPCE ACHATS
FC
X
Services company
BPCE BAIL
FC
X
Real estate leasing
BPCE Car lease
FC
X
Long-term vehicle leasing
BPCE ENERGECO
FC
X
Non-real estate leasing
BPCE EXPERTISE IMMOBILIER
(ex CRÉDIT FONCIER EXPERTISE)FC
X
Real estate valuation
BPCE FACTOR
FC
X
Factoring
BPCE financement
FC
X
Consumer loans
BPCE INFOGÉRANCE ET TECHNOLOGIE
FC
X
IT services
BPCE LEASE
FC
X
Non-real estate leasing
BPCE lease immo
FC
X
Real estate leasing
BPCE LEASE MADRID – Branch
FC
X
Non-real estate and real estate leasing
BPCE LEASE MILAN – Branch
FC
X
Non-real estate and real estate leasing
BPCE Lease Nouméa
FC
X
Non-real estate leasing
BPCE Lease Réunion
FC
X
Non-real estate leasing
BPCE Lease Tahiti
FC
X
Non-real estate leasing
BPCE MASTER HOME LOANS DEMUT / BPCE CONSUMER LOANS DEMUT
FC
X
French securitization fund (FCT)
BPCE MASTER HOME LOANS FCT/BPCE CONSUMER LOANS FCT
FC
X
French securitization fund (FCT)
BPCE PERSONAL CAR LEASE
FC
X
Long-term vehicle leasing
BPCE SERVICES FINANCIERS (ex CSF-GCE)
FC
X
Services company
BPCE SFH
FC
X
Funding
BPCE SOLUTIONS CRÉDIT (EX GIE ÉCUREUIL CRÉDIT)
FC
X
Services company
BPCE SOLUTIONS IMMOBILIÈRES (ex CRÉDIT FONCIER IMMOBILIER)
FC
X
Real estate operations
CICOBAIL SA
FC
X
Real estate leasing
CO ASSUR CONSEIL ASSURANCE SA (BROKERAGE)
FC
X
Insurance brokerage advisory
COMPAGNIE EUROPÉENNE DE GARANTIES ET DE CAUTIONS
FC
X
Insurance
FCT PUMACC
FC
X
Consumer loans securitization vehicle
FIDOR BANK AG (2)
FC
X
Digital banking
GCE PARTICIPATIONS
FC
X
Holding company
INTER-COOP SA
FC
X
Real estate leasing
LEASE EXPANSION SA
FC
X
IT operational leasing
MAISON FRANCE CONFORT PROU INVESTISSEMENTS
EQ
X
Real estate development
MIDT FACTORING A/S
FC
X
Factoring
MIFCOS
FC
X
Investment property
SOCFIM
FC
X
Banking
SOCFIM PARTICIPATIONS IMMOBILIÈRES
FC
X
Holding company
SOCRAM BANQUE
EQ
X
Banking
SPORTS IMAGINE
FC
X
Services company
Sud Ouest Bail SA
FC
X
Real estate leasing
SURASSUR
FC
X
Reinsurance
ONEY Group
ONEY BANK
FC
X
Holding company
FLANDRE INVESTMENT SAS
FC
X
Credit institution, electronic payment systems, new technologies and holding company
ONEY SERVICIOS FINANCIEROS EFC S.A.U (SPAIN)
FC
X
Brokerage
BA FINANS (RUSSIA)
FC
X
Brokerage, financial institution
ONEY PENZFORGALMI SZOLGALTATO KFT.
FC
X
Financial institution
ONEY MAGYARORSZAG ZRT
FC
X
Financial institution
GEFIRUS SAS
FC
X
Credit institution, electronic payment systems, new technologies and holding company
IN CONFIDENCE INSURANCE SAS
FC
X
Credit institution, electronic payment systems, new technologies and holding company
ONEY HOLDING LIMITED (MALTA)
FC
X
Holding company
ONEY LIFE (PCC) LIMITED (MALTA)
FC
X
Insurance
ONEY INSURANCE (PCC) LIMITED (MALTA)
FC
X
Insurance
ONEY POLSKA
FC
X
Brokerage, financial institution
ONEY SERVICES SP ZOO
FC
X
Brokerage, financial institution
ONEY FINANCES (ROMANIA)
FC
X
Brokerage
SMARTNEY
FC
X
Brokerage and Banking
ONEY Portugal branch
FC
X
Brokerage
ONEYTRUST SAS
FC
X
Credit institution, electronic payment systems, new technologies and holding company
ONEY SPA (ITALY)
FC
X
Brokerage
ONEY UKRAINE (UKRAINE)
FC
X
Brokerage
ONEY Gmbh
FC
X
Services, business development consulting
Groupe BPCE International
BPCE INTERNATIONAL
FC
X
Specialized credit institution
BPCE INTERNATIONAL HO CHI MINH CITY
(Vietnam branch)FC
X
Specialized credit institution
BPCE MAROC
FC
X
Real estate development
FRANSA BANK
EQ
X
Banking
OCÉORANE
FC
X
Financial investment advisory services
PRAMEX INTERNATIONAL
FC
X
International development and consulting services
PRAMEX INTERNATIONAL AP LTD – HONG KONG
FC
X
International development and consulting services
PRAMEX INTERNATIONAL AU CASABLANCA
FC
X
International development and consulting services
PRAMEX INTERNATIONAL CO LTD – SHANGHAI
FC
X
International development and consulting services
PRAMEX INTERNATIONAL CONSULTING PRIVATE LTD – MUMBAI
FC
X
International development and consulting services
PRAMEX INTERNATIONAL CORP – NEW YORK
FC
X
International development and consulting services
PRAMEX INTERNATIONAL DO BRAZIL CONSULTARIA LTDA – SAO PAULO
FC
X
International development and consulting services
PRAMEX INTERNATIONAL GmbH – FRANKFURT
FC
X
International development and consulting services
PRAMEX INTERNATIONAL LTD – LONDON
FC
X
International development and consulting services
PRAMEX INTERNATIONAL PTE. LTD. ‒ SINGAPORE
FC
X
International development and consulting services
PRAMEX INTERNATIONAL S.R.L. ‒ MILAN
FC
X
International development and consulting services
PRAMEX INTERNATIONAL SA – MADRID
FC
X
International development and consulting services
PRAMEX INTERNATIONAL SARL – TUNIS
FC
X
International development and consulting services
PRAMEX INTERNATIONAL SP. Z.O.O. ‒ VARSOVIE
FC
X
International development and consulting services
Crédit Foncier Group
BANCO PRIMUS
FC
X
Banking
BANCO PRIMUS Spain
FC
X
Banking
CFG COMPTOIR FINANCIER DE GARANTIE
FC
X
Guarantee company
COFIMAB
FC
X
Real estate agent
COMPAGNIE DE FINANCEMENT FONCIER
FC
X
Financial company
CRÉDIT FONCIER DE FRANCE
FC
X
Banking
Crédit Foncier de France – Belgium branch
FC
X
Banking
FONCIER PARTICIPATIONS
FC
X
Holding company
FONCIÈRE D’ÉVREUX
FC
X
Real estate operations
GRAMAT BALARD
FC
X
Real estate operations
SOCIÉTÉ D’INVESTISSEMENT ET DE PARTICIPATION IMMOBILIÈRE (SIPARI)
FC
X
Holding company
Banque Palatine group
ARIES ASSURANCES
FC
X
Insurance brokerage
BANQUE PALATINE
FC
X
Banking
CONSERVATEUR FINANCE
EQ
X
Fund management
PALATINE ASSET MANAGEMENT
FC
X
Asset Management
Global Financial Services Division
NATIXIS PFANDBRIEFBANK AG
FC
X
Credit institution
Azure Capital Holdings Pty Ltd
FC
X
M&A advisory services
Azure Capital Securities Pty Ltd
FC
X
Fund management and Equity capital markets
The Azure Capital Trust
FC
X
Holding company
Azure Capital Limited
FC
X
Holding company
NATIXIS AUSTRALIA PTY LTD
FC
X
Financial institutions
Saudi Arabia Investment Company
FC
X
Financial institutions
NATIXIS BELGIQUE INVESTISSEMENTS
FC
X
Investment company
EDF INVESTISSEMENT GROUPE
EQ
X
Investment company
Vermilion Advisory Company Limited
FC
X
M&A advisory services
Natixis Partners Iberia, SA
FC
X
M&A advisory services
NATIXIS NORTH AMERICA LLC
FC
X
Holding company
Peter J. Solomon Company LP
FC
X
M&A advisory services
Peter J. Solomon Securities Company
FC
X
Brokerage
NATIXIS FUNDING CORP
FC
X
Other financial company
Versailles
FC
X
Securitization vehicle
NATIXIS SECURITIES AMERICAS LLC
FC
X
Brokerage
NATIXIS FINANCIAL PRODUCTS LLC
FC
X
Derivatives transactions
NATIXIS REAL ESTATE HOLDINGS LLC
FC
X
Real estate finance
NATIXIS REAL ESTATE CAPITAL LLC
FC
X
Real estate finance
CM REO HOLDINGS TRUST
FC
X
Secondary markets finance
CM REO TRUST
FC
X
Secondary markets finance
MSR TRUST
FC
X
Real estate finance
NATIXIS US MTN Program LLC
FC
X
Issuing vehicle
NATIXIS SA
FC
X
Credit institution
NATIXIS IMMO DEVELOPPEMENT
FC
X
Housing real estate development
CONTANGO TRADING SA
FC
X
Brokerage company
Natixis Partners
FC
X
M&A advisory services
FCT Liquidité Short 1
FC
X
Securitization vehicle
EOLE COLLATERAL
FC
X
Securitization vehicle
SPG
FC
X
Mutual fund
NATIXIS MARCO
FC
X
Investment company (extension of activity)
NATIXIS INNOV
FC
X
Holding company
Investima 77
FC
X
Holding company
Natixis Alternative Holding Limited
FC
X
Holding company
Fenchurch Partners LLP
FC
X
M&A advisory services
Vermilion Partners (UK) Limited
FC
X
Holding company
Vermilion Partners LLP
FC
X
M&A advisory services
NATIXIS ASIA LTD
FC
X
Other financial company
Natixis Holdings (Hong Kong) Limited
FC
X
Holding company
Vermilion Partners (Holdings) Limited
FC
X
Holding company
Vermilion Partners Limited
FC
X
Holding company
Natixis Global Services (India) Private Limited
FC
X
Operational support
NATINIUM FINANCIAL PRODUCTS
FC
X
Securitization vehicle
Bleachers Finance
FC
X
Securitization vehicle
DF EFG3 LIMITED
FC
X
Holding company
NATIXIS JAPAN SECURITIES CO, LTD
FC
X
Financial institution
NATIXIS STRUCTURED PRODUCTS LTD
FC
X
Issuing vehicle
NATIXIS TRUST
FC
X
Holding company
NATIXIS REAL ESTATE FEEDER SARL
FC
X
Investment company
NATIXIS ALTERNATIVE ASSETS
FC
X
Holding company
Natixis Structured Issurance
FC
X
Issuing vehicle
Natixis Bank JSC, Moscow
FC
X
Banking
NATIXIS Zweigniederlassung Deutschland-Branch
FC
X
Financial institution
NATIXIS CANADA-Branch
FC
X
Financial institution
NATIXIS SHANGHAI-Branch
FC
X
Financial institution
NATIXIS BEIJING-Branch
FC
X
Financial institution
NATIXIS DUBAI - Branch
FC
X
Financial institution
NATIXIS NEW YORK-Branch
FC
X
Financial institution
NATIXIS MADRID-Branch
FC
X
Financial institution
NATIXIS LONDON - Branch
FC
X
Financial institution
NATIXIS HONG KONG-Branch
FC
X
Financial institution
NATIXIS MILAN-Branch
FC
X
Financial institution
NATIXIS TOKYO-Branch
FC
X
Financial institution
NATIXIS LABUAN-Branch
FC
X
Financial institution
NATIXIS PORTO-Branch
FC
X
Financial institution
NATIXIS SINGAPORE-Branch
FC
X
Financial institution
NATIXIS TAIWAN-Branch
FC
X
Financial institution
NATIXIS COFICINÉ
FC
X
Finance company (audiovisual)
AEW invest GmbH
FC
X
Distribution
Natixis Investment Managers Australia Pty Limited
FC
X
Distribution
Investors Mutual Limited
FC
X
Asset Management
Mirova Natural Capital Brazil Consultoria e Assessoria LTDA
FC
X
Consulting services
Natixis IM Canada Holdings Ltd
FC
X
Holding company
Natixis Investment Managers Korea Limited
FC
X
Distribution
AEW Korea LLC
FC
X
Asset Management
AEW CAPITAL MANAGEMENT, INC.
FC
X
Asset Management
AEW CAPITAL MANAGEMENT, LP
FC
X
Asset Management
AEW PARTNERS V, INC.
FC
X
Asset Management
AEW PARTNERS VI, INC.
FC
X
Asset Management
AEW PARTNERS VII, INC.
FC
X
Asset Management
AEW SENIOR HOUSING INVESTORS II INC
FC
X
Asset Management
AEW Value Investors Asia II GP Limited
FC
X
Asset Management
AEW VIA INVESTORS, LTD
FC
X
Asset Management
AEW Partners Real Estate Fund VIII LLC
FC
X
Asset Management
AEW Senior Housing Investors III LLC
FC
X
Asset Management
AEW Senior Housing Investors IV LLC
FC
X
Asset Management
AEW Partners Real Estate Fund IX, LLC
FC
X
Asset Management
AEW Cold Ops MM, LLC
FC
X
Asset Management
AEW EHF GP, LLC
FC
X
Asset Management
AEW Core Property (U.S.) GP, LLC (22)
FC
X
Asset Management
Seaport Strategic Property Program I Co-Investors, LLC
FC
X
Asset Management
ALPHASIMPLEX GROUP LLC
FC
X
Asset Management
AURORA INVESTMENT MANAGEMENT LLC
FC
X
Asset Management
CASPIAN CAPITAL MANAGEMENT, LLC
FC
X
Asset Management
EPI SLP LLC
FC
X
Asset Management
EPI SO SLP LLC
FC
X
Asset Management
GATEWAY INVESTMENT ADVISERS, LLC
FC
X
Asset Management
HARRIS ALTERNATIVES HOLDING INC
FC
X
Holding company
HARRIS ASSOCIATES LP
FC
X
Asset Management
HARRIS ASSOCIATES SECURITIES, LP
FC
X
Distribution
HARRIS ASSOCIATES, INC.
FC
X
Asset Management
LOOMIS SAYLES & COMPANY, INC.
FC
X
Asset Management
LOOMIS SAYLES & COMPANY, LP
FC
X
Asset Management
LOOMIS SAYLES ALPHA, LLC.
FC
X
Asset Management
LOOMIS SAYLES DISTRIBUTORS, INC.
FC
X
Distribution
LOOMIS SAYLES DISTRIBUTORS, LP
FC
X
Distribution
LOOMIS SAYLES TRUST COMPANY, LLC
FC
X
Asset Management
Loomis Sayles Operating Services, LLC
FC
X
Asset Management
Ostrum AM US LLC
FC
X
Asset Management
NATIXIS ASG HOLDINGS, INC
FC
X
Distribution
Flexstone Partners LLC
FC
X
Asset Management
Natixis Investment Managers, LLC
FC
X
Holding company
Natixis Advisors, LLC (formerly Natixis Advisors, LP)
FC
X
Distribution
Natixis Distribution, LLC (formerly Natixis Distribution, LP)
FC
X
Distribution
NATIXIS INVESTMENT MANAGERS INTERNATIONAL, LLC
FC
X
Distribution
NIM-os, LLC
FC
X
Media and digital
VAUGHAN NELSON INVESTMENT MANAGEMENT, INC.
FC
X
Asset Management
VAUGHAN NELSON INVESTMENT MANAGEMENT, LP
FC
X
Asset Management
Mirova US LLC
FC
X
Asset Management
Natixis IM innovation
FC
X
Asset Management
AEW Europe SA (formerly AEW SA)
FC
X
Asset Management
AEW (formerly AEW Ciloger)
FC
X
Real estate management
ALLIANCE ENTREPRENDRE
FC
X
Asset Management
DARIUS CAPITAL CONSEIL
FC
X
Financial investment advisory services
DNCA Finance
FC
X
Asset Management
Dorval Asset Management
FC
X
Asset Management
Flexstone Partners SAS
FC
X
Asset Management
Mirova
FC
X
Management of venture capital mutual funds
Natixis Investment Managers International
FC
X
Distribution
Ostrum AM (New)
FC
X
Asset Management
Natixis TradEx Solutions
FC
X
Holding company
NATIXIS INVESTMENT MANAGERS
FC
X
Holding company
NATIXIS INVESTMENT MANAGERS PARTICIPATIONS 1
FC
X
Holding company
NATIXIS INVESTMENT MANAGERS PARTICIPATIONS 3
FC
X
Holding company
NAXICAP PARTNERS
FC
X
Management of venture capital mutual funds
OSSIAM
FC
X
Asset Management
SEVENTURE PARTNERS
FC
X
Asset Management
SEEYOND
FC
X
Asset Management
MV Credit France
FC
X
Holding company
H2O AM Europe
FC
X
Asset Management
Thematics Asset Management
FC
X
Asset Management
Vauban Infrastructure Partners
FC
X
Asset Management
AEW EUROPE ADVISORY LTD
FC
X
Asset Management
AEW EUROPE CC LTD
FC
X
Asset Management
AEW EUROPE HOLDING LTD
FC
X
Asset Management
AEW EUROPE INVESTMENT LTD
FC
X
Asset Management
AEW EUROPE LLP
FC
X
Asset Management
AEW EUROPE PARTNERSHIP
FC
X
Asset Management
AEW GLOBAL ADVISORS (EUROPE) LTD
FC
X
Asset Management
AEW GLOBAL LTD
FC
X
Asset Management
AEW GLOBAL UK LTD
FC
X
Asset Management
AEW UK INVESTMENT MANAGEMENT LLP
FC
X
Asset Management
AEW PROMOTE LP LTD
FC
X
Asset Management
AEW EVP GP LLP
FC
X
Asset Management
H2O ASSET MANAGEMENT LLP
FC
X
Asset Management
H2O ASSET MANAGEMENT Corporate Member
FC
X
Asset Management
LOOMIS SAYLES INVESTMENTS Ltd (UK)
FC
X
Asset Management
NATIXIS INVESTMENT MANAGERS UK Ltd
FC
X
Distribution
Natixis Investment Managers UK (Funds) Limited (UK), LLC
FC
X
Operational support
Mirova Natural Capital Limited
FC
X
Asset Management
MV Credit Limited
FC
X
Asset Management
MV Credit LLP
FC
X
Asset Management
AEW ASIA LIMITED
FC
X
Asset Management
NATIXIS INVESTMENT MANAGERS HONG KONG LIMITED
FC
X
Asset Management
Poincaré Holdings Ltd
FC
X
Asset Management
Poincaré Capital Management Ltd
FC
X
Asset Management
Natixis Investment Managers International Hong Kong Limited
FC
X
Asset Management
PURPLE FINANCE CLO 1
FC
X
Securitization vehicle
PURPLE FINANCE CLO 2
FC
X
Securitization vehicle
Asahi Natixis Investment Managers Co. Ltd
EQ
X
Distribution
NATIXIS INVESTMENT MANAGERS JAPAN CO, LTD
FC
X
Asset Management
AEW Japan Corporation
FC
X
Asset Management
AEW Value Investors Asia III GP Limited
FC
X
Asset Management
AEW EUROPE SARL
FC
X
Asset Management
AEW EUROPE GLOBAL LUX
FC
X
Asset Management
AEW VIA IV GP Partners Sarl
FC
X
Asset Management
AEW APREF GP Sarl
FC
X
Asset Management
AEW Core Property (US) Lux GP, SARL
FC
X
Asset Management
H2O ASSET MANAGEMENT HOLDING
FC
X
Asset Management
KENNEDY FINANCEMENT Luxembourg
FC
X
Investment company – Asset management
KENNEDY FINANCEMENT Luxembourg 2
FC
X
Central corporate treasury – Asset management
LOOMIS SAYLES ALPHA Luxembourg, LLC
FC
X
Asset Management
NATIXIS INVESTMENT MANAGERS S.A
FC
X
Distribution
MV Credit SARL
FC
X
Asset Management
Thematics Subscription Economy Fund
FC
X
Asset Management
Natixis IM Mexico, S. de R.L de C.V.
FC
X
Asset Management
H2O AM MONACO SAM
FC
X
Asset Management
Prometheus Wealth Management SAM
FC
X
Asset Management
Loomis Sayles (Netherlands) BV
FC
X
Distribution
AEW CENTRAL EUROPE
FC
X
Asset Management
Natixis Investment Managers Singapore Limited
FC
X
Asset Management
AEW Asia Pte LTD
FC
X
Asset Management
LOOMIS SAYLES INVESTMENTS ASIA Pte Ltd
FC
X
Asset Management
H2O AM Asia Pte Ltd
FC
X
Asset Management
Flexstone Partners SARL
FC
X
Asset Management
Natixis Investment Managers Switzerland Sarl
FC
X
Asset Management
NATIXIS INVESTMENT MANAGERS SECURITIES INVESTMENT CONSULTING CO. LTD
FC
X
Asset Management
Natixis Investment Managers Uruguay S.A.
FC
X
Distribution
Natixis Investment Managers S.A, Zweignierderlaasung Deutschland
FC
X
Distribution
AEW Asia Limited Australian branch
FC
X
Asset Management
Natixis Investment Managers S.A., Belgian Branch
FC
X
Distribution
Natixis Investment Managers Middle East (branch)
FC
X
Distribution
Natixis Investment Managers, Branch in Spain
FC
X
Distribution
AEW Europe LLP (Branch in Spain)
FC
X
Distribution
Mirova Natural Capital Limited, branch in France
FC
X
Asset Management
AEW Italian Branch (formerly AEW Ciloger Italian Branch)
FC
X
Distribution
Natixis Investment Managers S.A, Italy Branch
FC
X
Distribution
DNCA Finance Milan Branch
FC
X
Asset Management
DNCA Finance Branch Luxembourg
FC
X
Asset Management
Natixis Investment Managers, Netherlands (branch)
FC
X
Distribution
Loomis Sayles & Company, LP, Dutch Branch
FC
X
Distribution
AEW - Dutch Branch
FC
X
Real estate management
AEW Central Europe Czech (branch)
FC
X
Distribution
Natixis Investment Managers, Nordics subsidiary (branch)
FC
X
Distribution
Mirova Sweden subsidiary (branch)
FC
X
Asset Management
Natixis Investment Managers US Holdings, LLC
FC
X
Holding company
NATIXIS PRIVATE EQUITY
FC
X
Private equity
DAHLIA A SICAR SCA
FC
X
Private equity
Natixis Wealth Management Luxembourg
FC
X
Banking
Natixis Wealth Management
FC
X
Credit institution
VEGA INVESTMENT MANAGERS
FC
X
Mutual fund holding company
1818 IMMOBILIER
FC
X
Real estate operations
TEORA
FC
X
Insurance brokerage company
Massena Partners SA
FC
X
Asset manager and investment advisory firm
Massena Wealth Management SARL
FC
X
Asset manager and investment advisory firm
Massena Partners – Branch
FC
X
Asset manager and investment advisory firm
NATIXIS INTEREPARGNE
FC
X
Employee savings plan management
NATIXIS ALGÉRIE
FC
X
Banking
SCI ALTAIR 1
FC
X
Real estate operations
SCI ALTAIR 2
FC
X
Real estate operations
FONCIERE KUPKA
FC
X
Real estate operations
NATIXIS FONCIERE SA
FC
X
Real estate investment
Insurance division
NATIXIS ASSURANCES
FC
X
Insurance company holding company
NATIXIS LIFE
FC
X
Life insurance
BPCE IARD (formerly ASSURANCES BANQUE POPULAIRE IARD)
EQ
X
Property damage insurance
BPCE Prévoyance
FC
X
Personal protection insurance
ADIR
EQ
X
Property damage insurance
FRUCTIFONCIER
FC
X
Insurance real estate investments
BPCE Vie
FC
X
Insurance
REAUMUR ACTIONS
FC
X
Insurance investment mutual fund
NAMI INVESTMENT
FC
X
Insurance real estate investments
ECUREUIL VIE DEVELOPPEMENT
EQ
X
Insurance
BPCE RELATION ASSURANCES
FC
X
Services company
SCI DUO PARIS
EQ
X
Real estate management
Fonds TULIP
FC
X
Insurance investments (Securitization funds)
FCT NA Financement de L’économie – compartiment Immocorp II
FC
X
Insurance investments (Securitization funds)
DNCA INVEST NORDEN
FC
X
Insurance investment mutual fund
THEMATICS AI AND ROBOTICS
FC
X
Asset Management
AAA ACTIONS AGRO ALIMENTAIRE
FC
X
Insurance investment mutual fund
SCPI IMMOB EVOLUTIF
FC
X
Insurance real estate investments
OPCI FRANCEUROPE IMMO
FC
X
Insurance investment mutual fund
SELECTIZ
FC
X
Insurance investment mutual fund
SELECTIZ PLUS FCP 4DEC
FC
X
Insurance investment mutual fund
ALLOCATION PILOTEE EQUILIBRE C
FC
X
Insurance investment mutual fund
MIROVA EUROPE ENVIRONNEMENT C
FC
X
Insurance investment mutual fund
Vega Euro Rendement FCP RC
FC
X
Insurance investment mutual fund
BPCE ASSURANCES
FC
X
Insurance company
BPCE APS
FC
X
Service providers
NATIXIS LIFE (branch)
FC
X
Life insurance
Payments division
NATIXIS PAYMENT SOLUTIONS
FC
X
Banking services
NATIXIS PAIEMENT HOLDING
FC
X
Holding company
XPOLLENS (formerly S-MONEY)
FC
X
Payment services
PAYPLUG
FC
X
Payment services
BIMPLI
FC
X
Payment Services, Service Vouchers and Online Service for Central Works Councils
DALENYS SA
FC
X
Holding company
DALENYS INTERNATIONAL
FC
X
Holding company
DALENYS FINANCE
FC
X
Holding company
DALENYS PAYMENT
FC
X
Payment services
DALENYS SERVICES
FC
X
Financial investment advisory services
DALENYS MARKETING
FC
X
Online services
DALENYS TECHNOLOGIES
FC
X
Online services
RECOMMERCE
FC
X
Online services
Other
NATIXIS IMMO EXPLOITATION
FC
Real estate operations
III-4 – CE Holding Participations subsidiaries
CE HOLDING PARTICIPATIONS
FC
X
Holding company
CE CAPITAL
FC
X
Holding company
HABITAT EN RÉGION SERVICES
FC
X
Holding company
III-5 Local savings companies
189 local savings companies (LSCs)
FC
X
Cooperative shareholders
(1)Prudential consolidation method:
FC Full consolidation
EQ Equity method
JA Joint activities
NI Non-integrated (not consolidated)
(2)Entity treated in accordance with IFRS 5 as of December 31, 2021.
The following table is presented in the format of Appendix VI, Commission Implementing Regulation (EU) No. 1423/2013 of December 20, 2013. For simplicity, the descriptions presented below are those of Appendix VI, i.e. phased-in terms.
in millions of euros
12/31/2021
12/31/2020
Amount
Source based on
balance sheet
reference
numbers/letters
according to the
regulatory scope
of consolidation
Amount
Source based on
balance sheet
reference
numbers/letters
according to the
regulatory scope
of consolidation
COMMON EQUITY TIER 1 (CET1) CAPITAL: INSTRUMENTS AND RESERVES
Capital instruments and the related share premium accounts
28,225
4
27,481
4
Retained earnings
3,252
4
3,094
4
Accumulated other comprehensive income (and other reserves)
41,750
4
39,011
4
Fund for general banking risks
-
-
-
-
Amount of qualifying items referred to in Article 484 (3) CRR and the related share premium accounts subject to phase out from CET1
-
-
-
-
Minority interests (amount allowed in consolidated CET1)
193
5
4,229
5
Independently reviewed interim profits net of any foreseeable charge or dividend
3,561
4
1,246
4
Common Equity Tier 1 (CET1) capital before regulatory adjustments
76,980
-
75,061
-
COMMON EQUITY TIER 1 (CET1) CAPITAL: REGULATORY ADJUSTMENTS
Additional value adjustments (negative amount)
(702)
-
(512)
-
Intangible assets (net of related tax liabilities) (negative amount)
(4,826)
2
(4,834)
2
Deferred tax assets that rely on future profitability excluding those arising from temporary differences (net of related tax liability where the conditions in Article 38 (3) CRR are met) (negative amount)
(699)
1
(698)
1
Fair value reserves related to gains or losses on cash flow hedges of financial instruments that are not valued at fair value
65
-
258
-
Negative amounts resulting from the calculation of expected loss amounts
(203)
-
(391)
-
Any increase in equity that results from securitized assets
(negative amount)-
-
-
-
Gains or losses on liabilities valued at fair value resulting from changes in own credit standing
109
-
86
-
Defined-benefit pension fund assets (negative amount)
-
-
-
-
Direct, indirect and synthetic holdings by an institution of own CET1 instruments (negative amount)
(8)
-
(2)
-
Direct, indirect and synthetic holdings of the CET 1 instruments of financial sector entities where those entities have reciprocal cross holdings with the institution designed to inflate artificially the own funds of the institution (negative amount)
-
-
-
-
Direct, indirect and synthetic holdings by the institution of the CET1 instruments of financial sector entities where the institution does not have a significant investment in those entities (amount above 10% threshold and net of eligible short positions) (negative amount)
-
-
-
-
Direct, indirect and synthetic holdings by the institution of the CET1 instruments of financial sector entities where the institution has a significant investment in those entities (amount above 10% threshold and net of eligible short positions) (negative amount)
-
-
-
-
Exposure amount of the following items which qualify for a RW of 1,250%, where the institution opts for the deduction alternative
-
-
-
-
of which: qualifying holdings outside the financial sector
(negative amount)-
-
-
-
of which: securitization positions (negative amount)
-
-
-
-
of which: free deliveries (negative amount)
-
-
-
-
Deferred tax assets arising from temporary differences (amount above 10% threshold, net of related tax liability where the conditions in Article 38 (3) CRR are met) (negative amount)
-
-
-
-
Amount exceeding the 17.65% threshold (negative amount)
-
-
-
-
•of which: direct, indirect and synthetic holdings by the institution of the CET1 instruments of financial sector entities where the institution has a significant investment in those entities
-
-
-
-
Not applicable
-
-
-
-
•of which: deferred tax assets arising from temporary differences
-
-
-
-
Losses for the current fiscal year (negative amount)
-
-
-
-
Foreseeable tax charges relating to CET1 items except where the institution suitably adjusts the amount of CET1 items insofar as such tax charges reduce the amount up to which those items may be used to cover risks or losses (negative amount)
-
-
-
-
Not applicable
-
-
-
-
Qualifying AT1 deductions that exceed the AT1 items of the institution (negative amount)
(22)
-
-
-
Other regulatory adjustments
(930)
-
-
-
Total regulatory adjustments to Common Equity Tier 1 (CET1)
(7,216)
-
(6,092)
-
Common Equity Tier 1 (CET1)
69,764
-
68,969
-
ADDITIONAL TIER 1 (AT1) CAPITAL: INSTRUMENTS
Capital instruments and the related share premium accounts
-
-
-
-
Amount of qualifying items referred to in Article 484 (4) CRR and the related share premium accounts subject to phase out from AT1
-
-
30
-
Amount of qualifying items referred to in Article 494a(1) CRR subject to phase out from AT1
-
-
-
-
Amount of qualifying items referred to in Article 494b(1) CRR subject to phase out from AT1
-
-
-
-
Qualifying Tier 1 capital included in consolidated AT1 capital (including minority interests not included in row 5) issued by subsidiaries and held by third parties
-
-
-
-
•of which: instruments issued by subsidiaries subject to phase out
-
-
-
-
Additional Tier 1 (AT1) capital before regulatory adjustments
-
-
30
-
ADDITIONAL TIER 1 (AT1) CAPITAL: REGULATORY ADJUSTMENTS
Direct, indirect and synthetic holdings by an institution of own AT1 instruments (negative amount)
-
-
-
-
Direct, indirect and synthetic holdings of the AT1 instruments of financial sector entities where those entities have reciprocal cross holdings with the institution designed to inflate artificially the own funds of the institution (negative amount)
-
-
-
-
Direct, indirect and synthetic holdings by the institution of the AT1 instruments of financial sector entities where the institution has a significant investment in those entities (net of eligible short positions) (negative amount)
(22)
-
(22)
-
Qualifying AT2 deductions that exceed the AT2 items of the institution (negative amount)
-
-
-
-
Other regulatory adjustments to AT1 capital
-
-
-
-
Total regulatory adjustments to Additional Tier 1 (AT1) capital
(22)
-
(22)
-
Additional Tier 1 (AT1) capital
-
-
8
-
Tier 1 capital (T1 = CET1 + AT1)
69,764
-
68,978
-
TIER 2 (T2) CAPITAL: INSTRUMENTS
Capital instruments and the related share premium accounts
13,699
3
10,806
3
Amount of qualifying items referred to in Article 484 (5) CRR and the related share premium accounts subject to phase out from T2 as described in Article 486(4) CRR
6
-
12
-
Amount of qualifying items referred to in Article 494a (2) CRR subject to phase out from T2
-
-
-
-
Amount of qualifying items referred to in Article 494b (2) CRR subject to phase out from T2
117
3
-
3
Qualifying own funds instruments included in consolidated T2 capital (including minority interests and AT1 instruments not included in rows 5 or 34) issued by subsidiaries and held by third parties
-
-
-
-
Credit risk adjustments
736
-
594
-
Tier 2 (T2) capital before regulatory adjustments
14,558
-
11,412
-
TIER 2 (T2) CAPITAL: REGULATORY ADJUSTMENTS
Direct, indirect and synthetic holdings by an institution of own T2 instruments and subordinated loans (negative amount)
(25)
-
(50)
-
Direct, indirect and synthetic holdings of the T2 instruments and subordinated loans of financial sector entities where those entities have reciprocal cross holdings with the institution designed to inflate artificially the own funds of the institution (negative amount)
-
-
-
-
Direct, indirect and synthetic holdings of the T2 instruments and subordinated loans of financial sector entities where the institution does not have a significant investment in those entities (amount above 10% threshold and net of eligible short positions) (negative amount)
-
-
-
-
Direct, indirect and synthetic holdings by the institution of the T2 instruments and subordinated loans of financial sector entities where the institution has a significant investment in those entities (net of eligible short positions) (negative amount)
(1,582)
-
(2,105)
-
Qualifying eligible liabilities deductions that exceed the eligible liabilities items of the institution (negative amount)
-
-
-
-
Other regulatory adjustments to T2 capital
-
-
-
-
Total regulatory adjustments to Tier 2 (T2) capital
(1,607)
-
(2,155)
-
Tier 2 (T2) capital
12,951
-
9,257
-
Total capital (TC = T1 + T2)
82,715
-
78,235
-
Total risk exposure amount
441,428
-
431,222
-
CAPITAL RATIOS AND REQUIREMENTS, INCLUDING BUFFERS
Common Equity Tier 1 (CET1)
15.80%
-
15.99%
-
Tier 1 capital
15.80%
-
16.00%
-
Total equity
18.74%
-
18.14%
-
Total CET1 capital requirements of the institution
9.33%
-
9.32%
-
•of which: capital conservation buffer requirement
2.50%
-
2.50%
-
•of which: countercyclical buffer requirement
0.02%
-
0.01%
-
•of which: systemic risk buffer requirement
0.00%
-
0.00%
-
•of which: Global Systemically Important Institution (G-SII) or Other Systemically Important Institution (O-SII) buffer
1.00%
-
1.00%
-
Common Equity Tier 1 available to meet buffers (as a percentage of risk exposure amount)
9.99%
-
9.76%
-
AMOUNTS BELOW THE THRESHOLDS FOR DEDUCTION (BEFORE RISK WEIGHTING)
Direct and indirect holdings of own funds and eligible liabilities of financial sector entities where the institution does not have a significant investment in those entities (amount below 10% threshold and net of eligible short positions)
1,337
-
882
-
Direct and indirect holdings by the institution of the CET1 instruments of financial sector entities where the institution has a significant investment in those entities (amount below 17.65% thresholds and net of eligible short positions)
2,910
-
2,319
-
Deferred tax assets arising from temporary differences (amount below 17.65% threshold, net of related tax liability where the conditions in Article 38 (3) CRR are met)
2,348
-
2,214
-
APPLICABLE CAPS ON THE INCLUSION OF PROVISIONS IN TIER 2
Credit risk adjustments included in T2 in respect of exposures subject to standardized approach (prior to the application of the cap)
-
-
-
-
Cap on inclusion of credit risk adjustments in T2 under standardized approach
1,893
-
1,804
-
Credit risk adjustments included in T2 in respect of exposures subject to internal ratings-based approach (prior to the application of the cap)
736
-
594
-
Cap for inclusion of credit risk adjustments in T2 under internal ratings-based approach
1,051
-
998
-
CAPITAL INSTRUMENTS SUBJECT TO PHASE-OUT ARRANGEMENTS (ONLY APPLICABLE BETWEEN JAN. 1, 2014 AND JAN. 1, 2022)
Current cap on CET1 instruments subject to phase out arrangements
-
-
-
-
Amount excluded from CET1 due to cap (excess over cap after redemptions and maturities)
-
-
-
Current cap applicable on AT1 instruments subject to phase out
-
-
30
-
Amount excluded from AT1 due to cap (excess over cap after redemptions and maturities)
-
-
121
-
Current cap on T2 instruments subject to phase out arrangements
6
-
12
-
Amount excluded from T2 due to cap (excess over cap after redemptions and maturities)
55
-
170
-
in millions of euros
12/31/2021
Basel III phased-in
12/31/2020
Basel III phased-in
AT1 capital instruments ineligible but benefiting from a grandfathering clause(1)
-
30
Holdings of AT1 instruments of financial sector entities more than 10%-owned
-
(22)
Transitional adjustments applicable to AT1 capital
-
-
ADDITIONAL TIER 1 (AT1) CAPITAL
-
8
(1)Amount after application of the transitional provisions: corresponds to 10% of the outstanding perpetual subordinated notes at 12/31/2021 and 20% at 12/31/2020.
Details of debt instruments recognized as Tier 1 capital, as well as their terms, as required by Implementing Regulation No. 1423/2013 are published at the following address: https://groupebpce.com/en/investors/results-and-publications/pillar-iii
in millions of euros
12/31/2021
Basel III phased-in
12/31/2020
Basel III phased-in
Eligible Tier 2 capital instruments
13,699
10,806
Own Tier 2 instruments
(25)
(50)
Tier 2 capital instruments ineligible but benefiting from a grandfathering clause(1)
123
12
Holdings of Tier 2 instruments of financial sector entities more than 10%-owned
(1,582)
(2,105)
Transitional adjustments applicable to Tier 2 capital
-
-
Excess provision over expected losses
736
594
TIER 2 CAPITAL
12,951
9,257
(1)Amount after application of the transitional provisions: corresponds to 10% of the outstanding perpetual subordinated notes at 12/31/2021 and 20% at 12/31/2020.
Issuer
Issue date
Maturity date
Currency
Amount in original
currency (in millions)
Outstandings
(in millions of euros)
Prudential net
outstandings
(in millions of euros)
BPCE
7/18/2013
7/18/2023
EUR
1,000
1,000
309
BPCE
10/22/2013
10/22/2023
USD
1,500
1,319
477
BPCE
1/21/2014
7/21/2024
USD
1,500
1,319
674
BPCE
4/16/2014
4/16/2029
GBP
750
893
893
BPCE
7/25/2014
6/25/2026
EUR
350
350
314
BPCE
7/25/2014
6/25/2026
EUR
525
525
471
BPCE
7/11/2014
7/11/2024
USD
800
703
356
BPCE
9/15/2014
3/15/2025
USD
1,250
1,099
705
BPCE
9/30/2014
9/30/2024
EUR
410
410
226
BPCE
1/30/2015
1/30/2025
JPY
27,200
208
128
BPCE
1/30/2015
1/30/2025
JPY
13,200
101
62
BPCE
2/17/2015
2/17/2027
EUR
240
240
238
BPCE
2/17/2015
2/17/2027
EUR
371
371
371
BPCE
3/24/2015
3/12/2025
EUR
375
375
240
BPCE
4/17/2015
4/17/2035
USD
270
237
237
BPCE
4/29/2015
4/17/2035
USD
100
88
88
BPCE
4/29/2015
4/17/2035
USD
30
26
26
BPCE
6/1/2015
6/1/2045
USD
130
114
114
BPCE
9/29/2015
9/29/2025
CHF
50
48
36
BPCE
11/30/2015
11/30/2027
EUR
750
750
750
BPCE
12/11/2015
12/11/2025
JPY
25,100
192
151
BPCE
12/11/2015
12/11/2025
JPY
500
4
3
BPCE
3/17/2016
3/17/2031
EUR
60
60
60
BPCE
3/17/2016
3/17/2036
USD
150
132
132
BPCE
4/1/2016
4/1/2026
USD
750
660
561
BPCE
4/22/2016
4/22/2026
EUR
750
750
646
BPCE
5/3/2016
5/3/2046
USD
200
176
176
BPCE
7/19/2016
7/19/2026
EUR
696
696
633
BPCE
7/13/2016
7/13/2026
JPY
17,300
132
120
BPCE
10/13/2021
1/13/2042
EUR
900
900
900
BPCE
10/13/2021
10/13/2046
EUR
850
850
850
BPCE
10/19/2021
10/19/2042
USD
750
660
660
BPCE
10/19/2021
10/19/2032
USD
1,000
879
879
BPCE
12/1/2021
11/30/2032
GBP
500
596
596
BPCE
12/16/2021
12/16/2031
JPY
74,600
570
570
BPCE
12/16/2021
12/16/2036
JPY
5,800
44
44
CFF
3/6/2003
3/6/2023
EUR
10
10
2
TOTAL
-
17,488
13,699
Details of debt instruments recognized as Tier 2 capital, as well as their terms, as required by Implementing Regulation No. 1423/2013 are published at the following address: https://groupebpce.com/en/investors/results-and-publications/pillar-iii
EU CCYB1 ‒ GEOGRAPHIC DISTRIBUTION OF CREDIT EXPOSURES RELEVANT FOR THE CALCULATION OF THE COUNTERCYCLICAL CAPITAL BUFFER
in millions of euros
12/31/2021
General credit
exposures
Relevant credit
exposures –
Market risk
Securiti-
zation
expo-
sures
Value at
Risk for
the
banking
book
Total
exposure
value
Capital requirements
Risk-
weighted
assets
Capital
requi-
rement
weights
(%)
Counter-
cyclical
buffer
rate
(%)
Expo-
sure
value
under
the
standar-
dized
approach
Exposure
value
under
the IRB
approach
Sum of
long and
short
positions
of
trading
book
expo-
sures
for SA
Value of
trading
book
expo-
sures for
internal
models
Relevant
credit
risk
expo-
sures ‒
Credit
risk
Relevant
credit
expo-
sures –
Market
risk
Relevant
credit
exposures
–
Securi-
tization
positions
in the
banking
book
Total
BREAKDOWN BY COUNTRY:
Bulgaria
-
5
-
-
-
5
-
-
-
-
1
0.00%
0.50%
Czech Republic
31
5
-
-
-
36
2
-
-
2
28
0.01%
0.50%
Hong Kong
39
2,853
25
-
-
2,916
86
-
-
86
1,079
0.30%
1.00%
Luxembourg
1,747
7,230
41,093
176
327
50,574
540
4
4
548
6,844
1.93%
0.50%
Norway
324
586
65
-
-
976
190
1
-
191
2,383
0.67%
1.00%
Slovakia
28
1
6
29
-
65
2
-
-
2
21
0.01%
1.00%
Other countries weighted at 0%
170,602
666,015
13,559
14,626
18,096
882,898
27,029
247
324
27,601
345,008
97.09%
0.00%
TOTAL
172,771
676,696
54,748
14,832
18,423
937,470
27,849
252
328
28,429
355,364
100.00%
in millions of euros
12/31/2021
Risk category
Category level AVA ‒
Valuation uncertainty
Total AVA
category
post-
diversi-
fication
Of which:
Total core
approach
in the
trading
book
Of which:
Total core
approach
in the
banking
book
Category level AVA
Equities
Interest
Rates
Foreign
exchange
Credit
Commo-
dities
Unearned
credit
spreads
AVA
Investment
and
funding
costs AVA
Market price uncertainty
124
13
7
176
1
26
16
182
72
110
Close-out costs
65
3
9
119
4
26
-
115
62
53
Concentrated positions
132
-
-
4
-
-
-
136
133
3
Early termination
-
-
-
-
-
-
-
-
-
-
Model risk
60
2
2
2
-
3
-
35
35
-
Operational risk
9
1
1
15
-
-
-
26
9
17
Future administrative costs
21
173
5
8
-
-
-
208
207
1
TOTAL ADDITIONAL VALUATION ADJUSTMENTS (AVAS)
702
518
184
in millions of euros
12/31/2020
Equities
Ownership
interest
Foreign
exchange
Credit
Commodities
Total
Of which:
in the
trading
book
Of which:
in the
banking
book
Liquidation uncertainties, including:
244
20
7
100
-
370
238
132
•Average value
59
7
2
65
-
133
41
92
•Close-out costs
54
13
5
23
-
94
67
27
•Concentration
131
1
-
12
-
144
130
13
Early termination
Model risk
36
2
1
-
-
39
26
13
Operational risk
11
2
1
9
-
22
12
11
Investment and financing costs
11
11
-
Unearned credit spreads
22
18
4
Future administrative costs
17
22
7
1
-
48
25
23
Other
TOTAL ADJUSTMENT
307
46
16
110
-
512
330
182
Pillar III 2020 publication ‒ CRR1 format
The leverage ratio compares Tier 1 capital to an exposure calculated quarterly on the basis of the balance sheet and off-balance sheet assets assessed using a prudential approach. Derivatives and repurchase agreements are subject to specific restatements. Commitments given are allocated a conversion factor in accordance with Article 429 (10) of the CRR.
in millions of euros
Exposures for leverage ratio
purposes under the CRR
12/31/2021
ON-BALANCE SHEET EXPOSURES (EXCLUDING DERIVATIVES AND SFTS)
On-balance sheet items (excluding derivatives, SFTs, but including collateral)
1,272,343
Gross-up for derivatives collateral provided where deducted from the balance sheet assets pursuant to the applicable accounting framework
-
(Deductions of receivables assets for cash variation margin provided in derivatives transactions)
(12,448)
(Adjustment for securities received under securities financing transactions that are recognized as an asset)
-
(General credit risk adjustments to on-balance sheet items)
-
(Asset amounts deducted in determining Tier 1 capital)
(5,693)
Total on-balance sheet exposures (excluding derivatives and SFTs)
1,254,203
DERIVATIVE EXPOSURES
Replacement cost associated with SA-CCR derivatives transactions (i.e. net of eligible cash variation margin)
13,236
Derogation for derivatives: replacement costs contribution under the simplified standardized approach
-
Add-on amounts for potential future exposure associated with SA-CCR derivatives transactions
26,686
Derogation for derivatives: Potential future exposure contribution under the simplified standardized approach
-
Exposure determined under Original Exposure Method
-
(Exempted CCP leg of client-cleared trade exposures) (SA-CCR)
-
(Exempted CCP leg of client-cleared trade exposures) (simplified standardized approach)
-
(Exempted CCP leg of client-cleared trade exposures) (Original exposure method)
-
Adjusted effective notional amount of written credit derivatives
16,727
(Adjusted effective notional offsets and add-on deductions for written credit derivatives)
(10,655)
Total derivative exposures
45,994
SECURITIES FINANCING TRANSACTION (SFT) EXPOSURES
Gross SFT assets (with no recognition of netting), after adjustment for sales accounting transactions
62,934
(Netted amounts of cash payables and cash receivables of gross SFT assets)
-
Counterparty credit risk exposure for SFT assets
7,766
Derogation for SFTs: Counterparty credit risk exposure in accordance with Articles 429e (5) and 222 CRR
-
Agent transaction exposures
-
(Exempted CCP leg of client-cleared SFT exposure)
-
Total securities financing transaction exposures
70,700
OTHER OFF-BALANCE SHEET EXPOSURES
Off-balance sheet exposures at gross notional amount
207,507
(Adjustments for conversion to credit equivalent amounts)
(115,481)
(General provisions associated with off-balance sheet exposures deducted in determining Tier 1 capital)
-
Off-balance sheet exposures
92,026
EXCLUDED EXPOSURES
(Exposures excluded from the leverage ratio total exposure measure in accordance with point (c) of Article 429a(1) CRR)
-
(Exposures exempted in accordance with point (j) of Article 429a (1) CRR (on and off balance sheet))
(76,596)
(Excluded exposures of public development banks ‒ Public sector investments)
-
(Excluded promotional loans of public development banks: Promotional loans granted by a public development credit institution)
-
(Excluded passing-through promotional loan exposures by non-public development banks (or units))
(Excluded guaranteed parts of exposures arising from export credits)
-
(Excluded excess collateral deposited at triparty agents)
-
(Excluded CSD related services of CSD/institutions in accordance with point (o) of Article 429a(1) CRR)
-
(Excluded CSD related services of designated institutions in accordance with point (p) of Article 429a(1) CRR)
-
(Reduction of the exposure value of pre-financing or intermediate loans)
-
(Total exempted exposures)
(76,596)
CAPITAL AND TOTAL EXPOSURE MEASURE
Tier 1 capital
69,764
Total exposure measure
1,212,857
LEVERAGE RATIO
Leverage ratio (in %)
5.75%
Leverage ratio (without the adjustment due to excluded exposures of public development banks ‒ Public sector investments) (in %)
5.75%
Leverage ratio (excluding the impact of any applicable temporary exemption of central bank reserves) (in %)
5.03%
Regulatory minimum leverage ratio requirement (in %)
3.23%
Additional leverage ratio requirements (in %)
0.00%
CHOICE OF TRANSITIONAL ARRANGEMENTS AND RELEVANT EXPOSURES
Choice on transitional arrangements for the definition of the capital measure
DISCLOSURE OF MEAN VALUES
Mean of daily values of gross SFT assets, after adjustment for sale accounting transactions and netted of amounts of associated cash payables and cash receivable
72,800
Quarter-end value of gross SFT assets, after adjustment for sale accounting transactions and netted of amounts of associated cash payables and cash receivables
62,934
Total exposures (including the impact of any applicable temporary exemption of central bank reserves) incorporating mean values from row 28 of gross SFT assets (after adjustment for sale accounting transactions and netted of amounts of associated cash payables and cash receivables)
1,222,724
Total exposures (excluding the impact of any applicable temporary exemption of central bank reserves) incorporating mean values from row 28 of gross SFT assets (after adjustment for sale accounting transactions and netted of amounts of associated cash payables and cash receivables)
1,395,492
Leverage ratio (including the impact of any applicable temporary exemption of central bank reserves) incorporating mean values from row 28 of gross SFT assets (after adjustment for sale accounting transactions and netted of amounts of associated cash payables and cash receivables)
5.71%
Leverage ratio (excluding the impact of any applicable temporary exemption of central bank reserves) incorporating mean values from row 28 of gross SFT assets (after adjustment for sale accounting transactions and netted of amounts of associated cash payables and cash receivables)
5.00%
EU LR3 ‒ LRSPL: BREAKDOWN OF BALANCE SHEET EXPOSURES (EXCLUDING DERIVATIVES, SFTS AND EXEMPTED EXPOSURES)
in millions of euros
12/31/2021
12/31/2020
Exposures for
leverage ratio
purposes under
the CRR
Exposures for
leverage ratio
purposes under
the CRR
TOTAL ON-BALANCE SHEET EXPOSURES (EXCLUDING DERIVATIVES, SFT AND EXEMPTED EXPOSURES), OF WHICH:
1,010,531
1,184,316
Trading book exposures
81,385
54,872
Banking book exposures, of which:
929,147
1,129,444
Covered bonds
913
832
Exposures considered as sovereign
80,664
324,501
Exposures to regional governments, MDB, international organizations and PSE not treated as sovereigns
63,413
60,249
Institutions
21,759
24,378
Exposures secured by a real estate mortgage
374,404
349,199
Retail exposures
103,601
103,314
Corporate customers
170,593
157,803
Exposures in default
17,935
17,287
Other exposures (e.g. equity, securitizations, and other non-credit obligation assets)
95,865
91,882
in millions of euros
12/31/2021
09/30/2021
06/30/2021
03/31/2021
12/31/2020
OWN FUNDS AND ELIGIBLE LIABILITIES, RATIOS AND COMPONENTS OF THE RESOLUTION GROUP
TLAC equity and eligible liabilities
109,407
101,692
100,824
103,731
101,906
Risk-weighted assets (RWA)
441,428
442,119
439,589
434,082
431,222
TLAC ratio (in % of RWA)
24.78%
23.00%
22.94%
23.90%
23.63%
Leverage exposure measure
1,212,857
1,208,391
1,198,965
1,283,262
1,238,142
TLAC ratio (in % of leverage exposure)
9.02%
8.42%
8.41%
8.08%
8.23%
Does the exemption from subordination allowed by Article 72b (4) of Regulation (EU) No. 575/2013 apply? (5% exemption)
n.a
n.a
n.a
n.a
n.a
Aggregate amount of permitted non-subordinated eligible liabilities instruments if the subordination discretion as per Article 72b (3) of Regulation (EU) No. 575/2013 is applied (max 3.5% exemption)
n.a
n.a
n.a
n.a
n.a
If a capped subordination exemption applies under Article 72b (3) of Regulation (EU) No. 575/2013, the amount of funding issued that ranks pari passu with excluded liabilities and that is recognized under row 1, divided by funding issued that ranks pari passu with excluded Liabilities and that would be recognized under row 1 if no cap was applied (in %)
n.a
n.a
n.a
n.a
n.a
NB: As part of the annual resolvability analysis, Groupe BPCE chose to waive the option provided for by Article 72 b (3) of the CRR to use preferred senior debt to comply with the TLAC and subordinated MREL.
in millions of euros
12/31/2021
G-SII requirement for own
funds and eligible liabilities
(TLAC)
Common Equity Tier 1 (CET1)
69,764
Additional Tier 1 (AT1) capital
-
Tier 2 (T2) capital
12,951
TLAC eligible capital
82,715
Eligible liabilities instruments issued directly by the resolution entity that are subordinated to excluded liabilities (not grandfathered)
8,849
Eligible liabilities instruments issued by other entities within the resolution group that are subordinated to excluded liabilities (not grandfathered)
-
Eligible liabilities instruments that are subordinated to excluded liabilities, issued prior to June 27, 2019 (subordinated grandfathered)
13,542
Tier 2 instruments with a residual maturity of at least one year to the extent they do not qualify as Tier 2 items
4,300
Eligible liabilities that are not subordinated to excluded liabilities (not grandfathered pre cap)
-
Eligible liabilities that are not subordinated to excluded liabilities issued prior to June 27, 2019 (pre-cap)
-
Amount of non-subordinated instruments eligible, where applicable after application of Article 72b (3) of Regulation (EU) No. 575/2013
-
TLAC-Eligible liabilities items before adjustments
26,692
TLAC-eligible equity items before adjustments
109,407
(Deduction of exposures between MPE resolution groups)
-
(Deduction of investments in other eligible liabilities instruments)
-
TLAC-Own funds and eligible liabilities after adjustments
109,407
Risk-weighted assets (RWA)
441,428
Total leverage exposure measure
1,212,857
TLAC ratio (in % of RWA)
24.78%
TLAC ratio (in % of leverage exposure)
9.02%
CET1 (as a percentage of TREA) available after meeting the resolution group’s requirements
3.27%
Overall institution-specific capital buffer requirement
3.52%
•of which: capital conservation buffer requirement
2.50%
•of which: countercyclical buffer requirement
0.02%
•of which: systemic risk buffer requirement
0.00%
•of which: Global Systemically Important Institution (G-SII) or Other Systemically Important Institution (O-SII) buffer
1.00%
Total amount of excluded liabilities referred to in Article 72a (2) of Regulation (EU) No. 575/2013
660,311
The creditor hierarchy for items included in the TLAC is as follows by order of repayment priority: senior non-preferred debt, subordinated debt eligible as Tier 2 capital on issuance and subordinated debt eligible as Tier 1 capital on issuance.
Eligible liabilities and their features are published at the following address: https://groupebpce.com/en/investors/results-and-publications/pillar-iii
in millions of euros
12/31/2021
Hierarchy in the event of insolvency
TOTAL
1
2
4
(lowest rank)
(highest rank)
Description of insolvency rank
CET1 capital
Tier 2
Senior
non-preferred debtLiabilities and own funds
69,764
17,646
25,255
112,665
•of which: excluded liabilities
-
-
-
-
Liabilities and own funds less excluded liabilities
69,764
17,646
25,255
112,665
Of which instruments eligible for the TLAC ratio
69,764
17,251
22,392
109,407
•of which residual maturity ≥ 1 year < 2 years
-
2,365
4,228
6,593
•of which residual maturity ≥ 2 years < 5 years
-
7,844
8,181
16,024
•of which residual maturity ≥ 5 years < 10 years
-
3,053
8,710
11,764
•of which residual maturity ≥ 10 years, but excluding perpetual securities
-
4,850
1,272
6,123
•of which perpetual securities
69,764
-
-
69,764
-
Foreword
As part of the management of the health crisis and its economic consequences, the Risk division has continued the specific actions started in 2020 in order to strengthen the monitoring of the credit portfolio and to support Groupe BPCE in the deployment of the measures put in place by the government. The State-guaranteed loan (SGL) has been extended until June 30, 2022. The support system for the French economy and companies was supplemented in May 2021 by the Participating Recovery Loan (PPR), the aim of which is to enable SMEs and medium-sized companies to strengthen their financial structure and continue to invest.
-
5.1 Credit risk management
•defining and implementing the standards and methods for risk taking and management within the Group’s consolidated scope in accordance with regulations;
•establishing the principles of Risk division through global risk caps and monitoring compliance with them;
•defining and reviewing the Group’s risk management systems by drawing up Group credit risk policies and defining individual limits on shared counterparties;
•analyzing the non-delegated grant files of the Group’s subsidiaries and examine the main files managed in the Watchlist;
•leading the credit risk sectors, in particular through very frequent audio-conferences, national days, regional platforms or thematic working groups.
Credit policy
The overall credit risk policy is governed in particular by the risk appetite system, structured around the definition of the level of risk and risk appetite indicators. The balance between the search for profitability and the level of risk accepted is reflected in Groupe BPCE’s credit risk profile and is reflected in the Group’s credit risk management policies. Groupe BPCE refrains from engaging in activities over which it has insufficient control. Activities with high risk-reward profiles are identified and strictly controlled.
-
5.2 Risk measurement and internal ratings
Current situation
Customer segment
12/31/2021
Banque
Populaire
network
Caisse
d’Epargne
network
Crédit
Foncier/Banque
Palatine/BPCE
International
subsidiaries
Natixis
BPCE SA
Central banks and other sovereign exposures
IRBF
Standard
Standard
IRBA
IRBF
Central administrations
IRBF
Standard
Standard
IRBA
IRBF
Public sector and similar entities
Standard
Standard
Standard
Standard
Standard
Institutions
IRBF
Standard
Standard
IRBA/Standard
IRBF
Corporates (Rev.* > €3m)
IRBF/Standard
IRBF/Standard
Standard
IRBA/Standard
Standard
Retail
IRBA
IRBA
Standard
Standard
*Rev.: revenues.
The Oney subsidiary is approved for credit models applicable to retail customers in France. The Portugal, Spain, Russia, Hungary and Poland scopes use the standardized approach.
in %
12/31/2021
12/31/2020
EAD
EAD
Standard
IRBF
IRBA
Standard
IRBF
IRBA
Central banks and other sovereign exposures
26%
56%
18%
32%
57%
12%
Central administrations
39%
34%
27%
39%
34%
27%
Public sector and similar entities
99%
0%
1%
98%
0%
1%
Institutions
49%
9%
42%
51%
9%
40%
Corporate customers
39%
23%
39%
39%
23%
38%
Retail
9%
0%
91%
11%
0%
89%
TOTAL
29%
19%
52%
31%
19%
51%
-
5.3 Use of credit risk mitigation techniques
Credit risk mitigation techniques are widely used within the Group and are divided into real guarantees and personal guarantees.
A distinction is made between guarantees having an actual impact on collections in the event of hardships and guarantees recognized by the supervisory authority in the weighting of exposures used to reduce capital consumption. For example, a personal and joint guarantee provided in due form by a company director who is a customer of the Group, and collected in accordance with regulations, may be effective without being eligible as a statistical risk mitigation factor.
In some cases, the Group’s institutions choose, in addition to employing risk mitigation techniques, to take opportunities to sell portfolios of disputed loans, particularly when the techniques used are less effective or non-existent.
Credit derivatives are also used to reduce risks, and apply almost exclusively to the Corporate customers asset class (and mainly Natixis).
Definition of guarantees
A real guarantee involves one or more solidly measured movable or immovable assets that belong to the debtor or a third party. This guarantee consists of granting the creditor a real right to said asset (mortgage, pledge of real property, pledge of listed liquid securities, pledge of listed liquid merchandise with or without divestiture, pledge, third party guarantee, etc.).
-
5.4 Quantitative disclosures
Credit risk exposure
Groupe BPCE’s total gross exposures amounted to more than €1,431 billion on December 31, 2021, up €78 billion.
Gross exposures are very predominantly located in Europe, especially in France, for all asset classes (69% of corporates).
Concentration by borrower
12/31/2021
12/31/2020
Breakdown
Gross
amount/Total
large
exposures(1)
Weight in
relation to
capital
Gross amount/
Capital(2)
Breakdown
Gross
amount/Total
large
exposures(1)
Weight in
relation to
capital
Gross amount/
Capital(2)
No. 1 borrower
3.9%
10.7%
2.9%
6.2%
Top 10 borrowers
17.6%
48.1%
20.5%
43.6%
Top 50 borrowers
47.6%
130.1%
52.8%
112.2%
Top 100 borrowers
68.5%
187.0%
74.8%
159.1%
(1)Total large exposures excluding sovereigns for Groupe BPCE (€190.4 billion at 12/31/2021).
(2)Groupe BPCE regulatory capital (Corep CA1 row 11 at 12/31/2021): €69.8 billion.
-
5.5 Detailed quantitative disclosures
The detailed quantitative disclosure relating to credit risk in the following tables enhance the information in the previous section in respect of Pillar III.
•exposure: all assets (e.g. loans, advances, accrued income, etc.) related to transactions on the market or with a customer and recorded on the bank’s balance sheet and off-balance sheet;
•expected loss (EL): the value of the loss likely to be incurred given the quality of the structure of the transaction and any measures taken to mitigate risk, such as collateral. In the IRBA method, the following equation summarizes the relationship between these variables: EL = EAD x PD x LGD (except for loans in default);
•risk-weighted assets (RWA): calculated on the basis of exposures and the level of risk associated with them, which depends on the credit quality of the counterparties.
The reporting lines show exposures by standard or IRB approach, by geographic area, by sector of activity and by maturity. They also present credit quality by standardized approach or IRB, by geographic area and by business segment.
The tables are presented with respect to credit risk after application of risk mitigation techniques and including CVA. The breakdowns are presented without substitution by the guarantor segment.
Credit risk exposure after mitigation effects and the effects of credit derivatives on risk-weighted assets are also presented.
•central banks and other sovereign exposures: centralization of regulated savings with the Caisse des Dépôts et Consignations, deferred taxes and reserves;
•central governments: receivables from sovereign states, central and governments and similar, multilateral development banks and international organizations;
•public sector and similar: receivables from national public institutions, local authorities or other public sector entities, including private social housing;
•financial institutions: receivables from regulated credit institutions and similar, including clearing houses;
•companies: other receivables, in particular large corporates, SMEs, medium-sized companies, insurance companies, funds, etc.;
•retail customers: receivables from individual customers, very small businesses, professional customers and self-employed customers;
•exposure to retail customers is further broken down into several categories: exposures guaranteed by a real estate mortgage excluding SMEs, exposures guaranteed by a real estate mortgage including SMEs, revolving exposures, other exposures to retail customers, of which SMEs and other non-SME retail exposures;
•other assets: this class includes all assets other than those whose risk relates to third parties (fixed assets, goodwill, residual values on finance leases, etc.)
in millions of euros
12/31/2021
Collateral obtained by taking possession
Value at initial recognition
Accumulated
negative changes
Property, plant and equipment (PP&E)
2
(1)
Other than PP&E
28
(6)
Residential immovable property
17
(5)
Commercial Immovable property
1
Other collateral
10
(1)
TOTAL
30
(6)
Loans and advances subject to legislative and non-legislative moratoriums
in millions of euros
12/31/2021
Number
of
obligors
Gross amount
Of which:
Expired
terms
Residual maturity of moratorium
<=
3 months
<
3 months
<=
6 months
<
6 months
<=
9 months
<
9 months
<=
12 months
> 1 year
Loans and advances for which a moratorium has been offered
464,607
25,320
///
///
///
///
///
///
Loans and advances subject to moratoriums (granted)
464,607
25,320
25,320
0
0
0
0
0
o/w: Households
///
2,354
2,354
0
0
0
0
0
o/w: Guaranteed by residential real estate assets
///
1,249
1,249
0
0
0
0
0
o/w: Non-financial corporations
///
22,966
22,966
0
0
0
0
0
o/w: SMEs
///
14,300
14,300
0
0
0
0
0
o/w: Guaranteed by commercial real estate assets
///
5,779
5,779
0
0
0
0
0
in millions of euros
12/31/2020
Number
of
obligors
Gross amount
Of which:
Expired
terms
Residual maturity of moratorium
<=
3 months
<
3 months
<=
6 months
<
6 months
<=
9 months
<
9 months
<=
12 months
> 1 year
Loans and advances for which a moratorium has been offered
426,889
25,233
///
///
///
///
///
///
Loans and advances subject to moratoriums (granted)
426,889
25,233
21,404
2,670
219
57
854
29
o/w: Households
///
1,982
1,821
120
25
6
6
6
o/w: Guaranteed by residential real estate assets
///
893
809
58
16
3
3
3
o/w: Non-financial corporations
///
22,006
18,400
2,508
176
50
849
23
o/w: SMEs
///
13,991
11,974
1,845
127
19
21
6
o/w: Guaranteed by commercial real estate assets
///
1,696
1,363
307
18
4
2
1
in millions of euros
12/31/2021
Gross amount
Maximum amount
of the guarantee
that can be
considered
Gross amount
o/w: subject to
restructuring
Public guarantees
received*
Incoming capital on
non-performing
exposures
New loans and advances provided under public guarantee schemes
27,921
360
o/w: Households
788
///
///
o/w: Guaranteed by residential real estate assets
2
///
///
o/w: Non-financial corporations
27,133
360
o/w: SMEs
8,633
///
///
o/w: Guaranteed by commercial real estate assets
21
///
///
*State-guaranteed loans in France with a guarantee of between 70% and 90%.
in millions of euros
12/31/2020
Gross amount
Maximum amount
of the guarantee
that can be
considered
Gross amount
o/w: subject to
restructuring
Public guarantees
received*
Incoming capital on
non-performing
exposures
New loans and advances provided under public guarantee schemes
30,643
70
o/w: Households
859
///
///
o/w: Guaranteed by residential real estate assets
///
///
o/w: Non-financial corporations
29,552
70
o/w: SMEs
9,886
///
///
o/w: Guaranteed by commercial real estate assets
5
///
///
*State-guaranteed loans in France with a guarantee of between 70% and 90%.
-
6.1 Counterparty risk management
Counterparty risk is the credit risk generated on market, investment and/or settlement transactions. It is the risk of the counterparty not being able to meet its obligations to Group institutions.
It is also related to the cost of replacing a derivative instrument if the counterparty defaults, and is similar to market risk given default.
Counterparty risk also arises on cash management and market activities conducted with customers, and on clearing activities via a clearing house or external clearing agent.
Exposure to counterparty risk is measured using the internal ratings-based approach and standardized approach.
Measuring counterparty risk
In economic terms, Groupe BPCE and its subsidiaries measure counterparty risk for derivative instruments (swaps or structured products, for instance) using the IRB method for Natixis, or the mark-to-market method for other institutions. In order to perfect the economic measurement of the current and potential risk inherent in derivatives, a tracking mechanism based on a standardized economic measurement is currently being instituted throughout Groupe BPCE.
Natixis uses an internal model to measure and manage its own counterparty risk. Using Monte Carlo simulations for the main risk factors, this model measures the positions on each counterparty and for the entire lifespan of the exposure, taking netting and collateralization criteria into account.
The model thus determines the EPE (Expected Positive Exposure) profile and the PFE (Potential Future Exposure) profile, the latter being the main indicator used by Natixis for assessing counterparty risk exposure. This indicator is calculated as the 97.7% percentile of the distribution of exposures for each counterparty.
In 2021, the counterparty risk assessment model developed by Natixis (PFE) is being rolled out to other Group entities (replacing the historical calculation of the counterparty risk base on market transactions through marking-to-market), enabling more refined risk management at Group level. The Group’s entities, excluding Natixis, continue to use the standard model for assessing capital requirements for counterparty risk.
-
6.2 Quantitative disclosures
in millions of euros
12/31/2021
12/31/2020
Standard
IRB
Total
Total
Exposure
EAD
RWA
Exposure
EAD
RWA
Exposure
Exposure
EAD
RWA
Central banks and other sovereign exposures
-
-
-
2,713
2,713
96
2,713
1,874
1,874
118
Central administrations
10
10
-
6,630
6,630
154
6,641
6,874
6,838
117
Public sector and similar entities
1,194
1,194
229
209
209
-
1,403
1,691
1,581
338
Institutions
14,675
17,306
723
17,917
17,929
6,023
32,592
30,582
29,276
3,818
Corporate customers
907
875
923
18,210
18,210
5,774
19,116
19,488
19,488
7,175
Retail
13
14
10
3
3
2
15
7
7
5
Equities
-
-
-
-
-
-
-
-
-
-
Securitization
34
34
5
1,257
1,257
293
1,291
1,720
1,720
342
TOTAL
16,832
19,432
1,890
46,939
46,952
12,342
63,771
62,234
60,783
11,913
in millions of euros
12/31/2021
12/31/2020
Standard
IRB
Total
Standard
IRB
Total
Derivatives
Central banks and other sovereign exposures
-
260
260
-
278
278
Central administrations
10
2,340
2,350
75
2,680
2,755
Public sector and similar entities
1,191
209
1,400
1,584
95
1,679
Institutions
10,552
8,498
19,049
10,691
6,673
17,364
Corporate customers
762
9,275
10,037
680
9,677
10,356
Retail
13
3
15
4
3
7
Securitization
34
1,257
1,291
248
1,472
1,720
TOTAL
12,561
21,841
34,403
13,282
20,878
34,159
Repurchase agreements
Central banks and other sovereign exposures
-
2,454
2,454
-
1,596
1,596
Central administrations
-
4,290
4,290
-
4,118
4,118
Public sector and similar entities
2
-
2
12
-
12
Institutions
4,124
9,419
13,543
3,504
9,713
13,218
Corporate customers
144
8,935
9,079
366
8,766
9,131
Retail
-
0
0
-
0
0
Securitization
-
-
-
-
-
-
TOTAL
4,270
25,098
29,369
3,882
24,193
28,075
-
6.3 Detailed quantitative disclosures
The detailed quantitative disclosures on counterparty risk in the following tables enhances the information in the previous section, in respect of Pillar III.
in millions of euros
12/31/2021
Replacement
cost (RC)
Potential
future
exposure
(PFE)
EEPE
Alpha
used for
computing
regulatory
exposure
value
Exposure
value
pre-CRM
Exposure
value
post-CRM
Exposure
value
RWAs
EU – Original exposure method (for derivatives)
-
-
1.4
-
-
-
-
EU – Simplified SA-CCR (for derivatives)
-
-
1.4
-
-
-
-
SA-CCR (for derivatives)
1,520
3,750
1.4
26,647
8,008
8,008
3,275
IMM (for derivatives and SFTs)
10,732
1
411
15,025
15,025
4,334
Of which securities financing transaction netting sets
-
-
-
-
-
Of which derivative & long settlement transaction netting sets
10,732
411
15,025
15,025
4,334
Of which from contractual cross-product netting sets
-
-
-
-
-
Financial collateral simple method (for SFTs)
-
-
-
-
Financial collateral comprehensive method (for SFTs)
31,955
31,473
31,473
2,145
VaR for SFTs
-
-
-
-
TOTAL
59,012
54,507
54,507
9,754
in millions of euros
12/31/2020
Notional
amount
Replacement
cost/market
value
Potential
future
exposure
Effective
Expected
Positive
Exposure
(Effective
EPE)
Alpha used
to calculate
regulatory
EAD
EAD after
taking into
account CRM
techniques
RWAs
Mark to market
2,538
4,651
6,250
2,370
Original exposure
Standardized approach
Internal models method
12,328
1.4
17,260
4,181
Securities financing transactions (SFT)
Derivatives and long-settlement transactions
Resulting from contractual cross-product netting
Simple approach for CRM (for SFTs)
Comprehensive approach for CRM (for SFTs)
24,892
1,870
VaR for SFTs
TOTAL
8,421
Pillar III 2020 publication – CRR1 form.
in millions of euros
12/31/2021
Risk exposure value
RWAs
Total transactions subject to the advanced method
5,425
1,187
•i) VaR component (including the 3× multiplier)
65
•ii) Stressed VaR component (including the 3× multiplier)
1,122
Transactions subject to the standardized method
5,204
1,349
Transactions subject to the alternative approach (based on the original exposure method)
TOTAL TRANSACTIONS SUBJECT TO OWN FUNDS REQUIREMENTS FOR CVA RISK
10,630
2,536
in millions of euros
12/31/2020
EAD after taking into
account credit risk
mitigation techniques
RWAs
Total portfolios subject to the advanced CVA requirement
5,315
1,538
•VaR component (including 3x multiplier)
186
•Stressed VaR component (including 3x multiplier)
1,351
Total portfolios subject to the standard CVA requirement
3,369
432
TOTAL PORTFOLIOS SUBJECT TO THE CVA REQUIREMENT
8,683
1,969
Pillar III 2020 publication – CRR1 form.
Exposure classes
in millions of euros
12/31/2021
Risk weight
0%
2%
4%
10%
20%
50%
70%
75%
100%
150%
Other
Total
exposure
value
Central governments or central banks
Regional governments or local authorities
10
407
418
Public sector entities
475
381
6
55
918
Multilateral development banks
International organizations
10
10
Institutions
2,854
13,375
351
253
16,834
Corporate customers
107
161
668
119
1,055
Retail
14
14
Institutions and corporates with a short-term credit assessment
82
57
10
149
Other items
66
25
91
TOTAL EXPOSURE VALUE
3,349
13,375
1,329
478
14
799
145
19,489
in millions of euros
12/31/2020
0%
2%
4%
10%
20%
35%
50%
70%
75%
100%
150%
250%
370%
1,250%
Other
Total on
12/31/2020
Central governments or central banks
-
-
-
-
-
-
-
-
-
-
-
-
-
-
-
-
Regional governments or local authorities
7
-
-
-
446
-
-
-
-
-
-
-
-
-
-
454
Public sector entities
497
-
-
-
555
-
15
-
-
72
-
-
-
-
-
1,139
Multilateral development banks
-
-
-
-
-
-
-
-
-
-
-
-
-
-
-
-
International organizations
74
-
-
-
-
-
-
-
-
-
-
-
-
-
-
74
Institutions
140
11,700
-
-
244
-
248
-
-
-
-
-
-
-
-
12,333
Secured bonds
-
-
-
-
-
-
-
-
-
-
-
-
-
-
-
-
Corporate customers
98
268
-
-
113
-
155
-
-
719
34
-
-
-
-
1,387
Retail
-
-
-
-
-
-
-
-
4
-
-
-
-
-
-
4
Equity exposures
-
-
-
-
-
-
-
-
-
-
-
-
-
-
-
-
Investments in units or shares of collective investment undertakings (CIU)
-
-
-
-
-
-
-
-
-
-
-
-
-
-
-
-
Other exposures
-
-
-
-
-
-
-
-
-
2
-
-
-
-
-
2
Exposures to institutions and corporates with a short-term credit assessment
-
-
-
-
6
-
55
-
-
18
-
-
-
-
-
79
Exposures secured by a real estate mortgage
-
-
-
-
-
-
-
-
-
-
-
-
-
-
-
-
High risk exposures
-
-
-
-
-
-
-
-
-
-
-
-
-
-
-
-
Exposures in default
-
-
-
-
-
-
-
-
-
-
29
-
-
-
-
29
TOTAL
817
11,968
-
-
1,365
-
473
-
4
811
63
-
-
-
-
15,502
Pillar III 2020 publication – CRR1 form
in millions of euros
12/31/2021
0
Exposure
value
Weighted
average PD
(in %)
Number of
obligors
Weighted
average LGD
(in %)
Weighted
average
maturity
(in years)
RWAs
RWA density
CENTRAL GOVERNMENTS AND CENTRAL BANKS
0.00 to < 0.15
8,850
0.00%
91
15.41%
-
23
0.26%
0.15 to < 0.25
840
0.21%
7
33.20%
-
145
17.24%
0.25 to < 0.50
98
0.10%
3
17.57%
-
24
24.58%
0.50 to <0.75
-
0.00%
-
0.00%
-
-
0.00%
0.75 to <2.50
-
0.00%
-
0.00%
-
-
0.00%
2.50 to <10.00
38
3.19%
1
47.10%
-
56
149.08%
10.00 to <100.00
-
0.00%
-
0.00%
-
-
0.00%
100.00 (default)
-
0.00%
-
0.00%
-
-
0.00%
Sub-total
9,826
0.03%
102
17.08%
-
248
2.53%
INSTITUTIONS
0.00 to < 0.15
13,644
0.00%
-
38.91%
-
2,552
18.70%
0.15 to < 0.25
1,296
0.00%
-
44.72%
-
624
48.13%
0.25 to < 0.50
438
0.00%
-
47.83%
-
321
73.31%
0.50 to <0.75
89
0.00%
-
44.87%
-
85
95.65%
0.75 to <2.50
131
0.00%
-
57.44%
-
179
136.69%
2.50 to <10.00
9
0.00%
-
66.55%
-
21
229.48%
10.00 to <100.00
-
0.00%
-
0.00%
-
-
0.00%
100.00 (default)
-
0.00%
-
0.00%
-
-
0.00%
Sub-total
15,608
0.00%
1
39.85%
-
3,782
24.23%
CORPORATE CUSTOMERS
0.00 to < 0.15
10,890
0.04%
736
32.55%
-
1,058
9.71%
0.15 to < 0.25
1,255
0.16%
190
30.23%
-
363
28.97%
0.25 to < 0.50
1,108
0.29%
233
28.33%
-
392
35.35%
0.50 to <0.75
1,061
0.51%
436
24.88%
-
409
38.52%
0.75 to <2.50
2,500
1.34%
622
31.79%
-
1,695
67.80%
2.50 to <10.00
746
4.11%
508
33.16%
-
838
112.43%
10.00 to <100.00
66
8.72%
280
23.29%
-
124
187.57%
100.00 (default)
54
87.98%
57
35.16%
-
59
108.65%
Sub-total
17,678
0.75%
3,062
31.55%
-
4,937
27.93%
RETAIL
0.00 to < 0.15
-
0.11%
21
45.00%
-
-
12.20%
0.15 to < 0.25
-
0.24%
1
45.00%
-
-
21.43%
0.25 to < 0.50
1
0.34%
56
45.00%
-
-
26.85%
0.50 to <0.75
-
0.66%
12
45.00%
-
-
39.94%
0.75 to <2.50
1
1.93%
58
45.00%
-
-
59.56%
2.50 to <10.00
-
5.37%
24
45.00%
-
-
70.87%
10.00 to <100.00
1
15.16%
13
45.00%
-
1
94.29%
100.00 (default)
-
100.00%
2
45.00%
-
-
0.00%
Sub-total
3
4.60%
187
45.00%
-
2
55.23%
TOTAL
43,115
3,352
8,969
F-IRB
in millions of euros
12/31/2021
PD range
Exposure
value
Weighted
average PD%
Number of
obligors
Weighted
average LGD
(in %)
Weighted
average
maturity
(in years)
RWAs
RWA density
CENTRAL GOVERNMENTS AND CENTRAL BANKS
0.00 to < 0.15
1
0.00%
-
45.00%
-
-
0.00%
0.15 to < 0.25
-
0.00%
-
0.00%
-
-
17.24%
0.25 to < 0.50
-
0.00%
-
0.00%
-
-
24.58%
0.50 to <0.75
-
0.00%
-
0.00%
-
-
0.00%
0.75 to <2.50
-
0.00%
-
0.00%
-
-
0.00%
2.50 to <10.00
-
0.00%
-
0.00%
-
-
149.08%
10.00 to <100.00
-
0.00%
-
0.00%
-
-
0.00%
100.00 (default)
-
0.00%
-
0.00%
-
-
0.00%
Sub-total
1
0.00%
-
45.00%
-
-
2.53%
INSTITUTIONS
0.00 to < 0.15
1,572
0.40%
-
33.11%
-
492
31.27%
0.15 to < 0.25
630
0.16%
-
0.61%
-
25
4.00%
0.25 to < 0.50
296
0.35%
-
0.00%
-
32
10.82%
0.50 to <0.75
-
0.60%
-
0.00%
-
-
104.19%
0.75 to <2.50
-
2.00%
-
0.00%
-
-
151.30%
2.50 to <10.00
2
2.91%
-
45.00%
-
2
123.20%
10.00 to <100.00
-
0.00%
-
0.00%
-
-
0.00%
100.00 (default)
-
100.00%
-
45.00%
-
-
0.00%
Sub-total
2,500
0.34%
-
21.01%
-
551
22.05%
CORPORATE CUSTOMERS
0.00 to < 0.15
278
0.27%
-
29.04%
-
181
65.26%
0.15 to < 0.25
763
0.16%
-
44.99%
-
24
3.12%
0.25 to < 0.50
27
0.32%
-
45.00%
-
15
56.05%
0.50 to <0.75
19
0.59%
-
42.39%
-
14
72.72%
0.75 to <2.50
55
1.50%
-
41.65%
-
53
96.00%
2.50 to <10.00
42
3.75%
-
45.00%
-
57
136.13%
10.00 to <100.00
20
13.29%
-
45.00%
-
43
216.66%
100.00 (default)
6
100.00%
-
45.00%
-
-
0.00%
Sub-total
1,209
1.08%
1
41.13%
-
387
32.02%
TOTAL
3,710
1
938
Collateral type
in millions of euros
12/31/2021
Collateral used in derivative transactions
Collateral used in SFTs
Fair value of collateral
received
Fair value of posted collateral
Fair value of collateral
received
Fair value of posted collateral
Segregated
Unsegregated
Segregated
Unsegregated
Segregated
Unsegregated
Segregated
Unsegregated
Cash – domestic currency
-
8,617
612
10,779
-
1,237
-
1,490
Cash – other currencies
-
1,520
-
1,713
-
6,039
-
1,596
Domestic sovereign debt
-
21
-
-
-
1
-
27
Other sovereign debt
1,904
175
-
78
-
93,670
-
102,881
Government agency debt
684
484
-
575
-
9,566
-
32,036
Corporate bonds
942
165
-
229
-
11,424
-
12,241
Equities
670
-
-
-
-
16,428
-
62,305
Other collateral
10
80
-
-
-
12,048
-
9,401
TOTAL
4,210
11,062
612
13,373
-
150,412
-
221,977
in millions of euros
12/31/2021
Protection purchased
Protection sold
Notional amounts
Single-name credit default swaps
6,356
10,397
Index credit default swaps
9,220
5,222
TRS
951
-
Credit options
-
-
Other credit derivatives
-
-
TOTAL NOTIONAL AMOUNTS
16,527
15,619
Fair value
Positive fair value (asset)
84
393
Negative fair value (liability)
(441)
(63)
in millions of euros
12/31/2020
Protection
purchased
Protection sold
Other credit
derivatives
Notional amounts
CDS
8,315
11,503
CLN
-
-
-
TRS
2,974
-
-
CDO
-
-
-
Index CDS
-
-
-
Other credit derivatives
11,041
5,602
-
CDS Single Name Hedge CVA
424
234
TOTAL NOTIONAL AMOUNTS
22,755
17,340
-
Fair value
Positive fair value (asset)
8
439
-
Negative fair value (liability)
(591)
(4)
-
Pillar III 2020 publication – CRR1 form.
in millions of euros
12/31/2021
Exposure value
RWAs
Exposures to QCCPs (total)
328
Exposures for trades at QCCPs (excluding initial margin and default fund contributions); of which
8,386
168
i) OTC derivatives
4,707
94
ii) Exchange-traded derivatives
-
-
iii) Securities financing transaction (SFT)
3,678
74
iv) Netting sets where cross-product netting has been approved
-
-
Segregated initial margin
-
Non-segregated initial margin
93
2
Prefunded default fund contributions
406
158
Unfunded default fund contributions
-
-
Exposures to non-QCCPs (total)
-
Exposures for trades at non-QCCPs (excluding initial margin and default fund contributions); of which
-
-
i) OTC derivatives
-
-
ii) Exchange-traded derivatives
-
-
iii) Securities financing transaction (SFT)
-
-
iv) Netting sets where cross-product netting has been approved
-
-
Segregated initial margin
-
Non-segregated initial margin
-
-
Prefunded default fund contributions
-
-
Unfunded default fund contributions
-
-
in millions of euros
12/31/2020
EAD post CRM
RWAs
QCCP exposures (total)
491
Exposures for transactions with qualifying central counterparties (excluding initial margins and default fund contributions); of which
10,611
212
(i) OTC derivatives
1,887
38
(ii) Listed derivatives
5,302
106
(iii) SFT
3,422
68
(iv) Approved cross-product netting sets
Segregated initial margin
Initial margin not segregated
1,352
33
Exposures to non-QCCP (total)
338
246
Exposures to non-QCCP (total)
Exposures for transactions with qualifying central counterparties (excluding initial margins and default fund contributions); of which
(i) OTC derivatives
(ii) Listed derivatives
(iii) SFT
(iv) Approved cross-product netting sets
Segregated initial margin
Initial margin not segregated
Pre-financed default fund contributions
Unfunded default fund contributions
Pillar III 2020 publication – CRR1 form.
in millions of euros
12/31/2021
12/31/2020
TOTAL NOTIONAL AMOUNT OF OUTSTANDING DERIVATIVES
9,134,065
6,160,164
•of which notional amount of derivatives traded with central counterparties
7,182,595
4,328,373
Notional amount of OTC derivatives
1,951,469
1,831,791
•of which interest rate derivatives
825,999
855,441
•of which equity derivatives
110,954
118,215
•of which currency derivatives
984,457
820,498
•of which credit derivatives
10,102
16,790
Notional amount of cleared derivatives
7,182,595
4,328,373
•of which interest rate derivatives
7,005,701
4,166,703
•of which equity derivatives
132,697
114,899
•of which currency derivatives
31,103
17,708
•of which credit derivatives
8,786
24,543
-
7.1 Regulatory framework and accounting methods
Regulatory framework
Two European regulations aimed at facilitating the development of the securitization market, preventing risks and ensuring the stability of the financial system, were published in the Official Journal of the European Union on December 28, 2017. The objective of both regulations is to govern securitization transactions in the European Union.
Sets a general framework for securitization (the previous rules were spread out in three different directives and two regulations). Establishes appropriate due diligence, risk retention and transparency requirements for parties to securitization transactions, sets loan approval criteria, lays down requirements for selling securitizations to retail clients, and prohibits resecuritization.
Also establishes a specific framework for STS (simple, transparent and standardized) securitization, by defining the criteria for transactions to meet in order to qualify as securitizations and the obligations arising from such qualification, such as the obligation to notify ESMA of securitization programs.
Amends the provisions of Regulation (EU) No. 575/2013 pertaining to securitization, including in particular the prudential requirements applicable to credit institutions and investment firms acting as originators, sponsors or investors in securitization transactions. Deals in particular with:
•STS securitizations, and the method for calculating the associated risk-weighted exposure amounts;
Hierarchy of methods: securitization capital requirements are calculated in accordance with a hierarchy of methods applied in the order of priority set by the European Commission:
•SEC-IRBA (Securitization Internal Ratings Based Approach): uses the bank’s internal rating models, which shall have been approved beforehand by the supervisor. SEC-IRBA calculates regulatory capital requirements in relation to underlying exposures as if these had not been securitized, and then applies certain pre-defined inputs;
•SEC-SA (Securitization Standardized Approach): this method is the last chance to use a formula defined by the supervisor, using as an input the capital requirements that would be calculated under the current Standardized Approach (calculates regulatory capital requirements in relation to underlying exposures – based on their class – and then applies the ratio of defaulted underlying exposures to the total amount of underlying exposures);
•SEC-ERBA (Securitization External Ratings Based Approach): based on the credit ratings of securitization tranches determined by external rating agencies.
If none of these three methods is applicable (SEC-IRBA, SEC-ERBA, SEC-SA), then the risk weight applied to the securitization is 1,250%.
The European regulation defining the new general framework for securitization and creating a clear set of criteria for Simple, Transparent and Standardized (STS) securitizations, as well as the related amendments to the CRR, were published in the Official Journal of the European Union on December 28, 2017, with an effective date of January 2019.
-
7.2 Securitization management at Groupe BPCE
Since 2014, Groupe BPCE has had a residential real estate loan securitization program to ensure the sustainability of its stock of collateral eligible for the Eurosystem, providing it with liquidity reserves.
Banking book EAD (final securitization) amounted to €18.5 billion on December 31, 2021 (up €0.4 billion year-on-year).
The positions were mainly carried by Natixis (€14.5 billion), BPCE SA (€2.3 billion, positions arising from the transfer of a portfolio of home loan and public asset securitizations from Crédit Foncier in September 2014) and BRED (€2.4 billion).
EADs in the trading portfolio amounted to €0.8 billion at December 31, 2021, and were mainly carried by Natixis (€0.5 billion) and BRED (€0.3 billion).
•the business lines comprising Natixis’ roll-out plan (+€0.24 billion), and particularly sponsoring (+€0.96 billion), investment (-€0.50 billion) and origination (-€0.22 billion);
•the workout portfolio exposures of the Corporate & Investment Banking division (formerly GAPC – workout portfolio management, i.e. -€0.09 billion) and BPCE are managed under a run-off method, whereby positions are gradually amortized but still managed (including disposals) in order to safeguard the Group’s interests by actively reducing positions under acceptable pricing conditions.
Breakdown of EAD by entity
–It consists of 28 lines, mainly transactions carried out through the ABCP Magenta sub-funds (€4.2 billion), and a Versailles liquidity line (€5.5 billion) issued by Natixis as a guarantee.
•The exposure of the banking book carried by Natixis as Originator is €2.5bn only in Banking Book for 258 lines:
–The exposure comes mainly from synthetic securitizations issued by Natixis €2.1 billion through the Kibo and Kutang SPVs. These SPVs are subject to Significant Risk Transfer. Thus, the Senior tranches are treated according to the Sec-IRBA approach, and the Junior tranches are weighted at 1,250%.
–Traditional Originator securitizations represented €0.3 billion, spread over 237 lines. The main approaches used to calculate RWA are Sec-Irba (€184 million) and Sec-Sa (€100 million).
•The exposure of the banking book carried by Natixis as an Investor is €2.3bn, of which €0.5bn in the trading book:
–The exposure as an investor is spread over 249 lines on the Banking Book. And 138 lines on the trading book.
–In the Trading Book, the positions are only as an investor, with an average WAL (Weighted Average Life) of 2.5 years.
In general, RWAs are calculated mainly according to the SEC-SA approach: €11.5 billion, followed by SEC-IRBA €2.3 billion, SEC-ERBA €0.6 billion and the default approach €27 million.
BRED BP regularly securitizes its advances. The securities issued are kept on the balance sheet to strengthen its mobilization capacities at the ECB. The underlying advances are generally home loans and occasionally equipment or professional loans. The stock of eligible securities depends on the rate of securitization. The objective for the bank is not to transfer credit risk but to improve its liquidity.
–the constitution of the pool of advances is determined by the Finance division under the supervision of the project manager. A detailed analysis of the composition of the deposit is carried out;
–the deposit is systematically analyzed in great detail by two rating agencies (S&P and Fitch Ratings in general).
–it consists of 194 lines, for an EAD of €2.1 billion, mainly housed in the NJR replacement subsidiary (87% of the volume),
–these lines are of excellent quality; 99.6% of the positions are rated at least A, 83.5% are AAA. The portfolio is 99.4% senior with 41.6% STS,
–the portfolios are regularly subjected to baseline and stress scenarios that demonstrate their full resilience.
For information, BRED Banque Populaire carried out a securitization transaction in 2021 of a portfolio of residential real estate loans, for a value of nearly €2.9 billion:
–the shares are held in treasury and therefore have no accounting impact in the consolidated financial statements;
–the program has a dual purpose: to strengthen purchasing power at the ECB and to generate LCR via securities exchanges.
As a reminder, Crédit Foncier’s securitization positions, which boast solid credit quality, were sold to BPCE at balance sheet value, with no impact on the Group’s consolidated financial statements (more than 90% of the securitization portfolio was transferred to BPCE on September 25, 2014). These exposures are recognized in loans and advances (“L&A”) and did not present a significant risk of loss on completion, as confirmed by the external audit carried out at the time of the transfer.
BPCE SA therefore acts as an Investor (securitization positions in which the Group entity has invested, but in which the Group does not act as originator or sponsor). This includes tranches acquired in programs initiated or managed by third-party banks) and this portfolio is subject to extinctive management. It is composed of:
This portfolio is monitored through quarterly internal stress tests (RWA and losses to completion) and demonstrates the robustness of the portfolio’s credit quality.
The various relevant portfolios are specially monitored by the entities and subsidiaries, and by the central institution. Depending on the scope involved, special management or steering committees regularly review the main positions and management strategies.
The central institution’s Risk division regularly reviews securitization exposures (quarterly mapping), changes in portfolio structure, risk-weighted assets and potential losses. Regular assessments of potential losses are discussed by the Umbrella Committee, as are disposal opportunities.
At the same time, special purpose surveys are conducted by the teams on potential losses and changes in risk-weighted assets through internal stress scenarios (risk-weighted assets and loss on completion).
Finally, the Risk division controls risks associated with at-risk securitization positions by identifying ratings downgrades and monitoring changes in exposures (valuation, detailed analysis). Major exposures are systematically submitted to the Group Watchlist and Provisions Committee, which meets quarterly to determine the appropriate level of provisioning.
-
7.3 Quantitative disclosures
Breakdown of exposures and risk-weighted assets
in millions of euros
12/31/2021
12/31/2020
Change
EAD
RWAs
EAD
RWAs
EAD
RWAs
Banking book
18,462
4,100
18,038
4,880
424
(780)
Investor
6,198
1,976
6,501
2,232
(303)
(256)
Originator
2,539
795
2,771
1,265
(232)
(470)
Sponsor
9,725
1,329
8,766
1,382
959
(53)
Trading book
793
514
695
187
98
327
Investor
793
514
695
187
98
327
Sponsor
-
-
-
-
-
-
TOTAL
19,255
4,614
18,734
5,067
522
(453)
-
7.4 Detailed quantitative disclosures
Banking book
in millions of euros
12/31/2021
Institution acts
as originator
Institution acts as sponsor
Institution acts as investor
Traditional
Synthetic
Sub-
total
Traditional
Synthetic
Sub-
total
Traditional
Synthetic
Sub-
total
STS
Non-
STS
STS
Non-
STS
STS
Non-
STS
Total exposures
-
402
2,137
2,539
942
8,783
-
9,725
434
5,676
88
6,198
Retail (total)
-
69
-
69
-
2,063
-
2,063
434
4,771
88
5,294
Residential mortgage loans
-
69
-
69
-
1,867
-
1,867
434
2,515
-
2,950
Credit cards
-
-
-
-
-
-
-
-
-
1,984
-
1,984
Other retail exposures
-
-
-
-
-
196
-
196
0
272
88
360
Re-securitization
-
-
-
-
-
-
-
-
-
-
-
-
Wholesale (total)
-
333
2,137
2,470
942
6,720
-
7,662
-
905
-
905
Corporate loans
-
17
2,127
2,145
-
5,499
-
5,499
-
546
-
546
Commercial mortgage loans
-
315
9
325
-
-
-
-
-
11
-
11
Leases and receivables
-
-
-
-
942
809
-
1,751
-
78
-
78
Other wholesale exposures
-
-
-
-
-
412
-
412
-
270
-
270
Re-securitization
-
-
-
-
-
-
-
-
-
0
-
0
in millions of euros
12/31/2020
Originator
Sponsor
Investor
Traditional
Synthetic
Sub-
total
Traditional
Synthetic
Sub-
total
Traditional
Synthetic
Sub-
total
STS
Non-
STS
STS
Non-
STS
STS
Non-
STS
Retail (total)
-
83
-
83
-
-
-
-
548
4,661
-
5,209
Residential mortgage loans
-
83
-
83
-
-
-
-
321
2,690
-
3,011
Credit cards
-
-
-
-
-
-
-
-
228
1,971
-
2,198
Other retail exposures
-
-
-
-
-
-
-
-
-
-
-
-
Re-securitization
-
-
-
-
-
-
-
-
-
-
-
-
Wholesale (total)
-
315
2,372
2,687
927
7,839
-
8,766
-
1,292
0
1,292
Corporate loans
-
18
2,372
2,390
-
5,061
-
5,061
-
626
-
626
Commercial mortgage loans
-
297
-
297
-
-
-
-
-
52
-
52
Leases and receivables
-
-
-
-
250
-
-
250
-
413
0
413
Other wholesale exposures
-
-
-
-
677
2,778
-
3,456
-
201
-
201
Re-securitization
-
-
-
-
-
-
-
-
-
0
-
0
Pillar III 2020 publication – CRR1 format.
in millions of euros
12/31/2021
Exposure values
(by RW bands/deductions)
Exposure value (by regulatory
approach)
RWAs
(by regulatory approach)
Capital requirement after
application of the cap
≤20%
RW
>20%
to
50%
RW
>50%
to
100%
RW
>100%
to
<1,250%
RW
1,250%/
deduc-
tions
SEC-
IRBA
SEC-
IRBA
(Incl.
IAA)
SEC-
SA
1,250%/
deduc-
tions
SEC-
IRBA
SEC-
IRBA
(Incl.
IAA)
SEC-SA
1,250%/
RW
Deduc-
tions
SEC-
IRBA
SEC-
IRBA
(Incl.
IAA)
SEC-
SA
1,250%/
RW
Deduc-
tions
Total exposures
11,563
650
1
23
26
2,321
275
9,644
24
387
108
1,326
303
31
9
106
24
Traditional transactions
9,901
175
1
23
26
184
275
9,644
24
38
108
1,326
303
3
9
106
24
Securitization
9,901
175
1
23
26
184
275
9,644
24
38
108
1,326
303
3
9
106
24
Retail
2,014
118
-
-
-
0
0
2,132
0
-
-
342
-
-
-
27
-
Of which STS
-
-
-
-
-
-
-
0
-
-
-
-
-
-
-
-
-
Wholesale
7,887
57
1
23
26
184
275
7,512
24
38
108
984
303
3
9
79
24
Of which STS
942
-
-
-
-
-
-
942
-
-
-
92
-
-
-
7
-
Wholesale
-
-
-
-
-
-
-
-
-
-
-
-
-
-
-
-
-
Synthetic transactions
1,662
475
-
0
0
2,137
-
-
0
349
-
-
0
28
-
-
0
Securitization
1,662
475
-
0
0
2,137
-
-
0
349
-
-
0
28
-
-
0
Retail underlying
-
-
-
-
-
-
-
-
-
-
-
-
-
-
-
-
-
Wholesale
1,662
475
-
0
0
2,137
-
-
0
349
-
-
0
28
-
-
0
Re-securitization
-
-
-
-
-
-
-
-
-
-
-
-
-
-
-
-
-
in millions of euros
12/31/2020
Exposure values
(by range of risk weight
Exposure values
(by regulatory approach)
RWAs
(by regulatory approach)
Capital requirement after cap
≤ 20%
> 20%
to
50%
> 50%
to
100%
>
100%
to
<1250%
1,250%
IRB
RBA
(inclu-
ding
IAA)
IRB
SFA
SA/
SSFA
1,250%
IRB
RBA
(inclu-
ding
IAA)
IRB
SFA
SA/
SSFA
1,250%
IRB
RBA
(inclu-
ding
IAA)
IRB
SFA
SA/
SSFA
1,250%
Total exposures
1,815
22
851
51
8,798
2,525
445
8,542
25
823
283
1,233
309
66
23
99
25
Traditional securitization
289
22
5
51
8,798
153
445
8,542
25
34
283
1,233
309
3
23
99
25
Of which securitization
289
22
5
51
8,798
153
445
8,542
25
34
283
1,233
309
3
23
99
25
of which Retail underlying
74
9
-
0
0
-
-
83
-
-
0
5
0
-
0
0
0
of which STS
-
-
-
-
-
-
-
-
-
-
0
-
-
-
0
-
-
of which Wholesale underlying
215
12
5
51
8,798
153
445
8,459
25
34
283
1,228
308
3
23
98
25
of which STS
-
-
-
-
927
-
-
927
-
-
-
86
-
-
-
7
-
Of which re-securitization
-
-
-
-
-
-
-
-
-
-
-
-
-
-
-
-
-
Synthetic securitization
1,526
-
846
-
0
2,372
-
-
0
789
-
-
0
63
-
-
0
Of which securitization
1,526
-
846
-
0
2,372
-
-
0
789
-
-
0
63
-
-
0
of which Retail underlying
-
-
-
-
-
-
-
-
-
-
-
-
-
-
-
-
-
of which Wholesale underlying
1,526
-
846
-
0
2,372
-
-
0
789
-
-
0
63
-
-
0
Of which re-securitization
-
-
-
-
-
-
-
-
-
-
-
-
-
-
-
-
-
Pillar III 2020 publication – CRR1 format.
in millions of euros
12/31/2021
Exposure values
(by RW bands/deductions)
Exposure value
(by regulatory approach)
RWAs
(by regulatory approach)
Capital requirement after cap
≤ 20%
RW
> 20%
to
50%
RW
> 50%
to
100%
RW
>
100%
to
<1250%
RW
1,250%
RW
IRB
RBA
(inclu-
ding
IAA)
IRB
SFA
SA/
SSFA
1,,250%
IRB
RBA
(inclu-
ding
IAA)
IRB
SFA
SA/
SSFA
1,250%
IRB
RBA
(inclu-
ding
IAA)
IRB
SFA
SA/
SSFA
1,250%
Total exposures
4,482
1,155
182
377
3
-
4,555
1,641
3
-
1,673
270
33
-
134
22
3
Traditional securitization
4,393
1,155
182
377
3
-
4,555
1,552
3
-
1,673
257
33
-
134
21
3
Securitization
4,393
1,155
182
377
3
-
4,555
1,552
3
-
1,673
257
32
-
134
21
3
Retail underlying
3,529
1,136
180
358
1
-
4,449
755
1
-
1,615
137
16
-
129
11
1
Of which STS
434
-
-
-
-
-
433
1
-
-
43
0
-
-
3
0
-
Wholesale
864
18
2
19
1
-
106
797
1
-
57
120
15
-
5
10
1
Of which STS
-
-
-
-
-
-
-
-
-
-
-
-
-
-
-
-
-
Re-securitization
-
-
-
-
0
-
-
-
0
-
-
-
1
-
-
-
0
Synthetic securitization
88
-
-
-
-
-
-
88
-
-
-
13
-
-
-
1
-
Securitization
88
-
-
-
-
-
-
88
-
-
-
13
-
-
-
1
-
Retail underlying
88
-
-
-
-
-
-
88
-
-
-
13
-
-
-
1
-
Wholesale
-
-
-
-
-
-
-
-
-
-
-
-
-
-
-
-
-
Re-securitization
-
-
-
-
-
-
-
-
-
-
-
-
-
-
-
-
-
in millions of euros
12/31/2020
Exposure values
(by range of risk weight
Exposure values
(by regulatory approach)
RWAs
(by regulatory approach)
Capital requirement after cap
≤ 20%
RW
> 20%
to
50%
RW
> 50%
to
100%
RW
>
100%
to
<1250%
RW
1,250%
RW
IRB
RBA
(inclu-
ding
IAA)
IRB
SFA
SA/
SSFA
1,250%
IRB
RBA
(inclu-
ding
IAA)
IRB
SFA
SA/
SSFA
1,250%
IRB
RBA
(inclu-
ding
IAA)
IRB
SFA
SA/
SSFA
1,250%
Total exposures
4,130
1,573
630
163
5
-
4,632
1,867
2
-
1,803
361
68
-
144
29
5
Traditional securitization
4,130
1,573
630
163
5
-
4,632
1,867
2
-
1,803
361
68
-
144
29
5
Of which securitization
4,130
1,573
630
163
5
-
4,632
1,867
2
-
1,803
361
66
-
144
29
5
of which Retail underlying
3,070
1,501
526
112
0
-
4,380
829
0
-
1,509
200
3
-
121
16
0
of which STS
548
-
-
-
-
-
526
22
-
-
53
2
-
-
4
0
-
of which Wholesale underlying
1,060
72
103
51
5
-
253
1,038
2
-
293
162
64
-
23
13
5
of which STS
-
-
-
-
-
-
-
-
-
-
-
-
-
-
-
-
-
of which re-securitization
-
-
-
-
0
-
-
-
0
-
-
-
2
-
-
-
0
Synthetic securitization
-
-
-
-
0
-
-
-
0
-
-
-
0
-
-
-
0
Of which securitization
-
-
-
-
0
-
-
-
0
-
-
-
0
-
-
-
0
of which Retail underlying
-
-
-
-
-
-
-
-
-
-
-
-
-
-
-
-
-
of which Wholesale underlying
-
-
-
-
0
-
-
-
0
-
-
-
0
-
-
-
0
Of which re-securitization
-
-
-
-
-
-
-
-
-
-
-
-
-
-
-
-
-
Pillar III 2020 publication – CRR1 format.
in millions of euros
12/31/2021
12/31/2020
Securitization
Re-
securitization
Securitization
Re-
securitization
Securitization
Re-
securitization
Securitization
Re-
securitization
EAD
EAD
RWAs
RWAs
EAD
EAD
RWAs
RWAs
Investor positions
6,198
0
1,975
1
6,501
0
2,230
2
On-balance sheet exposures
5,397
0
1,796
0
5,267
0
2,005
1
Off-balance sheet exposure and derivatives
802
0
179
1
1,234
0
225
1
Originator positions
2,539
-
795
-
2,771
-
1,265
-
On-balance sheet exposures
2,531
-
792
-
2,762
-
1,260
-
Off-balance sheet exposure and derivatives
8
-
3
-
9
-
5
-
Sponsor positions
9,725
-
1,329
-
8,766
-
1,382
-
On-balance sheet exposures
0
-
0
-
0
-
0
-
Off-balance sheet exposure and derivatives
9,725
-
1,329
-
8,766
-
1,382
-
TOTAL
18,462
0
4,098
1
18,038
0
4,878
2
-
8.1 Market risk policy
Risk policies governing market transactions are defined by the Risk divisions of institutions with trading activities. These policies are based on a qualitative and forward-looking perspective.
-
8.2 Market risk management
The Risk division works in the areas of risk measurement, definition and oversight of limits, and supervision of market risks. It is tasked with the following duties:
•establishing the principles of market risk measurement, which are then validated by the various appropriate Risk Committees;
•producing risk measurements, including those corresponding to operational market limits, or ensuring that they are produced as part of the risk management process;
•determining policies for adjusting values or delegating them to the Risk divisions of the relevant institutions and centralizing the information;
•examining the limit framework and setting limits (global caps and, where necessary, operational limits) adopted by the various appropriate Risk Committees, as part of the comprehensive risk management process;
•examining the list of authorized products for the relevant institutions and the conditions to be observed, and submitting them for approval to the appropriate Market Risk Committee;
•examining requests for investments in financial products, or in new capital market products or activities, by the relevant banking institutions;
•harmonizing processes used to manage trading book allocations and medium- to long-term portfolios of the Banque Populaire and Caisse d’Epargne networks (indicators, definition of indicator limits, oversight and control process, and reporting standards).
•consolidating the mapping of Group market risks and contributing to the macro-risk mapping of Group and institution risks;
•performing or overseeing daily supervision of positions and risks with respect to allocated limits (overall and operational limits) and established resilience thresholds, organizing the decision-making framework for limit breaches and performing or overseeing permanent supervision of limit breaches and their resolution;
In addition, the Risk division coordinates the market risk management process by organizing national market risk days, regular audio sessions or theme-based working groups.
Following the Covid-19 health crisis, the Risk division reviewed the stress tests applied to the Group’s non-operating real estate portfolio.
Risk monitoring
The Risk division is responsible for monitoring the risks associated with all Groupe BPCE capital market activities, subject to regular review by the Group Market Risk Committee.
Within the scope of the trading book, market risk is monitored daily by measuring Group Value at Risk (VaR) and performing global and historical stress tests. The proprietary VaR calculation system developed by Natixis is used by the Group. This system provides a tool for the measurement, monitoring and control of market risk at the consolidated level and for each institution, on a daily basis and taking account of correlations between the various portfolios. There are certain distinctive characteristics of Groupe BPCE that must be considered, in particular:
•for Natixis: given the size of its capital markets business, Natixis’ risk management system is specifically tailored to this entity;
•for the Banque Populaire network: only BRED Banque Populaire has a capital markets business. It monitors the financial transactions carried out by the Banque Populaire network trading floor and Finance division daily, using 99% 1-day Value at Risk, sensitivity, volume and stress scenario indicators;
•for Banque Palatine: daily monitoring of trading book activities is based on the Risk division’s supervision of 99% 1-day Value at Risk, stress tests and compliance with regulatory limits.
All limits (operational indicators, VaR, and stress tests) are monitored daily by each institution’s Risk division. Any limit breaches must be reported and, where applicable, are subject to a Management decision concerning the position in question (close, hedge, hold, etc.).
These supervisory mechanisms also have operational limits and resilience thresholds that determine the Group’s risk appetite for trading operations.
Banking book risk is supervised and monitored by activity: liquidity reserves, illiquid assets (private equity, non-operational real estate), securitizations and liquid assets excluding liquidity reserves. Liquidity reserves and liquid assets excluding liquidity reserves are monitored monthly, mainly via stress test indicators. Illiquid assets and securitizations are monitored quarterly.
-
8.3 Market risk measurement methods
From a prudential standpoint, Groupe BPCE uses the standardized approach to measure market risk. The risk monitoring system relies on three types of indicators used to manage activity, on an overall basis and by similar activity, by focusing on directly observable criteria, including:
•sensitivity to variations in the underlying instrument, variations in volatility or to correlation, nominal amounts, and diversification indicators. The limits corresponding to these qualitative and quantitative operational indicators thus complement the VaR limits and stress tests;
•stress tests to measure potential losses on portfolios in extreme market conditions. The Group system relies on comprehensive stress tests and specific stress tests for each activity.
Special reports on each business line are sent daily to the relevant operational staff and managers. BPCE’s Risk division also provides a weekly report summarizing all of the Group’s market risk, with a detailed breakdown for Natixis, BRED Banque Populaire and Banque Palatine.
In addition, for Natixis, global market risk reports are sent to the central institution on a daily basis. The latter produces a weekly summary of market risk indicators and results for the Group’s executive management.
Finally, a global review of Groupe BPCE’s consolidated market risks (covering VaR measures and hypothetical/historic stress scenarios) is presented to the Group Market Risk Committee, in addition to risk reports prepared for the entities.
In response to the Revised Pillar III Disclosure Requirements (Table MRB: Qualitative disclosures for banks using the Internal Models Approach), the main characteristics of the various models used for market risk are presented in the Natixis Registration Document.
Sensitivities
-
8.4 Quantitative disclosures
Groupe BPCE VaR
in millions of euros
Monte-Carlo VaR 99%
12/31/2021
average
min
max
12/31/2020
Equity risk
6.3
6.9
2.3
14
10.9
Foreign exchange risk
2.9
2
0.3
11
3
Commodity risk
0.8
1.3
0.2
2.9
1.2
Credit risk
0.9
1.5
0.2
3.6
1.7
Interest rate risk
4.7
3
1.7
5.7
3.4
TOTAL
15.6
0
0
0
20.2
Compensation effect
(7.3)
0
0
0
(8.1)
Consolidated VaR
8.3
8.1
4.9
16.8
12.1
-
8.5 Detailed quantitative disclosures
The detailed quantitative disclosures relating to market risk in the following tables enhance the information in the previous section in respect of Pillar III.
Breakdown of risk-weighted assets with respect to market risks by approach
in millions of euros
12/31/2021
12/31/2020
RWAs
RWAs
Outright products
Interest rate risk (general and specific)
2,611
1,833
Equity risk (general and specific)
747
395
Exchange rate risk
3,604
3,364
Commodity risk
1,666
1,121
Options
Simplified approach
-
-
Delta-plus approach
172
153
Scenario approach
257
240
Securitization
514
187
TOTAL
9,571
7,292
-
9.1 Governance and structure
Like all credit institutions, Groupe BPCE is exposed to structural liquidity, interest rate and foreign exchange risks.
These risks are closely monitored by the Group and its institutions to secure immediate and future income, balance the balance sheets and promote the Group’s development.
Groupe BPCE’s Audit Committee and Supervisory Board are consulted on general ALM policy and are informed of major decisions taken regarding liquidity, interest rate and foreign exchange risk management. The implementation of the chosen policy is delegated to the Group Asset and Liability Management Committee.
Each year, Groupe BPCE’s Supervisory Board validates the main lines of the ALM policy, i.e. the principles of market risk measurements and levels of risk tolerance. It also reviews the risk limit system each year.
Each quarter, Groupe BPCE’s Audit Committee is informed of the Group’s position through management reports containing the main risk indicators.
The Group Asset/Liability Management Committee, chaired by the Chairman of the BPCE Management Board, is responsible for the operational implementation of the defined policy. It meets every two months and its main duties are as follows:
•examine the consolidated view of the structural risks of the Group and its various entities, as well as changes in the balance sheet;
•define the structural risk limits of the Group and the liquidity pools and monitor them (with approval by the DRCCP);
•approve the investment and allocation criteria as well as the desired overall profile of the Group’s liquidity reserve.
The structural liquidity, interest rate and foreign exchange risk management policy is also jointly implemented by the Asset/Liability Management division (oversight of funding plan implementation, management of liquidity reserves, cash management, calculation and monitoring of the various risk indicators) and the Risk division (validation of the control framework, validation of models and agreements, controls of compliance with rules and limits). The Group Financial Management division and the Group Risk division are responsible for adapting this framework to their respective functions.
The adaptation of the operational management framework within each institution is subject to validation by the Board of Directors, the Steering Board and/or the Supervisory Board. Each institution has a special operational committee that oversees implementation of the funding strategy, Asset/Liability management and management of liquidity, interest rate and foreign exchange risks for the institution, in line with rules and limits set at Group level. The Banque Populaire and Caisse d’Epargne networks implement the risk management system using a shared Asset/Liability management tool.
-
9.2 Liquidity risk management policy
Liquidity risk is defined as the risk of the Group being unable to meet its commitments or to settle or offset a position, due to market conditions factors specific to Groupe BPCE, within a specified period and at a reasonable cost. It reflects the risk of not being able to meet net cash outflows over short- to long-term horizons.
Liquidity risk is likely to materialize in the event of a decline in sources of financing that could be caused by a massive withdrawal of customer deposits or by problems in executing the annual financing plan following a widespread crisis of confidence on the markets or events specific to the Group. It could also be triggered by an increase in financing requirements due to an increase in drawdowns on loan commitments, an increase in margin calls or a higher collateral requirement.
All liquidity risk factors are accurately mapped, updated annually and presented to the Group Asset/Liability Management Committee. This mapping identifies the various risks as well as their level of materiality, assessed according to various criteria shared between the Asset/Liability Management and Risk divisions.
Objectives and policies
The liquidity management policy aims mainly to refinance all of the Group’s business lines in an optimal and sustainable manner.
•ensure a sustainable refinancing plan at the best possible price, making it possible to finance the Group’s various activities over a period consistent with the assets created;
•distribute this liquidity between the various business lines and monitor its use and changes in liquidity levels;
•comply with regulatory ratios and internal constraints resulting in particular from stress tests guaranteeing the sustainability of the Group’s business model refinancing plan, even in the event of a crisis.
•centralized funding management aimed primarily at supervising the use of short-term funding, spreading out the maturity dates of medium- and long-term funds and diversifying sources of liquidity;
•supervision of each business line’s liquidity consumption, predominantly by maintaining a balance between growth in the credit segment and customer deposit inflows;
-
9.3 Quantitative disclosures
At December 31, 2021, liquidity reserves covered 247% of the short-term funding and short-term maturities of MLT debt (€133 billion at December 31, 2021) compared to 246% at December 31, 2020 (ST and MLT maturities of €125 billion).
The change in the liquidity reserve over the course of 2021 reflects the Group’s liquidity management policy with the aim of reducing its level of market refinancing in a general context of abundant liquidity while maintaining a high level of coverage of its liquidity risk.
in billions of euros
01/01/2022 to 12/31/2022
01/01/2023 to 12/31/2025
01/01/2026 to 12/31/2029
Liquidity gap
103.5
54.2
41.2
The projected liquidity position shows a structural liquidity surplus over the analysis horizon, with an increase of €18.5 billion, within one year, compared to the end of 2020.
This change is linked to the increase in net financial resources (+€29 billion, including a portion related to TLTRO 3 transactions) and customer deposits (+€34 billion). This increase was offset by the increase in customer loans (+€51 billion).
Customer loan-to-deposit ratio
At December 31, 2021, the Group’s customer loan-to-deposit ratio(1) remains at 120%, as at December 31, 2020.
in millions of euros
Less than
1 month
From
1 month to
3 months
From
3 months
to 1 year
From
1 year to
5 years
More than
5 years
No
specified
Total on
12/31/2021
Cash and amounts due from central banks
54,203
131,942
172
186,317
Financial assets at fair value through profit or loss
198,919
198,919
Financial assets at fair value through other comprehensive income
2,064
821
3,865
18,977
17,805
5,066
48,598
Hedging derivatives
7,163
7,163
Securities at amortized cost
659
361
1,211
8,177
12,139
2,439
24,986
Loans and advances to banks at amortized cost
83,700
4,898
3,942
806
226
568
94,140
Loans and advances to customers at amortized cost
41,455
23,244
68,270
264,909
374,421
8,798
781,097
Revaluation differences on interest rate risk-hedged portfolios, assets
5,394
5,394
FINANCIAL ASSETS BY MATURITY
182,081
161,266
77,288
292,869
404,591
228,519
1,346,614
Central banks
6
6
Financial liabilities at fair value through profit or loss
7,168
100
389
1,333
14,728
168,050
191,768
Hedging derivatives
12,521
12,521
Debt securities
28,834
30,254
37,864
73,343
63,143
3,981
237,419
Amounts due to banks and similar
26,350
9,825
5,683
101,071
9,598
2,864
155,391
Amounts due to customers
553,168
15,506
20,457
63,401
10,019
2,766
665,317
Subordinated debt
591
11
3
9,895
7,589
901
18,990
Revaluation difference on interest rate risk-hedged portfolios, assets
184
184
FINANCIAL LIABILITIES BY MATURITY
616,111
55,702
64,396
249,043
105,077
191,267
1,281,596
Loan commitments given to banks
8
98
378
816
128
1,428
Loan commitments given to customers
33,523
7,730
24,526
61,324
21,746
5,559
154,408
TOTAL LOAN COMMITMENTS GIVEN
33,531
7,828
24,904
62,141
21,874
5,559
155,837
Guarantee commitments given to banks
1,571
704
1,375
196
1,891
2,706
8,443
Guarantee commitments given to customers
2,818
5,004
5,998
17,185
9,051
2,675
42,731
TOTAL GUARANTEE COMMITMENTS GIVEN
4,389
5,708
7,372
17,381
10,942
5,381
51,173
Financial instruments marked to market on the income statement and held in the trading book, variable-income available-for-sale financial assets, non-performing loans, hedging derivatives and revaluation differences on interest rate risk-hedged portfolios are placed in the “No fixed maturity” column. These financial instruments are:
•or held for sale or redeemed at an indeterminable date (particularly where they have no contractual maturity);
-
9.4 Management of structural interest rate risk
Objectives and policies
Structural interest rate risk (or overall interest rate risk) is defined as the risk incurred in the event of a change in interest rates due to all balance sheet and off-balance sheet transactions, except for – if applicable – transactions subject to market risks. Structural interest rate risk is an intrinsic component of the business and profitability of credit institutions.
The objective of the Group’s interest rate risk management system is to monitor each institution’s maturity transformation level in order to contribute to the growth of the Group and the business lines while evening out the impact of any unfavorable interest rate changes on the value of the Group’s banking books and future income.
-
9.5 Management of structural exchange rate risk
Structural foreign exchange risk is defined as the risk of a realized or unrealized loss due to an unfavorable fluctuation in foreign currency exchange rates. The management system distinguishes between the structural exchange risk policy and the management of operational foreign exchange risk.
Foreign exchange risk oversight and management system
For Groupe BPCE (excluding Natixis), foreign exchange risk is monitored using regulatory indicators (measuring corresponding capital adequacy requirements by entity). The residual foreign exchange positions held by the Group (excluding Natixis) are not material because virtually all foreign currency assets and liabilities are match-funded in the same currency.
As regards international trade financing transactions, risk-taking is limited to counterparties in countries with freely-translatable currencies, provided that translation can be technically carried out by the technically managed by the entity’s information system.
Natixis’ structural exchange rate positions on net investments in foreign operations funded with currency forwards are tracked on a quarterly basis by its Asset/Liability Management Committee in terms of sensitivity as well as solvency. The resulting risk indicators are submitted to the Group Asset/Liability Management Committee on a quarterly basis.
-
9.6 Detailed quantitative disclosures on liquidity risk
The detailed quantitative disclosures on liquidity risk in the following tables enhance the information in the previous section under Pillar III.
Groupe BPCE cash balance sheet
The cash balance sheet of Groupe BPCE excluding the contribution of the SCF shows the main items of the balance sheet by identifying in particular:
•business financing requirements (customer loans, centralization of regulated passbook savings accounts and the Group’s tangible and intangible assets) for a total of €833 billion at December 31, 2021, up €39 billion year-on-year mainly due to the increase in loans outstanding (real estate loans, SGL, etc.);
•the Group’s stable resources consisting of customer deposits, medium and long-term resources, and equity and similar assets, for a total of €999 billion as of December 31, 2021, up €65 billion over one year, mainly due to the increase in customer deposits and the use of TLTRO3 operations;
•the €166 billion surplus reflects the surplus of customer deposits and medium- and long-term financial resources over the financing needs of the customer business. It is mainly invested in liquid assets to contribute to the liquidity reserve;
•short-term resources invested mainly in liquid assets (central bank deposits, interbank assets, debt securities).
The regulatory 30-day liquidity ratio measures the ratio between the liquidity buffer (HQLA – High Quality Liquid Assets) and the expected net cash outflows over a 30-day period. Since January 1, 2018, the minimum requirement level has been set at 100%.
The Group’s LCR stood at an average monthly rate of 161% for the year 2021, i.e. a liquidity surplus of €86 billion in December 2021, compared with levels of 156% and €74 billion respectively in December 2020.
(1)
Balance of stable resources +€166 billion as of December 31, 2021 = (MLT resources €240 billion + customer deposits €678 billion + capital excluding subordinated debt €81 billion - (customer loans €735 billion + passbook savings centralization €77 billion + fixed assets €18 billion + miscellaneous €4 billion).
(3)
Net position of accrual accounts and other liabilities and refinancing transactions with the SCF : €0 billion on the liabilities side for the Group excluding SCF.
(4)
Of which €18 billion, excluding accrued interest, of market MLT resources at the end of 2021 with a residual maturity date of less than or equal to one year.
(5)
Of which €0.2 billion (excluding accrued interest) of BPCE's preferred senior bond issues (with €0.1 billion maturing in one year or less) and €2.2 billion (excluding accrued interest) of BPCE's Tier 2 issues (with no issues maturing in one year or less) marketed in our networks.
in millions of euros
Total unweighted value (average)
Total weighted value (average)
Quarter ending on (Month DD YYYY)
03 31 2021
06 30 2021
09 30 2021
12 31 2021
03 31 2021
06 30 2021
09 30 2021
12 31 2021
Number of data points used in the calculation of averages
12
12
12
12
12
12
12
12
HIGH QUALITY LIQUID ASSETS (HQLA)
Total High Quality Liquid Assets (HQLA)
222,146
223,352
225,607
229,176
CASH OUTFLOWS
Retail deposits and deposits from small business customers, of which:
377,968
369,262
370,673
375,927
22,436
21,949
21,990
22,317
Stable deposits
293,674
283,468
283,093
287,013
14,728
14,221
14,197
14,383
Less stable deposits
76,965
77,227
77,876
79,292
7,707
7,727
7,792
7,934
Unsecured deposits of corporates and financial institutions, including
192,558
191,094
192,985
196,412
100,308
98,136
98,753
100,855
Operational deposits
51,468
51,136
52,187
52,503
12,166
11,984
12,161
12,210
Non-operational deposits
123,808
123,686
125,123
128,212
70,860
69,881
70,916
72,949
Unsecured debt
17,282
16,271
15,676
15,697
17,282
16,271
15,676
15,697
Secured deposits of corporates and financial institutions
22,596
24,062
25,318
25,886
Additional outflows, including:
109,292
110,235
109,805
110,128
28,775
29,465
29,111
28,529
Outflows related to derivative exposures and other collateral requirements
18,481
18,099
17,103
16,095
14,394
14,196
13,295
12,073
Outflows related to loss of funding on debt products
0
0
0
0
0
0
0
0
Credit and liquidity facilities
90,812
92,137
92,701
94,033
14,382
15,269
15,817
16,456
Other contractual funding obligations
24,142
24,315
25,453
26,927
22,354
22,582
23,853
25,511
Other contingent funding obligations
95,077
100,008
106,876
113,821
11,628
11,791
12,208
12,562
Total cash outflows
208,098
207,984
211,232
215,659
CASH INFLOWS
Transactions collateralized by securities (i.e. reverse repos)
96,630
97,632
97,402
96,854
14,639
14,272
13,790
12,949
Cash inflows from loans
49,392
31,732
26,975
28,200
20,934
19,745
20,234
21,272
Other cash inflows
47,839
50,280
51,966
52,534
35,536
37,272
38,256
38,582
(Difference between total weighted cash inflows and total weighted cash outflows resulting from transactions in third countries subject to transfer restrictions or denominated in non-convertible currencies).
0
0
0
0
(Surplus inflows from a related specialized credit institution)
0
0
0
0
TOTAL CASH INFLOWS
193,862
179,645
176,343
177,587
71,108
71,289
72,281
72,804
Cash inflows fully exempt from cap
0
0
0
0
0
0
0
0
Cash inflows subject to the 90% cap
0
0
0
0
0
0
0
0
Cash inflows subject to the 75% cap
160,239
143,949
141,008
144,213
71,108
71,289
72,281
72,804
TOTAL ADJUSTED VALUE
TOTAL HQLA
222,146
223,352
225,607
229,176
TOTAL NET CASH OUTFLOWS
136,990
136,696
138,952
142,855
SHORT-TERM LIQUIDITY RATIO (IN %)
163%
164%
163%
161%
The Group’s liquid assets, after taking into account regulatory haircuts, amounted to €229 billion and consist largely of central bank deposits and sovereign securities.
Gross cash outflows amounted to €216 billion and have increased since December 31, 2020, in line with the growth in customer deposits, both Retail and Wholesale. On the other hand, gross cash inflows amounted to €73 billion and were stable compared to December 2020. In net position, cash outflows thus amounted to €143 billion, an increase of €11 billion compared to December 2020.
The liquid asset position is managed in such a way as to retain a sufficient amount of excess liquidity to cover any volatility in the evolution of the LCR ratio and also to protect the Group against a short-term liquidity crisis that may prevent the Group from renewing all or part of its short-term issues. In this context, the excess liquidity will be absorbed first without impacting the Group’s core activities.
The net stable funding ratio (NSFR) corresponds to the amount of available stable funding (i.e. own funds and the proportion of liabilities assumed to be reliable over the time horizon taken into account for the purposes of the NSFR, i.e. up to one year) compared to the required stable funding. This ratio is restrictive, with a minimum requirement level of 100% since June 28, 2021.
The Group’s NSFR stood at 115.7% as of December 31, 2021, i.e. a liquidity surplus of €118.6 billion.
in millions of euros
12/31/2021
Unweighted value by residual maturity
Weighted
value
No maturity
< 6 months
6 months to
< 1 year
≥ 1 year
AVAILABLE STABLE FUNDING (ASF) ITEMS
Capital items and instruments
77,859
0
0
12,951
90,810
Capital
77,859
0
0
12,951
90,810
Other capital instruments
0
0
0
0
Retail deposits
385,390
621
13,923
376,598
Stable deposits
304,947
354
3,277
293,313
Less stable deposits
80,443
268
10,646
83,286
Wholesale funding:
428,483
29,738
255,944
364,447
Operational deposits
87,674
0
0
3,535
Other wholesale funding
340,808
29,738
255,944
360,912
Interdependent liabilities
6,638
0
69,672
0
Other liabilities:
453
25,165
1,116
42,910
43,468
NSFR derivative liabilities
453
All other liabilities and capital instruments not included in the above categories
25,165
1,116
42,910
43,468
Total available stable funding (ASF)
875,323
REQUIRED STABLE FUNDING (RSF) ITEMS
Total High Quality Liquid Assets (HQLA)
22,608
Assets encumbered for more than one year in cover pool
1,452
1,585
40,950
37,389
Deposits held at other financial institutions for operational purposes
325
0
0
163
Performing loans and securities:
121,074
45,875
689,551
611,739
Performing securities financing transactions with financial customers collateralized by Level 1 HQLA subject to 0% haircut
14,388
957
2,654
3,714
Performing securities financing transactions with financial customer collateralized by other assets and loans and advances to financial institutions
39,476
5,349
15,846
20,804
Performing loans to non-financial corporate clients, loans to retail and small business customers, and loans to sovereigns, and PSEs, of which:
49,053
29,021
409,473
544,983
With a risk weight of less than or equal to 35% under the Basel II Standardized Approach for credit risk
7,450
6,867
152,178
274,816
Performing residential mortgages, of which:
10,177
9,368
214,660
0
With a risk weight of less than or equal to 35% under the Basel II Standardized Approach for credit risk
10,177
9,368
214,660
0
Other loans and securities that are not in default and do not qualify as HQLA, including exchange-traded equities and trade finance on-balance sheet products
7,980
1,180
46,919
42,237
Interdependent assets
6,638
0
69,672
0
in millions of euros
12/31/2021
Unweighted value by residual maturity
Weighted
value
No maturity
< 6 months
6 months to
< 1 year
≥ 1 year
Other assets:
0
43,677
1,297
73,230
79,029
Physical traded commodities
0
0
Assets posted as initial margin for derivative contracts and contributions to default funds of CCPs
57
0
5,086
4,372
NSFR derivative assets
3,036
2,583
NSFR derivative liabilities before deduction of variation margin posted
24,623
1,231
All other assets not included in the above categories
15,962
1,297
68,143
70,844
Off-balance sheet items
117,757
0
339,179
5,742
Total RSF
756,669
Net Stable Funding Ratio (%)
115.7%
In addition to the structural effects – combining deposit collection and new loans – which result in the production of a natural surplus of NSFR for Groupe BPCE, cyclical effects including additional customer and wholesale deposits and use of the TLTRO III explain the very large surplus posted at December 31, 2021.
The amount of available stable funding for Groupe BPCE thus amounts to €875.3 billion and mainly consists of:
•customer deposits (€376 billion), including a significant portion of deposits deemed stable, and growing steadily since June 2021 reflecting the high levels of savings recorded over the period, and
•wholesale financing (€364 billion), which includes corporate deposits, also up in the current context, compared to June 2021. This funding additionally includes the use of the TLTRO III, which represents €97 billion in long-term financing (more than one year) as of December 31, 2021.
The amount of required stable funding stands at €756.7 billion, the result of a significant level of performing loans and securities whose impact was €611.7 billion.
in millions of euros
12/31/2021
Carrying amount of
encumbered assets
Fair value of
encumbered assets
Carrying amount of
unencumbered assets
Fair value of
unencumbered assets
of which
notionally
eligible
EHQLA
and HQLA
of which
notionally
eligible
EHQLA
and HQLA
of which
EHQLA
and HQLA
of which
EHQLA
and HQLA
Assets of the reporting institution
334,073
72,938
1,036,947
28,255
Equity instruments
28,321
25,474
28,321
25,474
22,108
5,824
18,098
5,848
Debt securities
83,384
47,619
82,921
47,564
24,026
23,188
37,637
31,798
of which: covered bonds
368
185
372
185
1,256
1,073
1,279
1,098
of which: securitizations
19,429
0
19,101
0
0
0
0
0
of which: issued by general governments
44,263
41,815
44,140
41,752
17,740
17,032
20,156
19,626
of which: issued by financial corporations
14,630
4,033
14,562
4,034
4,959
4,959
5,176
5,140
of which: issued by non-financial corporations
3,009
1,648
3,011
1,654
0
0
10,575
5,949
Other assets
221,369
0
990,812
0
in millions of euros
12/31/2020
Carrying amount of
encumbered assets
Fair value of
encumbered assets
Carrying amount of
unencumbered assets
Fair value of
unencumbered assets
of which
notionally
eligible
EHQLA
and HQLA
of which
notionally
eligible
EHQLA
and HQLA
of which
EHQLA
and HQLA
of which
EHQLA
and HQLA
Assets of the reporting institution
283,847
51,027
1,029,545
47,179
Equity instruments
15,350
14,561
0
0
16,855
14,561
0
0
Debt securities
75,993
36,466
74,835
35,417
36,279
32,810
31,981
11,429
of which: covered bonds
734
391
716
391
1,398
391
1,349
1,310
of which: securitizations
19,177
0
18,958
0
1,456
0
0
0
of which: issued by general governments
40,356
34,250
39,277
33,198
29,964
29,742
18,818
0
of which: issued by financial corporations
11,835
239
11,766
240
2,756
239
1,896
1,425
of which: issued by non-financial corporations
2,678
1,673
2,684
1,677
0
0
9,635
1,896
Other assets
193,161
0
831,337
0
in millions of euros
12/31/2021
Fair value of encumbered collateral
received or own debt securities
issued
Unencumbered
Fair value of collateral received or
own debt securities issued that may
be encumbered
of which
notionally
eligible EHQLA
and HQLA
of which EHQLA
and HQLA
Collateral received by the reporting institution
132,900
96,218
94,895
48,445
Loans on demand
0
0
0
0
Equity instruments
39,703
17,519
26,108
4,963
Debt securities
94,574
79,976
47,459
43,482
of which: covered bonds
581
366
1,484
1,484
of which: securitizations
4,652
0
0
0
of which: issued by general governments
73,051
70,843
34,697
34,300
of which: issued by financial corporations
13,058
6,143
6,547
6,547
of which: issued by non-financial corporations
1,341
408
4,707
1,485
Loans and advances other than loans on demand
0
0
20,710
0
Other collateral received
0
0
0
0
Own debt securities issued other than own covered bonds or securitizations
0
0
0
0
Own covered bonds and asset-backed securities issued and not yet pledged
400
0
TOTAL ASSETS, COLLATERAL RECEIVED AND OWN DEBT SECURITIES ISSUED
464,722
170,859
in millions of euros
12/31/2020
Fair value of encumbered collateral
received or own debt securities
issued
Unencumbered
Fair value of collateral received or
own debt securities issued that may
be encumbered
of which
notionally
eligible EHQLA
and HQLA
of which EHQLA
and HQLA
Collateral received by the reporting institution
139,345
96,989
90,822
54,830
Loans on demand
0
0
0
0
Equity instruments
37,880
20,905
25,934
5,291
Debt securities
101,417
75,990
49,539
49,539
of which: covered bonds
1,305
657
1,803
1,709
of which: securitizations
8,357
0
0
0
of which: issued by general governments
85,108
74,860
42,217
42,217
of which: issued by financial corporations
5,500
146
952
906
of which: issued by non-financial corporations
1,176
565
4,154
1,882
Loans and advances other than loans on demand
0
0
15,996
0
Other collateral received
0
0
0
0
Own debt securities issued other than own covered bonds or securitizations
0
0
0
0
Own covered bonds and asset-backed securities issued and not yet pledged
435
0
TOTAL ASSETS, COLLATERAL RECEIVED AND OWN DEBT SECURITIES ISSUED
424,225
149,038
An asset or a guarantee is encumbered when it is capitalized as a guarantee, collateral or enhancement of an institution’s transaction.
At the closing date of December 31, 2021, the ratio of encumbered assets to assets on the Group’s balance sheet was 29.2%, up by 0.5% compared to the ratio at December 31, 2020 (28.7%).
The Group uses its assets and collateral to obtain financing on favorable terms and to carry out repurchase agreements and derivative transactions.
–€91.5 billion in loans and advances to guarantee covered bonds issued by BPCE SFH, SCF and Natixis Pfandbriefbank. The over-collateralization rates applied are respectively 105% for BPCE SFH/SCF and 102% for Natixis Pfandbriefbank,
–€143.4 billion in advances and securities mobilized at the Central Bank to carry out TLTRO transactions. The Group’s central institution manages the 3G pooling system on behalf of the institutions,
-
10.1 Legal and arbitration proceedings – BPCE
Check imaging exchange (échange image chèques) commissions
Marketplace antitrust case initially involving Banques Populaires Participations (BP Participations) and Caisses d’Epargne Participations (CE Participations) and BPCE since it merged with and absorbed BP Participations and CE Participations.
On March 18, 2008, BFBP and CNCE received, as was the case for other banks on the marketplace, a notice of grievance from the French anti-trust authority. The banks are accused of having established and mutually agreed on the amount of the check imaging exchange commission, as well as related check commissions.
The anti-trust authority delivered its decision on September 20, 2010 to fine the banks found guilty (€90.9 million for BPCE). These banks (except for the Banque de France) lodged an appeal.
On February 23, 2012, the Paris Court of Appeals overruled the anti-trust authority’s decision and the €90.9 million fine paid by BPCE was refunded.
On the referral of the anti-trust authority, on April 14, 2015, the Court of Cassation overturned the Court of Appeals’ 2012 ruling due to breach of procedure. The banks were once again required to pay the fine.
BPCE, along with the other accused banks, referred this ruling to the Paris Court of Appeals, requesting that it purge this breach of procedure and uphold its 2012 decision, ensuring that BPCE will ultimately be reimbursed.
The Second Court of Appeals ruled on December 21, 2017 and confirmed the 2010 analysis of the anti-trust authority, thus contradicting the initial decision by the Paris Court of Appeals in 2012.
The Court considered that the introduction of the EIC commission and CSCs constitute anti-competitive practice in its nature and upheld the conviction to pay the fine set by the ADLC. However, the Court reduced the amount of Caisse d’Epargne’s fine by €4.07 million, by canceling the 10% increase to the fine imposed by ADLC on certain banks for their key roles in negotiations. BPCE, standing in for CE Participations, should retrieve this amount of €4.07 million from the Treasury.
On January 29, 2020, the Court of Cassation rendered its verdict and overturned the appeal for lack of legal grounds on the demonstration of collusion. The ruling referred the case back to the Court of Appeal, with the banks returning to their position subsequent to the ruling of the Autorité de la concurrence (ADLC), the French competition authority.
The Court of Appeal of Reference issued its decision on December 2, 2021 and reformed almost the entirety of the decision of the Competition Authority of 2010 sanctioning 11 banks and canceled the €384.9 million of fines imposed on the banks.
This ruling on remand after a second cassation (ruling of January 29, 2020), allowed BPCE SA to recover on December 30, 2021 the total sum of €90,962,647.35 (corresponding to the €38.09 million for the BPs and €48.74 million for the CEs), as well as the additional €4 million paid by BPCE SA to the French Treasury in April 2020 (corresponding to the reimbursement of the reduction in the CEs’ fine pronounced by the appeal ruling of December 21, 2017).
In its decision, the Court of Appeal found that the introduction, at the time of the transition to dematerialization of check processing, of interbank commissions for the exchange of check images (CEIC) and for related services on the cancellation of wrongly cleared transactions (AOCT), did not distort competition either by its object or by its effects. As to the anti-competitive object of the agreement, according to the Court, in the absence of experience with this type of compensatory and dissuasive fee, it cannot be considered that by their very nature they are sufficiently harmful to competition to be qualified as a restriction of competition by object. As to the effects of the agreement, the Court considers that it has not been established that CEIC has had any real effects on the prices of the check remittance service, and therefore, that it has effectively constrained the banks in their pricing policy. The Paris Court of Appeal therefore concluded that none of the grievances notified to the Banks were well-founded and, consequently, ruled that it had not been established that the introduction, by the agreement of February 3, 2000, of the disputed interbank commissions and the collection of these commissions as of January 1, 2002 infringed the provisions of Article 101 TFEU and Article L. 420-1 of the French Commercial Code.
-
10.2 Legal and arbitration proceedings – Natixis
Madoff fraud
The Madoff outstandings are estimated at €319.3 million inequivalent value at December 31, 2021, fully provisioned at this date,compared to €503.4 million at December 31, 2020, following theconfirmation of the liquidation of certain assets deposited in thename of Natixis and fully provisioned. The effective impact of thisexposure will depend on both the extent of recovery of downinvested for Natixis and the outcome of the measures taken by thebank, notably in terms of legal proceedings. Furthermore, in 2011 adispute emerged over the application of the insurance policy forprofessional liability in this case, which had been taken out withsuccessive insurers for a total amount of €123 million. InNovember 2016, the Paris Court of Appeal vindicated theCommercial Court’s prior ruling that primary insurers were liable tocover the losses incurred by Natixis due to the Madoff fraud, up tothe amount for which the bank was insured. On September 19, 2018,the Court of Cassation subsequently annulled the judgment underappeal and referred the case back to the Paris Court of Appeal with adifferently constituted bench. On September 24, 2019, the Court ruled against Natixis, overturning the ruling by the Commercial Courtof Paris. Natixis filed an appeal with the Cour de Cassation inDecember 2019. The Court of Cassation dismissed the appeal onNovember 4, 2021, so that the judgment of the Paris Court ofAppeals of September 24, 2019, unfavorable to Natixis, became finaland irrevocable.
Irving H. Picard, the court-appointed trustee for Bernard L. Madoff Investment Securities LLC (BMIS), submitted a restitution claim concerning the liquidation of amounts received prior to the discovery of the fraud through a complaint filed with the United States Bankruptcy Court for the Southern District of New York against several banking institutions, including a $400 million claim against Natixis. Natixis denies the allegations made against it and has taken the necessary steps to defend its position and protect its rights. Natixis has launched appeals, including a motion to dismiss the case on a preliminary basis, or prior to any ruling on the merits, and a motion to withdraw the reference to transfer certain matters to the United States district court. These proceedings have been subject to numerous rulings and appeals and are still ongoing. A November 2016 ruling by the bankruptcy court dismissed a number of restitution claims initiated by the trustee on the grounds of extraterritoriality. In September 2017, the Second Circuit Court granted the BMIS liquidator and the defendants the right to appeal the bankruptcy court’s ruling on the grounds of extraterritoriality directly through the Second Circuit, thereby avoiding the need to file an intermediary appeal with the district court. In February 2019, the Court of Appeals for the Second Circuit overturned the bankruptcy court’s extraterritoriality ruling. In August 2019, Natixisjoined the group of defendants that filed a request for permission toappeal the Second Circuit Court’s ruling before the Supreme Court.In June 2020, the Supreme Court refused to hear the case. The courtof the Second Circuit clarified the concept of “good faith” by deciding(i) that it is determined according to the standard of “inquiry notice” which is less favorable to the defendants, and (ii) that the burden ofproof lies not with the liquidator of BMIS but with the defendants. These preliminary points having now been decided, the proceedings are continuing on the merits.
Furthermore, the liquidators of Fairfield Sentry Limited and Fairfield Sigma Limited have initiated a large number of proceedings against investors having previously received payments from these funds for redemptions of shares (over 200 proceedings have been filed in New York). Some Natixis entities have been named as defendants in some of these proceedings. Natixis deems these proceedings to be entirely unfounded and is vigorously defending its position. These proceedings have been suspended for several years, and in October 2016 the bankruptcy court authorized the liquidators to modify their initial claim. The defendants filed joint responses in May and June 2017. In August 2018, the bankruptcy court ruled on a motion to dismiss filed by the defendants (requesting that the case be dismissed on a preliminary basis and prior to any ruling on the merits). The judge only gave a ruling on one of the merits (that of personal jurisdiction), having found that the latter was missing from the claim made against the defendants. In December 2018, the judge ruled on the motion to dismiss, rejecting the liquidators’ common law claims (unjust enrichment, money had and received, mistaken payment and constructive trust) as well as contractual claims. However, it overturned the motion to dismiss in respect of claim founded on British Virgin Islands’ law, while reserving the right to file a plea for the application of Section 546(e) safe harbor provision. In May 2019, the liquidators appealed the bankruptcy court’s ruling before the District Court. The defendants, including Natixis, submitted on March 9, 2020 a motion to dismiss this appeal and renewed this initial motion on March 16, 2020. The bankruptcy court asked the defendants to limit the motion to dismiss to arguments that can lead to the dismissal of all the actions of the liquidators (as per Section 546 (e) of the safe harbor provision or impropriety of the initial petition). In December 2020, the bankruptcy court dismissed the action brought under the law of the British Virgin Islands, considering that the defendants, including Natixis, are covered by Section 546 (e) safe harbor. This decision, which may result in the rejection of claw back requests, is subject to appeal. The case is ongoing.
-
11 NON-COMPLIANCE AND SECURITY RISKS
In accordance with the legal and regulatory requirements mentioned above, and with the professional standards and control charters governing Groupe BPCE, the functions managing compliance risk are organized as part of the internal control system of all Groupe BPCE institutions and subsidiaries as a whole.
The Group Compliance division, which reports to the Groupe BPCE Corporate Secretary’s Office, performs its duties independently of the operational departments and the other Internal Control departments with which it collaborates. It includes the following divisions:
•Financial Security in charge of AML/CFT (Anti-Money Laundering and Combating the Financing of Terrorism), compliance with sanctions and embargo measures, anti-corruption and internal fraud;
The Compliance division, “compliance verification function” defined by the EBA and included in the Ministerial Order of Nov 3, 2014, amended by the Ministerial Order of Feb 25, 2021, is responsible for the prevention, detection, measurement and monitoring of non-compliance risks to ensure their control.
The Group Compliance division carries out its duties within the framework of business line operations.
It helps guide, motivate, manage and control the Heads of the Compliance function of the affiliates and subsidiaries. The Compliance Officers appointed within the different Group entities, including the Banque Populaire and Caisse d’Epargne banks and direct subsidiaries covered by the regulatory system of banking and financial supervision, are functionally subordinate to the Compliance division.
The Group Compliance division carries out all actions designed to strengthen the compliance of products, services and marketing processes, customer protection, compliance with ethical rules, the fight against money laundering and the financing of terrorism, the fight against market abuse, the monitoring of transactions and compliance with sanctions and embargoes. It monitors compliance risks throughout the Group. As such, it builds and revises the standards proposed for the governance of Groupe BPCE, shares best practices and coordinates working groups consisting of departmental representatives.
The dissemination of a culture of compliance risk and consideration of the legitimate interests of customers is also reflected in the training of employees in the sector and the raising of awareness of other departments, in particular the Retail Banking and Insurance division and the Digital 89C3 division.
•collaborates and validates the content for the training materials used for the Compliance function in coordination with the Group Human Resources division and the Risk Governance department of the Risk division, which coordinates the annual work schedule for the Risk and Compliance functions;
•helps train Compliance staff, mainly through specialized annual seminars (financial security, compliance, ethics, coordination of permanent compliance controls, etc.);
•coordinates the training of Directors or Heads of Compliance through a dedicated system in conjunction with the Risk culture and Compliance division of the Risk division;
•coordinates and checks the Compliance function of the Group institutions, notably by holding national compliance days, and via a system of permanent controls coordinated at Group level;
-
11.1 Compliance
Organization
The Group Compliance division has three main business lines and a cross-functional structure dedicated to the management and coordination of Compliance.
Compliance is organized as follows:
Bancassurance Compliance contributes to the prevention of risks of non-compliance with regulations and professional standards in the scope of banking and non-life insurance activities. As such, it supports the operational sectors in the development and dissemination of standards (including ACPR recommendations and EBA guidelines) and in bringing their processes into compliance with regulatory changes. Bancassurance Compliance also studies the launch of new products and participates in the validation of commercial processes and documents. Lastly, it supports and leads the Compliance department on all these subjects, and contributes to the development of training modules for Group employees.
Financial Savings Compliance and Ethics covers the compliance and ethics of financial activities as defined by the General Regulation of the Autorité des marchés financiers (AMF), the French financial markets authority, as well as the prevention of risks of non-compliance in legislative and regulatory areas in the life insurance and foresight scope. Within the aforementioned scope, this division is responsible for implementing the applicable regulations and carries out missions related in particular to the approval of products and services, the validation of commercial materials, the training of employees and the prevention of conflicts of interest, while safeguarding the customer’s interests and ensuring compliance with market rules and professional standards in banking and finance, together with internal rules and regulations on ethics. It also includes oversight of investment services and the operating procedures of investment services compliance officers (RCSIs). Since the end of 2016, investment services compliance has also included SRAB commitments (Separation and Regulation of Banking Activities) – Volcker office. It supports, coordinates and supervises the Compliance function of the Group’s entities in this area. Lastly, since 2021, it has been in charge of the Group Ethics system.
Financial Security covers activities related to anti-money laundering and counter-terrorism financing (AML/CFT), international financial sanctions, embargoes and asset freezes, and anti-corruption measures. It supports and coordinates the Compliance function on all these topics, updating the reference documentation in compliance with regulatory changes in AML/CFT, national and international financial embargoes, and anti-corruption measures.
Steering and Cross-functional Coordination covers the coordination of Compliance functions, and the centralization of relations with regulators, supervisors and the Group General Inspection in compliance matters. Drawing on the expertise of the Bancassurance Compliance and Financial Savings Compliance divisions, it manages the mapping of compliance risks, supervises reporting systems and works on cross-functional projects with the aim of improving the control of compliance risks by Groupe BPCE institutions.
1. Measurement and supervision of non-compliance risk
2. Product governance and supervision
•Non-compliance risks are analyzed, measured, monitored and managed in accordance with the Ministerial Order of November 3, 2014 (amended February 25, 2021), with the aim of:
•ensuring a permanent overview of these risks and the associated risk prevention and mitigation system, including updated identification under the new non-compliance risk-mapping exercise;
•ensuring that the largest risks, if necessary, are subject to controls and action plans aimed at supervising them more effectively.
•Groupe BPCE manages non-compliance risk by mapping out its non-compliance risks and implementing mandatory Level 1 and 2 compliance controls common to all Group retail banking institutions.
•The impact of non-compliance risk was calibrated and measured with the Group’s operational risk teams, using the methodology of operational risk tool OSIRISK, covering the risk management systems established by the institutions aimed at reducing gross risk levels.
•All new products and services, regardless of their distribution channels, as well as sales materials that fall within the Compliance function’s remit, are reviewed by Compliance beforehand. The purpose of this review is to ensure that applicable regulatory requirements are met and that targeted customers – and the public at large – receive clear and fair information. Product supervision is carefully conducted over the entire product life cycle.
•Compliance also coordinates the approval of national sales challenges, ensures that conflicts of interest are managed properly and guarantees that customer interests always come first.
•Compliance is careful to ensure that sales procedures, processes and policies guarantee that the rules of compliance and ethics are observed at all times for all customer segments, and in particular that the advice given to customers is appropriate to their needs.
In 2021, Groupe BPCE continued the program set up to strengthen the completeness and compliance of regulatory customer knowledge files throughout the business relationship. The aim of the program, in conjunction with the IS platforms, is to prevent accounts from being opened if a customer’s tax self-certification form has not been provided or regulatory records are not complete. Actions have also been taken to support Group institutions in correcting incomplete files (targeting customers, communication kits, reports). Lastly, efforts are under way to roll out a regulatory KYC update system.
-
11.2 Financial security
Organization
Financial security covers anti-money laundering and terrorist financing (AML-TF) measures as well as adherence to international sanctions targeting individuals, entities or countries, the fight against corruption and the fight against internal fraud.
BPCE’S INVOLVEMENT IN THE FIGHT AGAINST MONEY LAUNDERING AND THE FINANCING OF TERRORISM, IN COMPLIANCE WITH ECONOMIC AND FINANCIAL SANCTIONS PROGRAMS, IN THE FIGHT AGAINST CORRUPTION AND IN THE FIGHT AGAINST INTERNAL FRAUD
The prevention of these risks within Groupe BPCE is based on:
Corporate culture
Promoted across all levels of the company, corporate culture is built on:
•customer relations principles aimed at preventing risks, which are formalized and regularly communicated to the employees;
•a harmonized training system for Group employees and specific training for employees in the financial security sector.
Organizational structure
In accordance with Groupe BPCE’s charters, each institution has its own financial security unit. The Corporate Secretary’s Office has a dedicated department that oversees the sector, defines financial security policy for the entire Group, draws up and validates the various standards and procedures, and ensures that these risks are taken into account during the approval procedure for new commercial products and services by BPCE.
Specialized processes
In accordance with regulations, banks have methods for detecting unusual transactions that are specific to their risk classification. These can be used, if needed, to conduct closer analyzes and to submit the required reports to Tracfin (French financial intelligence agency) or any other competent service as promptly as possible. The Group’s risk classification system incorporates the “at-risk countries” factor when addressing money laundering, terrorism, tax fraud and bribery. The system was also reinforced with the establishment of a database and automated scenarios specifically targeting terrorist financing. With respect to compliance with restrictive measures related to international sanctions, Group institutions are equipped with screening tools that generate alerts on customers (asset freezes on certain individuals or entities) and international flows (asset freezes and countries subject to European and/or US embargoes).
Supervision of operations
Internal reports on the prevention of these risks are submitted to company directors and governing bodies, as well as to the central institution.
-
11.3 Business continuity
The management of business interruption risk is handled from a cross-business perspective. This includes the analysis of the Group’s main critical business lines, notably liquidity, payment instruments, securities, individual and corporate loans, and fiduciary activities.
Organization
The Group Business Continuity department, which reports to the Group Security division, performs its tasks independently of operational divisions. These include:
•managing the implementation of the Group Contingency and Business Continuity Plans (CBCPs) and keeping them operational;
The tools associated with the crisis management system are constantly evolving to improve their ergonomics and increase the range of associated functions.
The Covid-19 pandemic crisis management has been downgraded to standby mode. This status ensures that the decisions of the public authorities are effectively taken into account.
•risk analyzes, using a mapping tool (ArcGIS), in order to check the consistency of the systems with an acceptable level of risk;
•the validation and deployment of a Group BCP management tool for customer institutions, future beneficiaries;
•the continuation of the criticality qualification of services within the framework of the contract repository being set up;
•the formation of a working group and the proposal of a cyber resilience roadmap to better address the risk of extreme chaos;
-
11.4 Information System Security (ISS)
Organization
The Group Security department (DS-G) is in charge of Information System Security (ISS) and the fight against cybercrime. It defines, implements and develops Group ISS policies. It provides continuous and consolidated oversight of information system security, along with technical and regulatory oversight. It initiates and coordinates Group projects aimed at reducing risks in its field. It also represents Groupe BPCE vis-à-vis banking industry groups and public authorities.
Groupe BPCE has established a groupwide ISS function. It brings together the Head of Group Information System Security (RSSI-G), who leads this network, and Heads of ISS for all Group entities.
As such, the ISS managers of the parent company affiliates, direct subsidiaries and IS EIGs are functionally attached to the RSSI-G. This functional link takes the form of leadership and coordination actions. This means that:
•the Group information system security policy is adopted by individual entities in accordance with application procedures subject to validation by the Head of Group ISS;
•a report on the institutions’ compliance with the Group’s information system security policy, permanent controls, risk level, primary incidents and actions is submitted to the Group Head of IS System Security.
The project to develop an exhaustive ISS map of the Group’s information systems, including the establishments’ private information systems, continued.
•annual assessment campaign of the group’s maturity on the five pillars of the NIST framework (Detect, Identify, Protect, Respond, Recover) in order to set numerical objectives, to pilot actions and to measure their effectiveness;
–including, if possible, all Group applications in the IAM roadmap, with automatic provisioning and an overview of authorizations.
ANTI-CYBERCRIME SYSTEMS
As a result of its digital transformation, the Group’s information systems are becoming increasingly open to the outside world (cloud computing, big data, etc.). Many of its processes are gradually going digital. Employees and customers are also increasingly using the internet and interconnected technologies such as tablets, smartphones and applications on tablets and mobile devices.
Consequently, the Group’s assets are constantly more exposed to cyber threats. The targets of these attacks are much broader than the information systems alone. They aim to exploit the potential vulnerabilities and weaknesses of customers, employees, business processes, information systems and security mechanisms at Group buildings and data centers.
A unified Group Security Operation Center (SOC) integrating a level 1, operating in 24x7 is operational.
Several actions have been carried out to strengthen the measures taken to combat cybercrime:
•work to secure websites hosted externally;
•improved website and application security testing capabilities;
•implementation of a Responsible Vulnerability Disclosure program by Groupe BPCE CERT.
Raising employee awareness of cybersecurity
In addition to maintaining the Group’s common foundation for raising awareness of ISS, 2021 was marked by the continuation of phishing awareness campaigns and by the renewal of participation in “European Cybersecurity Month.”
Within the scope of BPCE SA, in addition to recurring reviews of application authorizations and rights to IS resources (mailing lists, shared mailboxes, shared folders, etc.), monitoring of all websites published on the Internet and follow-up of vulnerability treatment plans have been reinforced, as well as monitoring of the risk of data leakage by e-mail or the use of online storage and exchange services.
Moreover, new employee awareness-raising and training campaigns were launched:
•phishing test, phishing awareness campaign and support for employees in situations of repeated failure;
•participation in induction meetings for new employees, including the threats and risks associated with remote working situations.
-
12 OPERATIONAL RISKS
Groupe BPCE has set up a system for measuring non-financial risks through the standardized use of indicators. These cover the indicators of the RAF system, the indicators resulting from the Ministerial Order of November 3, 2014, but also qualitative indicators aimed at measuring the industry’s adherence to operational risk standards.
The Group’s operational risk policy consists of keeping all of these indicators below the set limits, by entity and on a consolidated basis. In the event of an overrun, appropriate measures and corrective actions must be taken by the business lines owning the risks to remedy the possible failures. These measures and corrective actions must be monitored by the committee in charge of operational risks.
-
Organization
The Group Operational Risk division (DROG) – part of the Group Risk division – is in charge of identifying, measuring, monitoring and managing the operational risks incurred in all activities and functions undertaken by Group institutions and subsidiaries.
•central organization and a network of operational risk managers and officers, working in all activities, entities and subsidiaries of Group institutions and subsidiaries;
•in all structures consolidated or controlled by the institution or the subsidiary (banking, financial, insurance, etc.);
-
Methodology
The operational risk management system is part of the Risk Assessment Statement (RAS) and Risk Assessment Framework (RAF) systems defined by the Group. These systems and indicators are adapted at the level of each Group institution and subsidiary.
The mapping methodology is part of the Group’s permanent control system and includes the operational risk, compliance, information system security, personal and property safety and Permanent control functions.
Measurement of risk exposure is based on a forward-looking model, which quantifies and classes risk scenarios and thus provides the Non-Financial Risk Committees with the necessary elements to define their risk tolerance.
Risk-predictive indicators are produced from the main risks identified in the non-financial risk map.
Risk supervision and monitoring were improved through the drafting of reports aimed at providing a uniform measurement to the Group as a whole of its risk exposure and cost of risk.
BPCE’s Operational Risk function ensures that the structure and systems in place at the institutions and subsidiaries allow them to achieve their objectives and fulfill their duties.
•coordinates the function and performs risk supervision and controls at the institutions/subsidiaries and their subsidiaries;
•centralizes and analyzes the Group’s exposure to non-financial risks, verifies the implementation of corrective actions decided by the Operational Risk Committee, and reports any excessive implementation times to senior management;
•performs controls to ensure that Group standards and methods are observed by the institutions and subsidiaries;
•performs a regulatory watch, distributes and relays operational risk alerts due to incidents with the potential to spread to the appropriate institutions/subsidiaries;
•prepares reports, by institution or subsidiary, for the Group and the regulatory authorities (COREP OR), analyzes the reports and content of the OR committees of the institutions and subsidiaries, and notifies the Group Non-Financial Risk Committee of any inadequate systems and/or excessive risk exposure, which in turn notifies the institution in question.
-
Operational risk oversight
1. At the level of each Group institution
2. At Groupe BPCE level
The Operational Risk Committee is responsible for adapting the operational risk management policy and ensuring the relevance and effectiveness of the operational risk management system. Accordingly, it:
•examines major and recurring incidents, and validates the associated corrective actions;
•examines indicator breaches, decides on associated corrective actions, and tracks progress on risk mitigation initiatives;
•examines permanent controls carried out by the Operational Risk function and in particular any excessive delays in implementing corrective actions;
•helps organize and train the network of OR officers;
•determines if any changes need to be made in local insurance policies;
•the frequency of meetings depends on the intensity of the institution’s risks, in accordance with three operational schemes reviewed once a year by the Group Non-Financial Risk Committee (CRNFG) and communicated to the entities.
The CRNFG meets quarterly and is chaired by a member of the Executive Management Committee.
Its main duties are to define the OR standard, ensure that the OR system is deployed at the Group entities, and define the Group OR policy. Accordingly, it:
•examines major risks incurred by the Group and defines its tolerance level, decides on the implementation of corrective actions affecting the Group and monitors their progress;
•assesses the level of resources to be allocated;
•reviews major incidents within its remit, validates the aggregated map of operational risks at Group level, which is used for the macro-level risk mapping campaign;
•monitors major risk positions across all Group businesses, including risks relating to non-compliance, financial audits, personal and property safety, contingency and business continuity planning, financial security and information system security (ISS);
•lastly, validates Group RAF indicators related to non-financial risks as well as their thresholds.
-
Incident and loss data collection
Incident data are collected to build knowledge of the cost of risks, continuously improve management systems, and meet regulatory objectives.
•broaden risk analysis and gain the knowledge needed to adjust action plans and assess their relevance;
-
Operational risk oversight
The operational risk management system relies on a mapping process which is updated annually by all Group entities.
Mapping enables the forward-looking identification and measurement of high-risk processes. For a given scope, it allows the Group to measure its exposure to risks for the year ahead. This exposure is then assessed and validated by the relevant committees in order to launch action plans aimed at reducing exposure. The mapping scope includes emerging risks, risks related to information and communication technologies and security, including cyber risks, risks related to service providers and risks of non-compliance.
This same mapping mechanism is used during the Group’s ICAAP to identify and measure its main operational risks. The operational risk map also serves as a basis for the macro-risk mapping campaign covering the institutions, and thus for the Group overall.
-
Incident alert procedure
The alert procedure for serious incidents has been extended to the entire scope of Groupe BPCE. The aim of this system is to enhance and reinforce the system for collecting loss data across the Group.
An operational risk incident is deemed to be serious when the potential financial impact at the time of detection is over €300,000, or over €1 million for Natixis. Operational risk incidents with a material impact on the image and reputation of the Group or its subsidiaries are also deemed to be serious.
-
Operational risk measurement
Groupe BPCE applies the standardized approach to calculate its capital requirements. Moreover, elements of internal control are considered in the assessment of the Group’s net risk exposures.
HIGHLIGHTS
The following specific measures have been taken to monitor operational risk since the start of the health crisis:
•measurement of impact completeness: joint oversight between CBCP (Contingency and Business Continuity Plan) functions and operational risks, with exchange of information and recognition of operating losses due to Covid-19 (during monthly videoconferencing sessions of institutions’ Operational Risk functions);
•verification of completeness and quality of data input to the information system: weekly check of all operational risk incidents entered by all Group entities to ensure that Covid-19 related losses are clearly flagged as such (control carried out by Operational Risk function team);
•new incidents and monthly increases/decreases are reported for operational risk events related directly or indirectly to the health crisis (COREP view) as of March 1 (external fraud; execution, delivery and process management; damage to physical assets; employment practices and workplace safety; business disruption and systems failures; clients, products and business practice; internal fraud);
•establishment of monthly reporting on Covid-19 losses for submission to the ECB, Group company directors and the Operational Risk function (under the responsibility of the consolidated operational risks team);
•in addition, with the aim of improving risk management, work has been carried out to identify levers (changes in procedures, integration of IT workflows, strengthening of training, etc.) aimed at improving the results of key level one controls and adapting level two controls.
Banking activities
Relevant indicator
Capital
requirementsRisk-weighted
exposureYear n-3
Year n-2
Previous year
Banking activities under basic indicator approach (BIA)
-
-
-
-
-
Banking activities under the Standardized Approach (TSA)/alternative standardized approach (ASA)
23,287
21,810
25,368
3,179
39,741
Standardized Approach (TSA):
23,287
21,810
25,368
Alternative Standardized Approach (ASA):
-
-
-
Banking activities under advanced measurement approach (AMA)
-
-
-
-
-
-
Operational risk mitigation techniques
In terms of Insurance, the networks and subsidiaries benefit from coverage of their insurable operational risks under group Insurance policies contracted from leading Insurance companies. This system is complemented by a reinsurance captive that allows the adjustment of deductible levels.
•as well as the Banque Populaire and Caisse d’Epargne networks, with the exception of the Caisse d’Epargne Rhône Alpes with respect to the “Property Damage” insurance coverage for Registered offices & Similar and their contents (including IS equipment) and the consequent “losses in banking activities”, described below in point E/;
the following main Insurance policies to cover its insurable operational risks and protect its balance sheet and income statement:
A/Combined “Global Banking (Damages to Valuables and Fraud)” & “Professional Civil Liability” policy with a total maximum payout of €215.5 million per year of insurance, of which:
a)€72.5 million per year, combined “Global Banking/Professional Civil Liability/Cyber Risks” and underlying the guaranteed amounts indicated in b) and/or c) and/or d) below,
b)€48 million per claim and per year (sub-limited in “Fraud” to €35 million per claim), dedicated to the “Global Banking” risk only,
d)€70 million per claim and per year, combined “Global Banking/Professional Civil Liability” insurance available in addition to or after use of the amounts guaranteed set out in b) and/or c) above;
the maximum amount that can be paid out for any one claim under this arrangement is €118.5 million under “Professional Civil Liability” coverage and €119 million under “Fraud” coverage in excess of the applicable deductibles;
B/“Regulated Intermediation Liability” (in three areas: Financial Intermediation, Insurance Intermediation, Real Estate Transactions/Management) with a total maximum payout of €10 million per claim and €13 million per year;
C/“Operating Civil Liability” covering €100 million per claim, as well as a “Subsidiary Owner Civil Liability”/“Post Delivery-Reception Civil Liability” coverage extension for up to €35 million per claim and per year of insurance;
E/“Property Damage” to “Registered Offices & Similar” and to their content (including IS equipment) and the consecutive “losses in banking activities,” for up to €300 million per claim (sub-limited to €100 million per claim and €200 million per year for consequential “losses in banking activities”);
F/“Protection of Digital Assets against Cyber-Risks” & the consecutive “losses in banking activities,” for up to €140 million per claim and €196.5 million per year of insurance.
This coverage extends worldwide for initial risk or umbrella risk, subject to certain exceptions, mainly in terms of “Professional Civil Liability” where the policy does not cover permanent institutions based in the United States (where coverage is obtained locally by Natixis’ US operations).
-
Organization
In coordination with the parent banks (BRED) and the insurance companies concerned (Natixis, Oney), Groupe BPCE’s Risk division (DR) ensures that insurance risks (including technical risks) are effectively monitored within the main insurance companies in which the Group is the majority shareholder, i.e., Compagnie Européenne de Garanties et de Cautions (CEGC), Prépar-Vie, Natixis Assurances including its subsidiary BPCE Assurances, and Oney Insurance. In addition, coordination is ensured with Parnasse Garanties and its parent company CASDEN.
Following the agreement to sell 29.5% share capital by Natixis to Arch Capital, Coface is consolidated on the basis of IAS 28 applicable to non-controlled companies. This shareholding no longer falls within the scope of the Group Risk Insurance and Financial Conglomerate functions since June 2020.
Insurance Risk Monitoring Committees (CSRAs) have been formally set up for each company, which meet on a quarterly basis.
In this context, the principle of subsidiarity applies, with checks carried out firstly by the insurance companies, then at the level of the Risk divisions of the parent banks of the companies (Natixis and BRED Banque Populaire), and finally by the Risk division of the parent banks of the companies (Natixis and BRED Banque Populaire). Groupe BPCE’s Risk division, which informs the Group Risks and Compliance Committee (CRCG) every six months.
-
Insurance technical risks
Insurance risk is the risk of any mismatch between expected losses and actual losses. Depending on the insurance products concerned, the risk varies according to changes in macroeconomic factors, changes in customer behavior, changes in public health policy, pandemics, accidents and natural disasters (e.g. such as earthquakes, industrial accidents or acts of terrorism or war). The credit insurance business is also exposed to credit risk.
The management of insurance risks requires a good understanding of the technical insurance risks in order to be able to meet its commitments to policyholders and contract beneficiaries; this is accompanied by special attention to the financial risks borne by assets under representation.
In addition to protecting the balance sheet and income statement of insurance companies, the aim is to guarantee the solvency and liquidity of insurance companies.
To this end, the Group’s companies have put in place effective systems for measuring, reporting and managing risks. The important preparatory phase enabled the implementation of the systems to comply with the new regulatory requirements required since January 1, 2016 with the implementation of the Solvency II directive (Pillar I Quantitative Solvency Requirements, Pillar II Governance & ORSA, Pillar III Prudential reporting and public information).
In addition, since 2011 the Group has deployed an insurance risk unit. This meets the requirements of the Financial Conglomerates Directive 2002/87/EC (FICOD) and its transposition into French law by the Ministerial Order of November 3, 2014 on the supplementary supervision of financial conglomerates, through the Group’s cross-functional insurance risk monitoring system, while at the same time ensuring functional and regulatory interoperability between the banking and insurance sectors.
-
Risks inherent to the Group’s main companies
•the personal insurance business, focused on developing portfolios of life insurance and endowment policies for investment and retirement purposes, as well as personal protection insurance portfolios;
•the non-life insurance business, focused on developing portfolios for auto and multi-risk home insurance, personal accident insurance, legal protection, healthcare and property & casualty insurance.
Given the predominance of the investment solutions activity, the main risks to which Natixis Assurances is exposed are financial. The company is also exposed to underwriting risks (life and non-life), as well as counterparty risk.
Market risk is in large part borne by subsidiary BPCE Vie on the financial assets that underpin its commitments with guaranteed principal and returns (euro-denominated policies: €63.9 billion on the main fund balance sheet). The company is exposed to asset impairment risk (fall in the equity or real estate market, widening spreads, interest rate hikes) as well as the risk of lower interest rates which would generate insufficient income to meet its guaranteed principal and returns. To deal with this risk, BPCE Vie has only sold policies with a minimum guaranteed return in recent years: more than 95% of the policies have a zero minimum guaranteed return. The minimum guaranteed return averages 0.12%. In addition, since mid-2021, the new contracts include a capital guarantee gross of management fees on outstandings.
To manage market risk, the sources of return have been diversified, namely via investments in new asset classes (funding the economy, infrastructure, etc.). This diversification is managed by a strategic allocation, defined on a yearly basis, that takes into account regulatory constraints, commitments to policyholders and commercial requirements.
Credit risk is monitored and managed in compliance with Natixis Assurances’ internal standards and limits. On December 31, 2021, 67% of the fixed-income portfolio is invested in securities rated A or higher.
The main risk to which life insurance underwriting is exposed is associated with the investment solutions activity. In an especially low interest-rate environment, the biggest risk is that of fewer redemptions and/or excessive inflows in euro-denominated vehicles, as reinvestments in securities dilute the main fund’s return. To prioritize inflows in unit-linked policies, measures have been taken, such as the creation of unit-linked products and communication campaigns, and a communication campaign targeting customers and the network.
The non-life insurance underwriting risk to which Natixis Assurances is exposed is borne by its subsidiary BPCE Assurances:
•premium risk: to ensure that the premiums paid by the policyholders match the transferred risk, BPCE Assurances implemented a portfolio monitoring policy whereby each policy is given a score based on its track record over three years. The score factors in types of claims, number of claims, their cost and other variables specific to the activity in question (degree of liability and bonuses/penalties for auto insurance, for instance). This supervision policy also helps to detect potential risks arising from large claims, and to arrange adequate reinsurance coverage;
•risk of loss: each time inventory is taken, an actuarial assessment of the provisions for claims payable is conducted based on methods widely recognized by the profession and required by the regulator;
•catastrophe risk: catastrophe risk is the exposure to an event of significant magnitude generating a multitude of claims (storm, risk of civil liability, etc.). This risk is therefore reinsured either through the government in the event of a natural disaster or an attack, for example, or through private reinsurers, specifically in the event of a storm or a civil liability claim, or through reinsurance pools.
The counterparty risk to which Natixis Assurances is exposed mainly concerns reinsurance counterparties. The selection of reinsurers is a key component of managing this risk:
•Natixis Assurances deals with reinsurers that are subject to a financial rating by at least one of the three internationally recognized rating agencies, and that have a Standard & Poor’s equivalent rating of A- or higher;
Compagnie Européenne de Garanties et Cautions is the Group’s Security and Guarantee insurance entity. It is exposed to underwriting risk, market risk, reinsurer default risk and operational risk.
In an economic context marked by a rebound in growth, the production of real estate loans guaranteed by CEGC has reached its highest level ever. The year 2021 recorded a very low claims ratio of nearly 15% of earned premiums (gross reinsurance ratio), partly due to a reversal of a portion of the claims provisioned in 2020 and not reported in 2021.
Under the Solvency 2 prudential regime, CEGC uses a partial internal model, approved by the ACPR. It meets the robustness requirements specific to the various real estate loan guarantors.
In 2021, CEGC benefited from a €75 million capital increase to reinforce the structure of eligible capital to cover the Solvency Capital Requirement.
Underwriting risk is the main risk incurred by CEGC. It is essentially a counterparty risk, as the commitments given by CEGC to beneficiaries of guarantees result in direct exposure to individual or corporate insured parties. These regulated commitments, provisioned under liabilities in the balance sheet, amounted to €2.85 billion on December 31, 2021 (up 13% compared to end-2020).
CEGC activities
December 2021
Change December 2021
versus December 2020
Individual customers
2,553
12.8%
Single-family home builders
47
37.2%
Property administrators – Realtors
14
(12.4%)
Corporate customers
50
16.6%
Real estate developers
21
(3.0%)
Small businesses
98
13.2%
Social economy – Social housing
55
7.9%
Structured collateral
11
58.2%
TOTAL
2,851
12.9%
CEGC’s short-term investment portfolio totaled around €3.32 billion on its balance sheet on December 31, 2021 hedging underwriting provisions. The amount of unrealized capital gains reached at December 31, 2021 is €200.3 million (-€42 million vs. December 31, 2020).
Market risk associated with the short-term investment portfolio is limited by the company’s investment choices.
The company’s risk limits are set out in the financial management charter and the asset management agreement established with Ostrum. As an insurance company, CEGC does not require funding, since insurance premiums are collected before the disbursement of claims. Nor does CEGC carry transformation risk: the investment portfolio is entirely backed by own funds and technical reserves.
in millions of euros
12/31/2021
12/31/2020
Balance
sheet value,
net of
provision
In%
Mark to
market
Balance
sheet value,
net of
provision
In%
Mark to
market
Equities
260
7.84%
322
272
9.10%
286
Bonds
2,286
68.92%
2389
2,126
71.10%
2,324
Diversified
249
7.51%
256
197
6.60%
204
Cash
267
8.05%
267
163
5.40%
163
Real estate
199
6.00%
215
192
6.40%
208
FCPR
25
0.75%
38
18
0.60%
26
Private debt
28
0.84%
28
19
0.60%
19
Other
2
0.06%
2
2
0.10%
2
TOTAL
3,317
100%
3,518
2,989
100%
3,231
CEGC hedges its liability portfolio by implementing a reinsurance program tailored to its activities.
In loan guarantees, reinsurance is used as a tool for regulatory capital management. It protects guarantee beneficiaries in the event of an economic recession leading to a loss of up to 2% of outstanding guaranteed loans.
In the corporate segments, the program is used to protect CEGC’s capital by hedging against high-intensity risks. It has been calibrated to cover three major individual loss events (loss related to a counterparty or a group of counterparties) with the potential to significantly impact CEGC’s income statement.
-
Asset Management risks
Like the system adopted for the Insurance business line, the operation of this system is based on subsidiarity with the Risk divisions of the parent banks and business lines; in particular, Natixis Investment Managers, which consolidates most of the Group’s assets under management.
By setting up an Asset Management Risk System, the Risk division pursues the following main objectives:
1.identify the major risks that could impact the Group’s solvency trajectory as a Financial Conglomerate to cover its banking or Conglomerate prudential ratios;
2.be associated with the contributions of the sector during Group exercises (ICAAP, PPR, stress test, etc.) so as to identify the risks of the business model on the contribution to results and equity, quantify them and prioritize them;
3.organize the management of the system by specifying a risk review and setting up a formal quarterly meeting;
4.inform General Management by presenting a summary of the review of the risks of our Asset Management activities to the CRCG.
In the Asset Management business line, the Risk division formally ensures: the coordination of the risk system (cross-functional workshops or focus); running cross-functional projects related to the banking sector; information to General Management with a summary report for the members of the CRCG.
Due to its large majority, the system relies mainly on Natixis Investment Managers. The re-use of existing work and methodologies locally is favored to establish supervision at the Group level. Key risk monitoring indicators are determined with Natixis IM in coordination with Natixis.
-
Additional monitoring of the Financial Conglomerate
Groupe BPCE, identified by the ACPR/ECB as a financial conglomerate due to the absolute and relative size of its banking and insurance activities, is subject to the related additional monitoring requirements(1). Since the entry into force of the Single Supervisory Mechanism (SSM), the ECB has coordinated the supervision of predominantly banking financial conglomerates.
As regards the financial conglomerate, CNP Assurances, in which BPCE is a minority shareholder, is subject to Group supervision because of its significance. This is done through a dedicated mechanism (CNP complementary monitoring committee) set up between the two groups. This committee is governed by internal rules, which set out the procedures for exchanging information necessary for the organization of this monitoring, and the rules of confidentiality applicable to its members.
The regulation related to the conglomerate requires an overview of the entire accounting consolidation scope (banking, insurance, Asset Management and non-financial sector). Additional monitoring focuses on:
•the financial conglomerate approach aims to capture the main interactions between the banking, insurance and asset management sectors that could, due to an exogenous or endogenous event, impact the Group’s risk profile and its main trajectories (results, solvency, liquidity);
(1)
Directive 2002/87/EC of December 16, 2002 (as amended) on the additional supervision of credit institutions, insurance companies and banks belonging to a financial conglomerate, transposed into French law by the French law Order No. 2004-1201 of November 12, 2004, and the order of November 3, 2014 on the additional supervision of financial conglomerates.
•it makes it possible to consolidate the banking and insurance sector metrics, in particular capital requirements;
•Complementary supervision is based mainly on the banking system as a whole, and on the insurance and asset management risks.
In order to provide a forward-looking view of the Group’s solvency through the financial conglomerate’s reading grid, Groupe BPCE projects the excess equity over several years under different scenarios. The conglomerate’s excess equity is monitored in the Group’s RAF (Risk Appetite Framework) first-rate indicators.
The entire system, in its main dimensions – Insurance, Asset Management, Banking, Financial Conglomerate – is the subject of presentations and discussions with the joint ECB/ACPR supervision team, in particular at meetings dedicated to the JST (Joint Supervisory Team). In particular, the organization of the risk management system, as well as the main analyzes and points of attention brought to the attention of BPCE’s General Management during the year, are reviewed.
In a conglomerate approach, a global and integrated system of solvency trajectories and stress tests has been developed. This system encompasses and is based on the three regulations Solvency II, Basel III and Financial Conglomerate. The application of common assumptions in these three dimensions provides a holistic view of the Group’s solvency.
•coordinating the Group’s approach to insurance sector stress tests, in particular the Solvency II ORSAs; from the determination of the detailed financial assumptions common to the companies, to the analysis at Group level of the results;
•analysis of the various simulations, with particular attention paid to contagion mechanisms and regulatory interactions (Solvency II(1), Basel III, Financial Conglomerate).
The Group’s insurance companies are included in the banking STI (Internal Stress Tests) as part of the ICAAP (Internal Capital Adequacy Assessment Process) normative approach. The modeling includes:
•stressed insurance parameters (based on ORSA, Own Risk and Solvency Assessment) in addition to the economic and financial parameters used by the Group;
•the simulation of Solvency II ratios, SCR and MCR, in order to objectify any capital requirements;
•the simulation of IFRS variables (Net income retained or distributed, OCI, value and difference in equity method, etc.) impacting the bank solvency ratio in accordance with prudential specifications;
•fees and commissions paid by companies to the Group’s distribution payment networks or asset managers.
CNP Assurances has been part of the Group’s ICAAP approach since the establishment of the Complementary Supervisory Committee (CSC CNP).
As part of the ICAAP Economic Approach, the RPNB division has developed an Economic Capital model for Participations Assurance risk (carry and step-in risk). Designed in coordination with the BPCE/Natixis Finance divisions and the companies’ Risk divisions, this model makes it possible to evaluate and monitor, using an internal economic approach, the bank capital consumed by insurance. It aims to enhance the joint management of the risk/profitability ratio.
-
14.1 Governance and structure
•the CSR division, reporting to the Chairman of the Management Board. It steers the development and implementation of the climate strategy;
•the Climate Risk department created on September 1, 2021, reporting to the Risk division. It is responsible for measuring, monitoring and controlling climate change-related risks for the entire Group, in conjunction with the climate risk correspondents in the Risk divisions of the institutions and subsidiaries;
•during the Climate Risk Committees, chaired by the Chairman of the Management Board. They monitor the implementation of Groupe BPCE’s operational strategy for managing climate and environmental risks and prepare matters for the attention of the Supervisory Board’s Risk Committee.
The Climate Risk department relies on a network of more than 50 climate correspondents set up in 2020, within the Risk divisions of the institutions in the Banque Populaire and Caisse d’Epargne networks, as well as in the Group’s subsidiaries. Their main mission is to keep abreast of the work of the Climate Risk department and regulatory developments in order to be able to report them to the executive of their institution and, if necessary, to its governing bodies, with a view to putting them into operation.
As recommended by the ACPR in May 2020 in its document “Governance and management of climate risks”, Groupe BPCE has also set up climate referents within each network who review quarterly with the Climate Risk department the status of projects developed, their deployment and the prioritization of future projects.
-
14.2 Acceleration of the integration of climate and environmental risks
Identification and assessment of climate risks
The identification of climate risks, their management and their control are fundamental steps in the definition of a climate strategy geared towards environmental transition.
For Groupe BPCE, climate risks correspond to the vulnerability of its activities to climate change. A distinction can be made between physical climate risk, which is directly related to extreme weather events caused by climate change, and transitional climate risk, which is related to the necessary adaptation of our activities and those of our customers to combat climate change.
The materiality of the risks associated with climate change is assessed by reference to the main categories of risk, such as credit risk, market risk and operational risk. Groupe BPCE has therefore put in place a robust system for identifying climate risk factors that could impact the Group’s traditional risks, together with precise monitoring.
-
14.3 Credit risk
ESG sector policies
Since 2019, the Group’s global risk policy, which is reflected in the sector policies, has included climate, environmental, social and governance criteria. These criteria are updated regularly at each sector policy review by the Non-Financial Risk Committee (CoREFi), and then validated at the Sector Watch Committee led by the Credit Risk department.
The ESG criteria, including climate, are established by the CoREFi, composed of the Climate Risk, Credit Risk and CSR teams. Each sector will be reviewed, at a minimum, every two years and more frequently depending on needs and current events.
CoREFi’s rating and analysis methodology were validated by the Standards and Methods Committee on June 12, 2020. In 2021, CoREFi made its ESG rating methodology more robust by refining and expanding its analysis of ESG issues. This methodology is shared with the Group’s institutions and subsidiaries.
-
14.4 Financial risks
ESG analysis of the liquidity reserve
Groupe BPCE refinances itself in the markets and is attentive to the ESG performance of the cash acquired on the markets. By way of illustration, each Banques Populaires and Caisses d’Epargne institution has had access to the ESG rating of its liquidity reserve since the third quarter of 2021 through a Power BI tool dedicated to bond securities. A standard is in progress to limit any investment in securities below one ESG rating grade.
-
14.5 Awareness and training
Deployment of a thematic version of the Risk Pursuit on climate risks
The Climate Risk Pursuit is an interactive training tool that has been developed by the Climate Risk department of the Risk division. This tool aims to raise awareness and train the Group’s employees on climate risks, their impacts and environmental, social and governance issues. At the end of December 2021, 16,220 Groupe BPCE employees had completed the training.
-
14.6 Regulatory environment
Drafting of the Task Force on Climate-related Financial Disclosures (TCFD) report
The TCFD, a working group set up by the G20 Financial Stability Committee, aims to promote climate-related financial transparency. Groupe BPCE will publish its first TCFD report on October 21, 2021. This report presents Groupe BPCE’s actions in support of the transition to a low-carbon economy and adaptation to the effects of climate change. The TCFD report is structured around four themes: Governance, Strategy, Risk Management and Indicators, which allows for a uniform presentation of how companies are taking climate issues into account in their organization and strategy.
-
16.1 Internal control policy
General organization of permanent control
The internal control system defined by the Group contributes to the control of risks of all kinds and is governed by an umbrella charter – the Group Internal Control Charter – which stipulates that this system is designed, in particular, to ensure “[...] the reliability of financial and non-financial information reported both inside and outside the Group”. In this context, the Group has defined and put in place a permanent control system to ensure the quality of the accounting and financial information in accordance with the requirements defined by the order of November 3, 2014 on internal control and all other regulatory obligations relating to the quality of reporting (in particular those resulting from the application of the provisions of EU Regulation No. 2019/876 (CRR2) or Recommendation No. 239 issued on January 9, 2013 by the Basel Committee on Banking Supervision regarding the implementation of the “Principles for aggregating risk data and risk notification”.
-
16.2 Statement on the publication of information required under Pillar III
I certify that, to the best of my knowledge, disclosures provided in this document in relation to Pillar III comply with part 8 of CRR Regulation (EU) No. 575/2013 (and subsequent modifications) and have been prepared in accordance with the internal control framework agreed at BPCE management body level.
-
17.1 Index to Pillar III report tables
Pillar III report
table number
Title
Report page
Pillar III 2021
OWN FUNDS
EU KM1
Key indicators
8
EU CC2
Reconciliation between regulatory capital and the balance sheet in the audited financial statements
44
BPCE01
Phased-in regulatory capital
48
BPCE02
Changes in CET1 capital
49
BPCE03
Breakdown of non-controlling interests (minority interests)
49
BPCE04
Change in AT1 equity
50
BPCE05
Changes in Tier 2 capital
50
EU OV1
Overview of risk-weighted assets
51
BPCE06
Risk-weighted assets by type of risk and by business line
52
EU INS1
Non-deducted participations in insurance undertakings
52
BPCE07
Regulatory capital and Basel III phased-in capital ratios
53
EU LR1 (LRSUM)
Transition from balance sheet to leverage exposure
54
EU LI3
Summary of the differences between the statutory and prudential scope of consolidation
57
EU CC1
Composition of regulatory capital by category
73
BPCE08
Additional Tier-1 capital
77
BPCE09
Issues of deeply subordinated notes
77
BPCE10
Tier-2 capital
77
BPCE11
Issues of subordinated notes
78
EU CCYB1
Geographical distribution of credit exposures relevant for the calculation of the countercyclical capital buffer
79
EU CCYB2
Amount of institution-specific countercyclical capital buffer
79
EU PV1
Prudent valuation adjustment (PVA)
80
EU LR2 (LRCOM)
Leverage ratio
81
EU LR3 (LRSpl)
Breakdown of balance sheet exposures (excluding derivatives, SFTs and exempted exposures)
82
EU INS2
Financial conglomerates – information on capital and capital adequacy ratio
83
EU KM2
Key indicators – TLAC ratio
83
EU TLAC1
Composition TLAC ratio
84
EUTLAC3a
Rank in the hierarchy of creditors – Resolution group
85
CREDIT RISK
BPCE12
Scope of standardized and IRB methods used by the Group
94
BPCE13
EAD breakdown by approach for the main customer segments
94
BPCE14
Concentration by borrower
105
BPCE15
Hedging of non-performing loans
106
EU CQ1
Credit quality of forborne exposures
107
EU CR1
Performing and non-performing exposures and related provisions
108
EU CQ3
Credit quality of performing and non-performing exposures by number of days past due
110
EU CQ4
Quality of non-performing exposures by geography
112
EU CQ5
Credit quality of loans and advances to non-financial corporations by industry
113
EU CR3
Use of credit risk mitigation techniques
114
EU CR1 A
Maturity of exposures
116
EU CQ7
Collateral obtained by taking possession and execution processes
116
Covid-2
Breakdown of loans and advances subject to legislative and non-legislative moratoriums by residual maturity of the moratorium
117
Covid-3
Information on new loans and advances provided under public guarantee schemes in response to the Covid-19 crisis
118
EU CR4
Standardized Approach – Credit risk exposure and mitigation effects
119
EU CR5
Standardized Approach – Exposures by asset class and by risk weighting coefficient, after application of credit risk mitigation techniques
121
EU CR6
IRB approach – Credit risk exposures by exposure class and PD range
123
EU CR6 A
Scope of the use of IRB and SA approaches
130
EU CR7
IRB approach – Effect on risk-weighted assets of credit derivatives used as credit risk mitigation techniques
131
EU CR7 A
IRB approach – Disclosure of the extent of the use of CRM techniques
132
EU CR8
Statement of risk-weighted flows relating to credit risk exposures under the IRB approach
133
EU CR9
IRB Approach – Ex-post control of PDs by exposure class (fixed PD scale)
134
BPCE16
Average PD and LGD broken down by geographical area
141
BPCE17
Ex-post control of LGDs by exposure class
142
EU CR10
Specialized and equity financing exposures subject to the simple weighting method
143
COUNTERPARTY RISK
BPCE18
Breakdown of gross counterparty risk exposures by asset class (excluding other assets) and method
147
BPCE19
Breakdown by exposure class of risk-weighted assets for the credit valuation adjustment (CVA)
147
BPCE20
Securities exposed to counterparty risk on derivative transactions and repurchase agreements
148
EU CCR1
Analysis of counterparty risk exposure by approach
148
EU CCR2
Capital requirement for credit valuation adjustment (CVA)
149
EU CCR3
Standardized Approach – Counterparty risk exposures by regulatory portfolio and risk weighting
150
EU CCR4
IRB approach – Counterparty risk exposures by exposure class and PD scale
152
EU CCR5
Composition of collateral for counterparty risk exposures
154
EU CCR6
Credit derivative exposures
154
EU CCR7
Risk-weighted asset flow statements for counterparty risk exposures under IMM
155
EU CCR8
Exposure to central counterparties (CCPs)
155
BPCE21
Notional amount of derivatives
156
SECURITIZATION
BPCE22
Breakdown of exposures by type of securitization
163
BPCE23
Breakdown of EAD and RWA by type of portfolio
163
BPCE24
Breakdown of investor securitization exposures in the banking book by rating
164
BPCE25
Breakdown of investor and sponsor securitization exposures in the trading book
165
EU SEC1
Banking book – Securitization exposures
166
EU SEC3
Banking book – Securitization exposures and associated regulatory capital requirements (originator and sponsor positions)
167
EU SEC4
Banking book – Securitization exposures and associated regulatory capital requirements (investor positions)
168
BPCE26
Banking book – Breakdown of securitization outstandings
169
EU SEC2
Trading book – Securitization exposures
169
EU SEC5
Securitization exposures – Exposures in default and specific credit risk adjustments
170
MARKET RISK
BPCE27
Groupe BPCE VaR – Breakdown by risk class
177
BPCE28
VaR – Evolution
177
BPCE29
Main hypothetical stress tests
178
BPCE30
Main historical stress tests
178
BPCE31
Group stress test average
178
BPCE32
RWA and capital requirements by type of risk
179
BPCE33
Change in risk-weighted assets by impact
179
EU MR1
Market risk under the Standardized Approach
180
EU MR3
Internal Model Approach (IMA) values for trading books
180
EU MR4
Comparison of VaR estimates with profit/loss
181
EU MR2A
Market risk under the Internal Models Approach (IMA)
181
EU MR2B
Risk-weighted asset flow statements for market risk exposures under the Internal Models Approach (IMA)
182
BPCE34
Natixis Global VaR with guarantee – Trading book (VaR 99% 1-day)
183
BPCE35
Breakdown by risk class and netting
183
BPCE36
Natixis stressed VaR
184
BPCE37
IRC indicator
184
BPCE38
Natixis stress test results
185
LIQUIDITY, INTEREST RATE AND EXCHANGE RATE RISKS
BPCE39
Liquidity reserves
193
BPCE40
Liquidity gaps
193
BPCE41
Sources and uses of funds by maturity
194
BPCE42
Interest rate gap
197
EU IRRBB1
Sensitivity of the economic value of Tier 1 capital
197
BPCE43
Outstanding amounts of financial instruments subject to benchmark index reform
197
EU LIQ1
Liquidity coverage ratio (LCR)
200
EU LIQ2
Net stable funding requirement (NSFR)
201
EU AE1
Encumbered and unencumbered assets
202
EU AE2
Collateral received
203
EU AE3
Sources of encumbrance
204
OPERATIONAL RISKS
EU OR1
Capital requirements for operational risk and risk-weighted exposure amounts
226
OTHER RISKS
BPCE44
Amount of CEGC regulated commitments
232
BPCE45
CEGC investment portfolio
232
-
17.2 Pillar III cross-reference table
CRR Article
Topic
Pillar III report reference
Pillar III
report pages
435
Objectives and risk management policy
4 Governance and risk management system
26-40
436
Scope of consolidation
3 Capital management and capital adequacy
44; 57-72
437
Capital
3 Capital management and capital adequacy
48-50; 73-76
438
Capital requirements
3 Capital management and capital adequacy
51-52
439
Exposure to counterparty credit risk
6 Counterparty risk
146-156
440
Capital buffers
3 Capital management and capital adequacy
42-43; 79
441
Global systemically important indicators
BPCE website – Investment/regulated information section
Regulatory publications
442
Credit risk adjustments
5 Credit risk
91-93 ;106-111
443
Encumbered assets
9 Liquidity risk
202-205
444
Use of external credit rating agencies
5 Credit risk
98-100
445
Exposure to market risk
8 Market risk
172-185
446
Operational risk
11 Operational risk
224-228
447
Banking book equity exposures
5 Credit risk
143-144
448
Exposure to interest rate risk for banking book positions
9 Liquidity, interest rate and exchange rate risks
196-197
449
Exposure to securitization positions
7 Securitization transactions
158-170
450
Remuneration policy
BPCE website – Investment/regulated information section
Other information
451
Leverage
3 Capital management and capital adequacy
54; 81-82
452
Use of the IRB approach for credit risk
5 Credit risk
94-100
453
Use of credit risk mitigation techniques
5 Credit risk
94-100;119-122
454
Use of advanced measurement approaches for operational risk
11 Operational risk
N/A
455
Use of internal market risk models
8 Market risk
1175; 180-185
458
Macroprudential supervision measures
3 Capital management and capital adequacy
79
-
17.3 Glossary
Acronyms
EBA
The European Banking Authority, established by EU regulation on November 24, 2010. It came into being on January 1, 2011 in London, superseding the Committee of European Banking Supervisors (CEBS). This new body has an expanded mandate. It is in charge of harmonizing prudential standards, ensuring coordination among the various national supervisory authorities and performing the role of mediator. The goal is to establish a Europe-wide supervision mechanism without compromising the ability of the national authorities to conduct the day-to-day supervision of credit institutions.
ABS
See securitization
ACPR
Autorité de contrôle prudentiel et de résolution (ACPR): French prudential supervisory authority for the banking and insurance sector (formerly the CECEI, or Comité des établissements de crédit et des entreprises d’investissement/Credit Institutions and Investment Firms Committee)
AFEP-MEDEF
Association française des entreprises privées – Mouvement des entreprises de France/French Association of Private Sector Companies – French Business Confederation
AFS
Available For Sale
ALM
Asset/Liability management
AMF
Autorité des marchés financiers (AMF), the French financial markets authority
AT1
Additional Tier 1
BCBS
Basel Committee on Banking Supervision, an organization comprised of the central bank governors of the G20 countries, tasked with strengthening the global financial system and improving the efficacy of prudential supervision and cooperation among bank regulators.
ECB
European Central Bank
EIB
European Investment Bank
BMTN
Negotiable medium-term notes
BRRD
Banking Recovery and Resolution Directive
CCF
Credit Conversion Factor
CDO
See securitization
CDPC
Credit Derivatives Products Company, i.e. a business specializing in providing protection against credit default through credit derivatives
CDS
Credit Default Swap, a credit derivative contract under which the party wishing to buy protection against a credit event (e.g. counterparty default) makes regular payments to a third party and receives a pre-determined payment from this third party should the credit event occur.
LTD
Loan-to-Deposit ratio, i.e. a liquidity indicator that enables a credit institution to measure its autonomy with respect to the financial markets
CLO
See securitization
CMBS
See securitization
CEGC
Compagnie Européenne de Garanties et de Cautions
CET1
Common Equity Tier 1
CFP
Contingency Funding Plan
CNCE
Caisse Nationale des Caisses d’Epargne
CPM
Credit Portfolio Management
CRD
Capital Requirements Directive
CRR
Capital Requirements Regulation
CVA
Credit Valuation Adjustment: the expected loss related to the risk of default by a counterparty. The CVA aims to take into account the fact that the full market value of the transactions may not be recovered. The method for determining the CVA is primarily based on the use of market inputs in connection with the practices of market professionals.
CVaR
Credit Value at Risk: the worst loss expected to be suffered after eliminating the 1% worst-case scenarios, used to determine individual counterparty limits.
DVA
Debit Valuation Adjustment (DVA): symmetrical to the CVA. Represents the expected loss, from the counterparty’s perspective, on valuations of derivative liabilities. It reflects the impact of the entity’s own credit quality on the valuation of these instruments.
EAD
Exposure at Default: the amount owed by the customer at the effective default date. It is the sum of the remaining principal, past due payments, accrued interest not yet due, fees and penalties.
OFR
Own Funds Requirements: i.e. 8% of risk-weighted assets (RWA)
EL
Expected Loss: the value of the loss likely to be incurred given the quality of the structure of the transaction and any measures taken to mitigate risk, such as collateral. It is calculated by multiplying exposure at risk (EAD) by Probability of Default (PD) and by Loss Given Default (LGD).
DVA
Debit Valuation Adjustment (DVA): symmetrical to the CVA. Represents the expected loss, from the counterparty’s perspective, on valuations of derivative liabilities. It reflects the impact of the entity’s own credit quality on the valuation of these instruments.
EURIBOR
Euro Interbank Offered Rate: the benchmark interest rate on the Eurozone’s money market
FBF
Fédération bancaire française (French Banking Federation): a professional body representing all banking institutions in France
FCPR
Fonds commun de placement à risque/Venture capital investment fund
FGAS
Fonds de garantie à l’accession sociale/French State guarantee fund for subsidized loans
FINREP
FINancial REPorting
SRF
Single Resolution Fund
FSB
The Financial Stability Board: whose mandate is to identify vulnerabilities in the global financial system and to implement principles for regulation and supervision in the interest of financial stability. Its members are central bank governors, finance ministers and supervisors from the G20 countries.
GAP
Asset/Liability management
G-SIBs
Global Systemically Important Banks are financial institutions whose distress or failure, because of their size, complexity and systemic inter-dependence, would cause significant disruption to the financial system and economic activity. These institutions meet the criteria established by the Basel Committee and are identified in a list published in November 2011 and updated every year. The constraints applicable to G-SIBs increase with their level of capital.
HQLA
High-Quality Liquid Assets
Non-life insurance policies (IARD)
Incendie, accidents et risques divers/property and casualty Insurance
IASB
International Accounting Standards Board
ICAAP
Internal Capital Adequacy Assessment Process: a process required under Pillar II of the Basel Accords to ensure that firms have sufficient capital to cover all their risks.
ILAAP
Internal Liquidity Adequacy Assessment Process: Process provided for in Pillar II of the Basel Accords through which the Group ensures the adequacy of its liquidity level and its management with regard to all its liquidity risks
IFRS
International Financial Reporting Standards
IRB
Internal-Ratings Based: an approach to capital requirements based on the financial institution’s internal rating systems
IRBA
Advanced IRB approach
IRBF
Foundation IRB approach
IRC
Incremental Risk Charge: the capital requirement for an issuer’s credit migration and default risks, covering a period of one year for fixed income and loan instruments in the trading book (bonds and CDSs). The IRC is a 99.9% Value at Risk measurement; i.e. the greatest risk obtained after eliminating the 0.1% worst-case scenarios.
L&A
Loans and Advances
LCR
Liquidity Coverage Ratio: a measurement introduced to improve the short-term resilience of banks’ liquidity risk profiles. The LCR requires banks to maintain a reserve of risk-free assets that can be converted easily into cash on the market in order to cover its cash outflows minus cash inflows over a 30-day stress period without the support of central banks.
LBO
Leveraged Buyout
AML-CTF
Anti-Money Laundering and Counter Terrorism Financing
LGD
Loss Given Default, a Basel II credit risk indicator corresponding to loss in the event of default
MDA
Maximum Distributable Amount, a new provision for banks placing restrictions on their dividend, AT1 coupon and bonus payments (under a rule that tightens restrictions as banks deviate from their requirements), if the capital buffers are not met. As these buffers are on top of Pillars I and II, they apply immediately if the bank fails to comply with the combined requirements.
SSM
Single Supervisory Mechanism
MREL
Minimum Requirement for own funds and Eligible Liabilities
MRU
Single Resolution Mechanism
NPE
Non-Performing Exposure
NPL
Non-Performing Loan
NSFR
Net Stable Funding Ratio: this ratio is intended to strengthen the longer-term resilience of banks through additional incentives meant to encourage banks to finance their operations using more structurally stable resources. This long-term structural liquidity ratio, applicable to a one-year period, was formulated to provide a viable structure for asset and liability maturities.
OH
Obligations de financement de l’habitat/Housing financing bond
BCP
Business Continuity Plan
PD
Probability of Default: the likelihood that a counterparty of the bank will default within a one-year period
RMBS
See securitization
RSSI
Responsable de la sécurité des systèmes d’information/Head of Information System Security
RWA
Risk-Weighted Assets. The calculation of credit risks is further refined using a more detailed risk weighting that incorporates counterparty default risk and debt default risk
S&P
Standard & Poor’s
SCF
Société de crédit foncier/a French covered bond issuer
SEC
US Securities and Exchange Commission
SFH
Housing Finance Company
IS
Information System
SREP
Supervisory Review and Evaluation Process:
Methodology for assessing and measuring the risks faced by each bank. SREP gives the prudential authorities a set of harmonized tools to analyze a bank’s risk profile from four different angles: business model, governance and risk management, risk to capital, and risk to liquidity and funding.
The supervisor sends the bank the SREP decisions at the end of the process and sets key objectives. The bank must then “correct” these within a specific time
SRM
Single Resolution Mechanism: an EU-level system to ensure an orderly resolution of non-viable banks with a minimal impact on taxpayers and the real economy. The SRM is one of the pillars of the European Banking Union and consists of an EU-level resolution authority (Single Resolution Board – SRB) and a common resolution fund financed by the banking sector (Single Resolution Fund – SRF).
SVaR
Stressed Value at Risk: the SVaR calculation method is identical to the VaR approach (historical or Monte Carlo method, scope – position, risk factors – choices and modeling – model approximations and numerical methods identical to those used for VaR) and involves a historical simulation (with “one-day” shocks) calculated over a one-year stressed period, at a 99% confidence level scaled up to 10 days. The goal is to assess the impacts of stressed scenarios on the portfolio and current market levels.
T1/T2
Tier 1/Tier 2
TLAC
Total Loss Absorbing Capacity: a ratio applicable to G-SIBs that aims to ensure that each G-SIB has the capacity to continue its essential operations for the economy even after a loss has consumed all of its capital. In November 2015, the FSB published the final TLAC calibration: all TLAC-eligible instruments will have to be equivalent to at least 16% of risk-weighted assets at January 1, 2019 and at least 6% of the leverage ratio denominator. TLAC will subsequently have to be equivalent to 18% of risk-weighted assets and 6.75% of the leverage ratio denominator from January 1, 2022.
TRS
Total Return Swap, i.e. a transaction whereby two parties exchange the income generated and any change in value on two different assets over a given time period.
TSS
Titres supersubordonnés/deeply subordinated notes: perpetual bonds with no contractual redemption commitment that pay interest in perpetuity. In the event of liquidation, they are repaid after other creditors (subordinated loans). These securities pay annual interest contingent on the payment of a dividend or the achievement of a specific result.
VaR
Value at Risk: a measurement of market risk on a bank’s trading book expressed as a monetary value. It allows the entity performing the calculation to appraise the maximum losses liable to be incurred on its trading book. A statistical variable, VaR is always associated with a confidence interval (generally 95% or 99%) and a specific time frame (in practice, one day or 10 days, as the trading positions involved are meant to be unwound within a few days).
Key technical terms
Netting agreement
A contract whereby two parties to a forward financial instrument (financial contract, securities loan or repurchase agreement) agree to settle their reciprocal claims under these contracts through a single consolidated net payment, particularly in the event of default or contract termination. A master netting agreement extends this mechanism to different transactions through one all-encompassing contract.
Equities
An equity security issued by a corporation, representing a certificate of ownership and entitling the holder (the “shareholder”) to a proportional share in the distribution of any profits or net assets, as well as a voting right at the General Meeting.
Rating agency
An organization that specializes in assessing the creditworthiness of issuers of debt securities, i.e. their ability to honor their commitments (repayment of capital and interest within the contractual period).
Risk appetite
Level of risk, expressed through quantitative or qualitative criteria, by type of risk and business line, that the Group is prepared to accept given its strategy. The risk appetite exercise is one of the key strategic oversight tools available to the Group’s management team.
Standardized approach
An approach used to determine capital requirements relative to credit risk, pursuant to Pillar I of Basel II. Under this approach, the risk weightings used when calculating capital requirements are determined by the regulator.
Basel II (the Basel Accords)
A supervisory framework aimed at better anticipating and limiting the risks borne by credit institutions. It focuses on banks’ credit risk, market risk and operational risk. The terms drafted by the Basel Committee were adopted in Europe through a European directive and have been applicable in France since January 1, 2008.
Basel II (the Basel Accords)
Changes in banking prudential standards which incorporated the lessons of the financial crisis of 2007-2008. They complement the Basel II Accords by strengthening the quality and quantity of minimum own funds that institutions must hold. Basel III also establishes minimum requirements for liquidity risk management (quantitative ratios), defines measures aimed at limiting procyclicality in the financial system (capital buffers that vary according to the economic cycle) and reinforces requirements for financial institutions deemed to be systemically important.
“Bank acting as originator”
See securitization
“Bank acting as sponsor”
See securitization
“Bank acting as investor”
See securitization
CRD IV/CRR
(See Acronyms.) Directive No. 2013/36/EU (CRD IV) and regulation (EU) No. 575/2013 (CRR), which transpose Basel II in Europe. In conjunction with the EBA’s (European Banking Authority) technical standards, they define European regulations for the capital, major risk, leverage and liquidity ratios.
Cost/income ratio
A ratio indicating the portion of net banking income used to cover operating expenses (the company’s operating costs). It is calculated by dividing operating costs by net banking income.
Collateral
A transferable asset or guarantee pledged to secure reimbursement on a loan in the event the borrower fails to meet its payment obligations.
Haircut
The percentage by which a security’s market value is reduced to reflect its value in a stressed environment (counterparty risk or market stress).
Derivative
A financial security or financial contract whose value changes based on the value of an underlying asset, which may be either financial (equities, bonds, currencies, etc.) or non-financial (commodities, agricultural products, etc.) in nature. This change may coincide with a multiplier effect (leverage effect). Derivatives can take the form of either securities (warrants, certificates, structured EMTNs, etc.) or contracts (forwards, options, swaps, etc.). Exchange-traded derivatives contracts are called futures.
Credit derivative
A financial product whose underlying asset is a credit obligation or debt security (bond). The purpose of the credit derivative is to transfer credit risk without transferring the asset itself for hedging purposes. One of the most common forms of credit derivatives is the credit default swap (CDS).
Senior non-preferred debt
Senior non-preferred debt is a category of securities, receivables, instruments or rights introduced by directive (EU) No. 2017/2399 amending directive No. 2014/59/EU (BRRD) that, in the event of the insolvency of the credit institution, rank higher than the securities, receivables, instruments or rights considered as subordinated, but lower than that of the other securities, receivables, instruments or rights considered as senior (including preferred senior debt).
Senior Preferred
Preferred senior debt is a category of securities, receivables, instruments or rights that, in the event of the insolvency of the credit institution, rank higher than other securities, receivables, instruments or rights considered as senior and subordinated (including senior non-preferred debt).
Gross exposure
Exposure before the impact of provisions, adjustments and risk mitigation techniques
Tier 1 capital
Core capital including the financial institution’s consolidated shareholders’ equity minus regulatory deductions
Tier 2 capital (T2)
Supplementary capital mainly consisting of subordinated securities minus regulatory deduction
Fair value
The price that would be received to sell an asset or paid to transfer a liability in a standard arm’s length transaction between market participants at the measurement date. Fair value is therefore based on the exit price.
Liquidity
In a banking context, liquidity refers to a bank’s ability to cover its short-term commitments. Liquidity also refers to the degree to which an asset can be quickly bought or sold on a market without a substantial reduction in value.
Rating
An appraisal by a financial rating agency (Fitch Ratings, Moody’s, Standard & Poor’s) of the creditworthiness of an issuer (company, government or other public entity) or a transaction (bond issue, securitization, covered bond). The rating has a direct impact on the cost of raising capital.
Bond
A portion of a loan issued in the form of an exchangeable security. For a given issue, a bond grants the same debt claims on the issuer for the same nominal value, the issuer being a company, a public sector entity or a government.
Pillar I
Pillar I sets minimum requirements for capital. It aims to ensure that banking institutions hold sufficient capital to provide a minimum level of coverage for their credit risk, market risk and operational risk. The bank can use standardized or advanced methods to calculate its capital requirement.
Pillar II
Pillar II establishes a process of prudential supervision that complements and strengthens Pillar I.
It consists of:
•an analysis by the bank of all of its risks, including those already covered by Pillar I;
•an estimate by the bank of the capital requirement for these risks;
•a comparison by the banking supervisor of its own analysis of the bank’s risk profile with the analysis conducted by the bank, in order to adapt its choice of prudential measures where applicable, which may take the form of capital requirements exceeding the minimum requirements or any other appropriate technique.
Pillar III
Pillar III is concerned with establishing market discipline through a series of reporting requirements. These requirements – both qualitative and quantitative – are intended to improve financial transparency in the assessment of risk exposure, risk assessment procedures and capital adequacy.
Common Equity Tier 1 ratio
Ratio of Common Equity Tier 1 (CET1) capital to risk-weighted assets. The CET1 ratio is a solvency indicator used in the Basel III prudential accords.
Leverage ratio
Tier 1 capital divided by exposures, which consist of assets and off-balance sheet items, after restatements of derivatives, funding transactions and items deducted from capital. Its main goal is to serve as a supplementary risk measurement for capital requirements.
Total capital ratio
Ratio of total capital (Tier 1 and 2) to risk-weighted assets (RWA)
Resecuritization
The securitization of an exposure that is already securitized where the risk associated with an underlying pool of exposures is tranched and at least one of the underlying exposures is a securitization position.
Credit and counterparty risk
The risk of loss from the inability of clients, issuers or other counterparties to honor their financial commitments. Credit risk includes counterparty risk related to market transactions and securitization.
Market risk
The risk of loss of value on financial instruments resulting from changes in market inputs, from the volatility of these inputs or from the correlations between these inputs
Operational risk
Risks of losses or penalties due in particular to failures of internal procedures and systems, human error or external events
Structural interest rate and exchange rate risk
The risk of losses or impairment on assets arising from changes in interest rates or exchange rates. Structural interest rate and foreign exchange risks are associated with commercial activities and proprietary transactions.
Liquidity risk
The risk that a bank will be unable to honor its payment commitments as they fall due and replace funds when they are withdrawn.
Swap
An agreement between two counterparties to exchange different assets, or revenues from different assets, until a given date
Securitization
A transaction whereby credit risk on loan receivables is transferred to investors by an entity through the issuance of negotiable securities. This may involve the transfer of receivables (physical securitization) or the transfer of risks only (credit derivatives). Some securitization transactions are subordinated through the creation of tranches:
•ABS – Asset-Backed Securities, i.e. instruments representing a pool of financial assets (excluding mortgage loans), whose performance is linked to that of the underlying asset or pool of assets;
•CDOs – Collateralized Debt Obligations, i.e. debt securities backed by a pool of assets which can be either bank loans (mortgages) or corporate bonds. Interest and principal payments may be subject to subordination (i.e. through the creation of tranches);
•CLOs – Collateralized Loan Obligations, i.e. credit derivatives backed by a homogeneous pool of commercial loans;
•CMBS – Commercial Mortgage-Backed Securities;
•RMBS – Residential Mortgage-Backed Securities, i.e. debt securities backed by a pool of assets consisting of residential mortgage loans;
•Bank acting as originator: the securitization exposures are the retained positions, even where not eligible for the securitization framework due to the absence of significant and effective risk transfer;
•Bank acting as investor: investment positions purchased in third-party deals;
•Bank acting as sponsor: a bank is considered a “sponsor” if it, in fact or in substance, manages or advises the program, places securities into the market, or provides liquidity and/or credit enhancements. The program may include, for example, asset-backed commercial paper (ABCP) conduit programs and structured investment vehicles. The securitization exposures include exposures to ABCP conduits to which the bank provides program-wide enhancements, liquidity and other facilities.
Net value
Total gross value less allowances/impairments
Volatility
A measurement of the magnitude of an asset’s price fluctuation and thus a measurement of its risk. Volatility corresponds to the standard deviation of the asset’s immediate returns over a given period.